Since the early 1980s, biotechnology products have been a fast-growing sector. They now occupy a significant portion of biologic drugs approved by regulatory authorities around the world every year. Among the approved biologic drug products, as well as those still in clinical testing, many are manufactured by contract manufacturing organizations (CMOs). Sponsor companies often transfer their developed process and process knowledge to CMOs for manufacturing of materials for toxicology and clinical studies.
Drug Product Development

Figure 1: Life cycle of drug-product development
Figure 1 illustrates the usual life cycle of drug product development. Typically drug candidates go through various research screening and optimization stages, with one optimal variant selected and moved into preclinical development. During preclinical development, a selected molecule will be further assessed for preliminary safety and potency through a series of in vitro and in vivo testing. Meanwhile, stage-appropriate manufacturing processes and formulation strategies are developed to enable clinical manufacturing. Once a drug candidate has gone through multiple levels of clinical trials with success, all clinical data and manufacturing information will be assembled based on the applicable regulatory guidance to file a marketing application for final approval. This life cycle generally takes about 10–15 years and costs hundreds of millions of dollars for a project sponsor. Here I focus on only the technology transfer and clinical manufacturing stages.
In the past decade, biotech companies have increasingly adopted the concept of stage-appropriate development with overlapping research activities. Some early development activities and preclinical development can be massively condensed to bring a molecule to clinical testing quickly. This somewhat reduces the biological risk of a given program before significant business and financial commitments are made to that program.
Process Development
The goal of process development is to develop a manufacturing process that produces appropriate quality
and quantity of materials to supply preclinical and clinical studies — and ultimately beyond. Good manufacturing practice (GMP) processes often share some common characteristics such as clear process definition, robustness, and scalability. Key elements that can help a company achieve success in process development include a good understanding of both the target molecule and requirements of the final drug product. Effective tools and strategies can help: e.g., adopting platform and/or standard operations whenever feasible, aligning in-process analytical support up front, and appropriate data documentation that enables a seamless connection from starting molecule to final drug product.
Technology Transfer
Technology transfer is critical in driving a program forward successfully from process development to clinical manufacturing. Its importance has been widely recognized as the biotech industry has matured over the past few decades. The goal of technology transfer is to transfer all process and product knowledge from development to a manufacturing site so that the process can be successfully established — in this case, for clinical manufacturing. The success of such a transfer is assessed by both manufacturing process performance and final-product quality. Some key contributing factors to a successful technology transfer include a knowledge-based and well-documented process; a well-designed technology transfer plan that is clear, simple, and measurable; effective communication; responsible technical and management teams; and risk-assessment and -mitigation plans in place.
Risks and Mitigation Strategies: The two major types of risks often present in a technology transfer process are known/controllable risks and uncertain risks. Common known risks include expression-host strain, process scale-up, manufacturing instruments, operations, and so on. Such risks are typically mitigated by characterization of the host strain, implementation of prevalidated technology and standardized approaches wherever possible, smart process design with built-in extras, and generation of appropriate scale-down models for manufacturing simulation.
Uncertain risks such as manufacturing process and/or scale changes, instrument changes, manufacturing schedule changes, and so on usually happen late in a technology-transfer process, offering project teams very little time to respond when something goes wrong. Some mitigation strategies that are frequently applied and have been proven helpful include development scope expansion (to build extra process flexibility and robustness) and critical product/process parameter identification and control. Project teams should be mentally prepared to “expect the unexpected” and be ready for quick troubleshooting and problem-solving based on knowledge accumulated in process development.
Both types of risks and their corresponding mitigation strategies are detail in the following case studies.
Case Studies
Case Study #1 — Scaling Up Depth Filtration: We developed a filtration train at laboratory scale through an extensive evaluation of different major brands of both charged and uncharged depth filters for product recovery (%), filtrate flux (L/m2/h, LMH), and filter throughput (L/m2). We chose a D0HC prefilter from EMD Millipore because of its higher capacity (Figure 2).
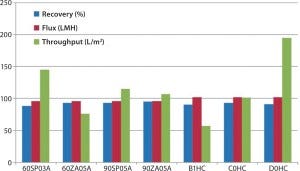
Figure 2: Depth-filter screening at laboratory scale
However, when the manufacturing process was transferred and established at the CMO site, several fermentation process modifications were implemented to improve product quality, including both basal and feed medium and feeding strategy. As a result, the feed stream that went into the filtration train for clarification was noticeably different, with minimal back-pressure built across the D0HC filter and a highly turbid filtrate. So the particle-size distribution of the new feed stream seems to be finer than that of the earlier process, making the D0HC filter no longer effective in protecting the sterile filter that follows it.
We designed and executed a redevelopment plan at laboratory scale using representative materials obtained from the CMO. Figure 3 shows our evaluation data, indicating that most particle sizes are shifted from bigger than the D0HC filter down to ranging between C0HC and X0FC filters.

Figure 3: Redevelopment of depth filtration
The F0HC filter alone shows excellent turbidity reduction but only moderate capacity, which we improved by inserting a C0HC filter as a prefilter. Our redeveloped filtration train — with the combination of C0HC and F0HC filters — demonstrated >150 L/m2 capacity at both laboratory and manufacturing scales. Product recovery was comparable to that of the original clarification process.
Here, the risks came from an unexpected upstream process change. In scale-up of the clarification, the impact was on product recovery and filtration throughput. We carried out a quick process redevelopment to accommodate those process changes without compromising downstream process performance.
Case Study #2 —Scaling Down a UF/DF Operation: An ultrafiltration/diafiltration (UF/ DF) operation is commonly used in downstream processing for buffer exchange and product concentration. Scaling up a UF/DF step is expected to be challenging because of microenvironment differences within membrane cassettes and recirculation vessel at different scales, especially for products that are sensitive to the shear force. However, scaling down a UF/DF process also can be challenging, most likely because of instrument constraints.
Here, the UF/DF process was originally developed by one CMO and successfully used in clinical manufacturing at both 1,500-L and 4,500-L scales. Later, the process was transferred to another CMO for a clinical resupply campaign. During technology transfer from CMO-1 to CMO-2, the latter company performed process establishment runs at 15-L fermentation scale. However, the only UF/DF skid that was available for use in the R&D area was meant for 100-L scale fermentation processes. Although the feed pump setting was kept at a minimal level, the cross-flow flux was still around 1,175 LMH, much higher than 161 and 312 LMH recorded in the previous clinical batches (Table 1).

Table 1: Summary of TFF crossflow rate impact on filter capacity and filtrate turbidity
In the establishment run, 1,175 LMH cross-membrane flux was set during the UF/DF operation, and the resulting retentate was highly turbid, so it immediately plugged the subsequent sterile filter.
This UF/DF failure was ranked as “high-risk” in our risk assessment. The risk-mitigation plan called for root-cause analysis and critical parameter control during clinical manufacturing. Based on a comparison of operating parameters exploited in batches at both CMO sites (as well as subsequent conformational experiments), we quickly identified TFF membrane cross-flow flux as the leading cause of the problem. It could create high shear force through the pump head, which consequently induces precipitation and plugs the filters. As a result, we designated cross-membrane flux as a critical operation parameter, with a range of 150–300 LMH specified for clinical manufacturing.
Our lesson learned from this case study is that the capacity of a UF/DF skid can be a critical operating parameter, so it needs to be reviewed very carefully during facility-fit planning to ensure that UF/DF skid capacity meets operation requirements. An appropriately sized UF/DF skid that could deliver a cross-flow flux of 158 LMH was available in the suite to be used for batch manufacturing, and its performance had been preverified in the 100-L engineering run. Operated at 158 LMH cross-membrane flux, the UF/DF step was accomplished as expected, with a clear retentate solution and ~69 L/m2 retentate processed through the subsequent sterile filter without issues.
Although the UF/DF scale-down challenge detailed here is less common during technology transfer and manufacturing preparation than UF/DF scale-up issues, it does point out the same kind of facility-fit risk. All instrument capacities need to be carefully reviewed against process specifications during facility-fit planning. And to ensure the process operation success, only appropriately sized instruments should be used.
Case Study #3 —Upstream Process Change and Facility Fit: In the later stage of technology transfer, another upstream process change had to be made to accommodate the increased production scale. During fermentation process development, basal media, feed concentrates, and fermentors had been sterilized by autoclave. However, for full-scale manufacturing, steam-in-place (SIP) would be used instead. A quick verification study showed that changing the sterilization method would affect product quality by increasing one specific product variant. That variant would be removed by the last polishing column, where it comes off the column in the late-eluting fractions right after the target product. The increased level of that product variant would affect the polishing column’s purification resolution.
Meanwhile another downstream instrument-related risk we identified during facility-fit planning involves the precision of the elution gradient created by the chromatography skid. Figure 4 shows the manufacturer’s gradient mixing curve.
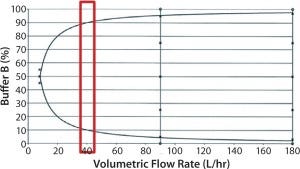
Figure 4: Chromatography skid gradient mixing curve showing target flow rate (red box)
Our targeted operation flow rate was on the low end of the flow rate, as shown in the red box. At that flow rate, the skid can reliably deliver gradient only with >10% and <90% of buffer B. However, elution of the target product and product variant is expected to be around the first 10% of the gradient, so a precise gradient curve is absolutely necessary to achieve the required resolution. We developed a scale-down model to mimic this skid’s gradient curve at scale by running a step elution at 10% gradient followed by a linear gradient of 10–100% (Figure 5, blue trace). Unsurprisingly, most product and product variants elute off the column in the 10% step wash rather than the linear-elution block. Thus, we had achieved only minimal resolution between the product and its variant.
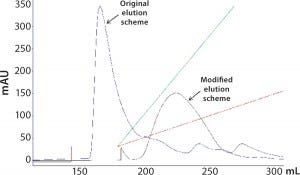
Figure 5: Overlay of the gradient elution profiles before and after the elution-buffer modification
Because it is impossible to change the skid or its pump setting to improve precision of the gradient mixing, our only option left to reduce conductivity of the elution buffer and drive product elution to a higher elution gradient was through modification of the elution buffer. The resulting elution profile is overlayed to the 10% step-elution profile in Figure 5 as the brown trace. Apparently, with the elution buffer modification, product elution is pushed from <10% to 20–30%, for which the chromatography skid can accurately deliver at the low flow rate required for column operation. Because of reduced conductivity in the elution buffer, the product elution peak grew broader, and the product was more diluted. But the overall product recovery was comparable, and the resolution between the product and product variant was improved by the shallower elution gradient and improved precision of the elution gradient mixing. As Figure 6 shows, the increased product-variant levels resulting from the upstream sterilization method change is well resolved on this polishing column using the modified elution strategy.
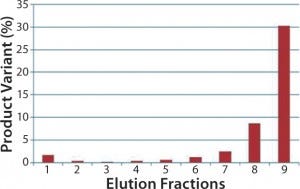
Figure 6: Comparing product-variant resolution on the polishing column
This case study emphasizes risks associated with process scale-up and instrument capabilities. With help from a thoughtfully designed scale-down model, we evaluated the impact of the process change and instrument constrains on downstream process performance at laboratory scale. Then we modified our polishing column elution strategy to accommodate the process change and instrument issue, successfully maintaining downstream process performance.
Solving Problems Together
Technology transfer is an integrated step in the project development life cycle. Regardless of the type of technology being transferred — either between groups within the same organization or from a program sponsor to a CMO — it is rarely an easy or smooth process. Some process changes are inevitable due to facility-fit reasons or differences in operational practices. Those can significantly influence process performance and product quality. More and more companies are using a systematical approach: a gated, stage-based, and quality risk-managed approach guidance of technology-transfer processes for mitigating risks and advancing development programs, while keeping timelines on track and costs low.
From a technical perspective, the process data and knowledge accumulated during process development are of great importance to the success of the technology transfer. They are our primary source of solutions when process adaptation and troubleshooting are necessary. Generally speaking, a process developed with greater flexibility is more likely to excel in technology transfer. In addition to technical components, a successful experience can greatly depend on a clearly defined transfer plan with measureable goals and deliverables, clear governance structures, and effective communication at all levels and groups involved in the process. Most important to remember is that it takes a team effort to succeed.
Author Details
Yun Bai is associate director of purification process development at Ambrx Pharmaceuticals, 10975 North Torrey Pines Road, San Diego, CA 92121; 1-858-875-2400; [email protected]; www.ambrx.com.
Further Reading
1.) Green, S and Warren, P. 2002. Technology Transfer in Practice. Sue Horwood Publishing Ltd.
2.) ICH Q9: Quality Risk Management. US Fed. Reg. 71(106):32105-32107 www.ich.org/fileadmin/Public_Web_Site/ICH_Products/Guidelines/Quality/Q9/Step4/Q9_Guideline.pdf
3.) ICH Q10: Pharmaceutical Quality Systems. 2009. US Fed. Reg. 74(66):15990-15991 www.ich.org/fileadmin/Public_Web_Site/ICH_Products/Guidelines/Quality/Q10/Step4/Q10_Guideline.pdf
4.) Millili, GP. 2011. Scale-Up and Technology Transfer as a Part of Pharmaceutical Quality Systems. Pharmaceutical Quality System (ICH Q10) Conference www.fda.gov/downloads/drugs/developmentapprovalprocess/manufacturing/ucm291604.pdf
5.) Technology Transfer: An International Good Practice Guide for Pharmaceuticals and Allied Industries. Gibson, M. 2005. DHI Publishing, LLC, River Grove, IL
6.) Technology Transfer Task Team. Good Practice Guide: Technology Transfer. International Society of Professional Engineers. Tampa, FL


