Food and Drug Administration (FDA) and European good manufacturing practices (GMPs) require integrity testing of sterilizing-grade filters for producing injectables and other biologics. The diffusion test (also called the forward-flow test) and bubble-point test (also called the disk test) of a sterilizing-grade filter are both filter-integrity tests. The accuracy of both relies on calibration of a pressure sensor in the respective integrity test unit.
Calibration of the pressure sensor of a filter-integrity testing device is an essential part of quality assurance in lot release. If yearly calibration reveals a pressure reading offset outside specifications, then a common conclusion is that the accuracy of all integrity test results from the past year must be questioned. Generally, for a maximum allowable offset of 9 mbar, for example, all test results since the previous calibration are considered reliable if the yearly calibration shows an offset of ≤9 mbar. If the yearly calibration shows an offset >9 mbar — even by only 1 mbar — then all test results since the previous calibration are considered questionable.
PRODUCT FOCUS: PARENTERAL PRODUCTS
PROCESS FOCUS: PURIFICATION, STERILE FILTRATION, QUALITY ASSURANCE
WHO SHOULD READ: PROCESS DEVELOPMENT AND MANUFACTURING
KEYWORDS: INJECTABLES, STERILIZING-GRADE FILTRATION, INTEGRITY TESTING, CALIBRATION
LEVEL: ADVANCED
The limitation of that approach is that the real impact is not evaluated. In some cases, the influence of a calibration offset is negligible. In other cases, the calibration offset overestimates the diffusion (forward flow) value, thereby generating no risk for false conformity test results. Quality assurance divisions need an appropriate factual tool to estimate the actual impact of a calibration offset on integrity test results.
Here I describe an analytical approach of an event-based pressure reading offset based on theory and experimental trials. The method can prevent unnecessary time-consuming quality assurance investigations. It must be adapted to the type of filter-integrity test unit used because of different technological approaches and algorithms.
Methods
A diffusion test measures the amount of gas that — when a given gas pressure is applied on the upstream side of a wetted membrane filter cartridge — dissolves into the wetting liquid and diffuses through the wetted membrane. Capillary forces keep the wetting liquid from being expelled from membrane pores. A filter is considered being integer when the measured diffusion value does not exceed the validated maximum value.
A multipoint diffusion test measures diffusion values at predefined pressures. A diffusion profile is a function of applied gas pressure on the upstream side of a wetted membrane filter cartridge. A multipoint diffusion test is not a common integrity test. Rather, it is typically used for validation to evaluate characteristics of a diffusion profile.
A bubble-point test measures a gradually increasing diffusion rate of a filter cartridge at stepwise higher differential gas pressures. The bubble point is detected when gas flow goes from a diffusion value at a given pressure step pn (pores still filled with wetting liquid) to a bulk flow at pn+1 (biggest pores no longer filled with water). That is characterized by an exponentially increasing gas flow rate through the filter cartridge. An algorithm is used to detect this phenomenon. A filter is considered being integer when the measured bubble point equals or exceeds the validated minimum bubble point.
Figure 1: ()
Figure 2: ()
Test Steps
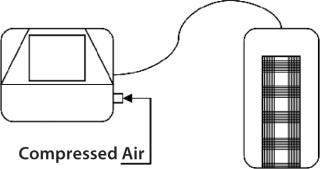
Multipoint diffusion tests were performed on a filter capsule (diffusion tests at increasing pressure levels within the same test sequence). Tests involved the same filter (Figure 3 test setup) using a calibrated integrity test unit. Programmed test pressures were 2,100, 2,300, 2,500, and 2,700 mbar to verify the effect on the test value of the actual test pressure on a given filter. No reference instruments were used. The test was repeated twice for a total of three multipoint diffusion tests.
Figure 3: ()
Table 1:
Table 1:� 194; ()
Table 2:
Table 2:� 194; ()
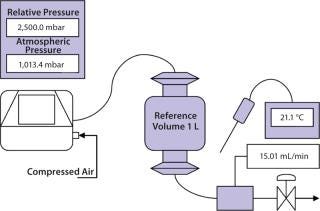
As a second step, diffusion test accuracies of two integrity test units were verified compared with a reference method. The first series of diffusion accuracy measurements (Figure 4 test setup) were conducted when the integrity test units were correctly calibrated. The second series of diffusion accuracy measurements were made after having generated different degrees of pressure reading offsets: 50 mbar full scale on one integrity-test unit; 100 mbar full scale on one integrity-test unit; 200 mbar full scale on both integrity-test units. Such pressure reading offsets are extremely high and may not occur spontaneously in reality. Nevertheless, those extreme settings were necessary for obtaining quantifiable and interpretable test data.
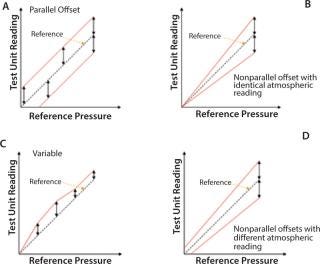
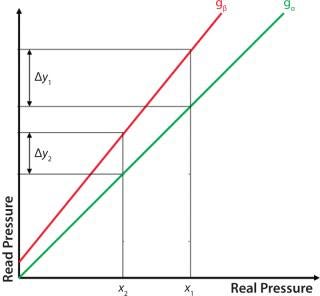
Researchers decided that having an nonparallel pressure reading offset with different atmospheric reading (Figure 2D) was the most representative offset and that more information could be achieved than when having a parallel offset (Figure 2A). The worst case was when the test unit overestimates the test pressure, thereby applying a test pressure that is too low.
Figure 4: ()
Figure 5: ()
As the third step, bubble-point tests were performed on a filter capsule using a calibrated integrity-test unit (Figure 3 setup). One additional series of bubble-point tests was performed on the same filter capsule using the same integrity-test unit, but with a pressure reading offset of 200 mbar full scale. Reference instruments were not used. These tests were repeated for a total of three tests with the calibrated unit and three tests with a 200-mbar pressure reading offset full scale.
Table 3:
Table 3:� 194; ()
Table 4:
Table 4:� 194; ()
Materials
We used the following materials: integrity-test units (Sartocheck 4 v2.03 serial number 17101314 and 17201162); reference manometer GE Drück DPI 150 (absolute and relative pressure reading); and reference gas flow meter Bronkhorst F111 CAAD-22-V. We used a reference temperature sensor Sika MH 3710 and GTF-401 brands. Stainless steel volume and tubings were from Sartorius Stedim, and the filter capsule was a Sartopore 2 Maxicap 0.2 µm (lot 482503, individual number 128).
Table 5:
Table 5:� 194; ()
Table 6:
Table 6:� 194; ()
Table 7:
Table 7:� 194; ()
Figure 6: ()
Test Results
Tables 234567 show the results obtained for all tests. Table 2 lists data from a multipoint diffusion test of a filter capsule using a calibrated integrity test unit. Tables 34567 show results from calibrated and decalibrated tests for the Sartopore 4 integrity-test unit compared with a flow reference.
The influence on the diffusion test value from a pressure reading offset comes from two factors. First, the difference between the displayed test pressure and the actual applied test pressure reduces or increases the driving force of the diffusion test. The results obtained in test 1 (multipoint diffusion test in Table 2) show the effect of test pressure on diffusion test value. Second, the difference in pressure-reading slope affects the pressure drop reading. The results obtained in test 2 (compared with those from a flow reference meter in Tables 34567) show the effect of pressure-reading slope (pressure drop measurement) on diffusion test value. Both factors then must be combined to estimate the cumulative influence on the diffusion test value.
Figure 7: ()
Table 8:
Table 8:� 194; ()
Table 9:
Table 9:� 194; ()
Table 10:
Table 10:� 194; ()
Table 11:
Table 11:� 194; ()
Effect of Deviation in Applied Test Pressure: The influence on the diffusion test value is directly proportional to the deviation of the applied test pressure according to Fick’s law (Equation 1). In that equation, N is the diffusive flux of the test gas, D is the diffusivity of the test gas through the wetting liquid, H is the solubility coefficient of the test gas in the wetting liquid, p is the applied differential pressure, ϕ is the overall porosity of the structure, and L is thickness of the wet layer. Fick’s law is explained in PDA Technical Report 26 (1).
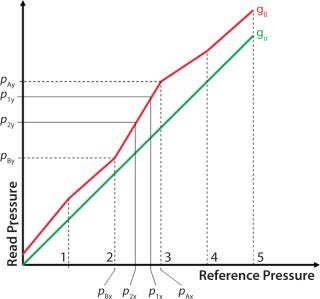
All parameters for a given filter are fixed, so the volumetric flow can be reduced to Equation 2. F is the volumetric diffusive flow, and K1 is the proportionality constant (slope). This equation should be true within a certain range from traditional diffusion test pressure depending on a filter cartridge’s membrane configuration. As Figure 5 shows, linearity ceases to exist when the overproportional bubble-point region has been reached (when the wetting liquid is pressed out from the biggest pores). According to Fick’s law, the effect (as a percentage) on the diffusion value (ΔD) due to a deviation in the applied test pressure (pΔ) during a diffusion test can then be expressed using Equation 3, in which ptest is the normally applied test pressure (mbar relative). Taking an actual pressure reading offset of 200 mbar at 2,500 mbar of differential test pressure, the theoretical value of the pressure deviation influence on the diffusion value is as shown in Equation 4.
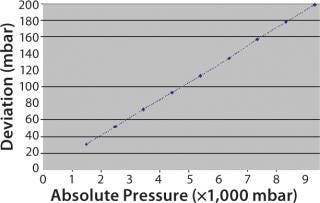
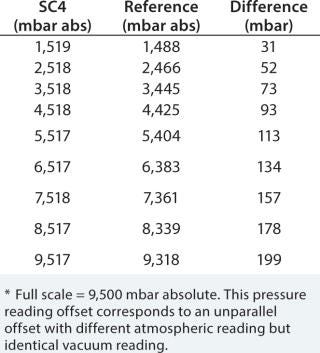
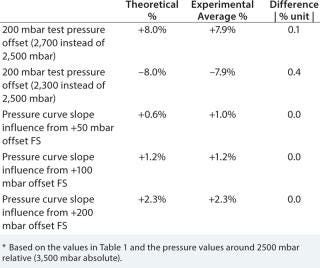
The experimental value based on an average of three multipoint diffusion test measurements on the same capsule was +7.9% for +200 mbar and –7.9% for –200 mbar (Table 2). To get an actual pressure reading offset of 200 mbar at a test pressure of 2,500 mbar — if using the same type of nonparallel offset as in Ta
ble 1 — the full scale (9,500 mbar absolute) offset would have to have been 543 mbar.
Theoretical and experimental results match within the 200-mbar range. The three tests with a 400-mbar test pressure offset (2,100 mbar instead of 2,500 mbar showed a deviation of –13% instead of the expected –16%). So we used this theoretical calculation for pressure reading offsets, which are ≤8% of the programmed test pressure.
Equations
Equation 1:

Equation 2:

Equation 3:

Equation 4:

Equation 5:

Equation 6:

Equation 7:

Equation 8:

Equation 9:

Equation 10:

Equation 11:

Equation 12:

Equation 13:

Equation 14:

Equation 15:

Equation 16:

Equation 17:
Equation 18:

Figure 8: ()
Figure 9: ()
Table 12:
Table 12:� 194; ()
Calculation of Actual Initial Starting Pressure based on Calibration Values: A perfect calibration curve (gα) can be represented as a straight line with slope = 1 and slope intercept = 0, leading to the equation gα = 1x, where x is the real pressure and “y” the pressure read by the integrity test unit. A pressure reading offset curve (gβ) as generated for these trials can also be represented as a straight line but with a different slope (m) and the slope intercept (b) as in Equation 5.
The deviation in pressure reading at a certain reference pressure p1 (here called x1) is illustrated by ▵y1 (Figure 6) and expressed by Equation 6.
In the case of a calibration offset, the interesting portion of the calibration curve are the calibration points pA (the calibration point above p1 — the initial test pressure) and pB (the calibration point below p2 — the pressure at the end of the test) (Figure 7). That means that even if the rest of the pressure deviation values do not form a straight line, the section pA to pB is enough for calculating the impact of the pressure reading deviation on the test pressure.
Equation 7 is used to calculate slope m of the pressure reading curve at the appropriate pressure interval. The slope intercept “b” can be calculated using Equation 8. Based on ▵y = (m – 1)x1 + b, the pressure reading offset at the programmed test pressure, p1 can then be calculated by Equation 9. Here, p1 is the pressure displayed by the integrity test unit (printed on the test report).
Effect of Pressure Reading Slope for Nonparallel Pressure Reading Offset: The diffusion value of the integrity test unit used for these trials is calculated from the pressure drop measurement. The correlation between the pressure drop measurement and the diffusion value is explained in Appendix B of PDA Technical Report 26 (1) and is not the objective of this article.
The integrity-test unit in those trials uses an improved algorithm according to DIN 58356, Part 2, taking into account the diminishing driving force as the pressure decreases over time as in Equation 10. In that equation, D is diffusion in mL/min, p1 is absolute starting pressure, Vnet is the gas net volume of the filter setup; p0 is reference pressure (typically set to 1,000 mbar), t is test time in minutes, and ▵p is the pressure drop during the measurement phase (▵p = p1 – p2).
To obtain an accurate estimation of the pressure reading offset influence, this logarithmic algorithm has to be taken into account using the actual starting pressure (p1 – offset) as calculated above and the corrected pressure drop value we would have had if there had been no pressure reading offset (▵pcorr)
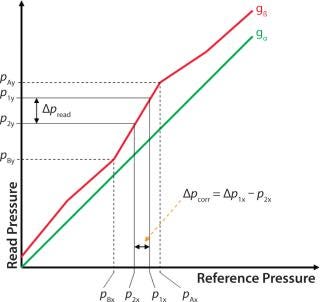
Calculation of the Corrected Pressure Drop: The slope m of the pressure reading offset curve might be different from the slope of the reference (1). In such cases, that difference will affect the measured pressure drop (Figure 8).
The pressure drop measured by the integrity-test unit and printed on the test report is the ▵pread value. The pressure drop value that would have been measured if there had been no pressure reading offset ▵pcorr can be calculated using Equation 11. Here, p1x is the displayed starting pressure (printed on the test report) and p2x is the pressure at the end of the test (p1 – ▵p). The corrected pressure drop must be used in the equation. You can make an estimate by comparing the obtained result as measured by the integrity-test unit with the result obtained with corrected parameters.
The equation for calculating the impact of the difference in slope would then be Equation 12, with with Dcorr and Dprintout defined in Equations 131415 and simplified as shown in Equations 16 and 17.
Putting It All Together
Clearly, the pressure reading offset will influence the diffusion value by
the difference in applied test pressure resulting in a different driving force (as defined by Fick’s law)
the eventual difference in pressure slope reading.
After calculating the correct initial test pressure and the corrected pressure drop value, we used them to estimate the effect on diffusion value, which was measured and printed by an integrity-test unit.
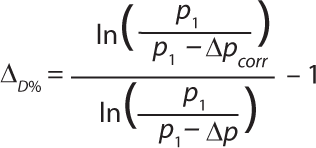
We calculated the expected deviation for a bubble point test with an instrument having a 200-mbar offset at full scale (compared with a calibrated instrument). Using the calibration values in Table 1, we achieved Equation 18.
Correlation Results
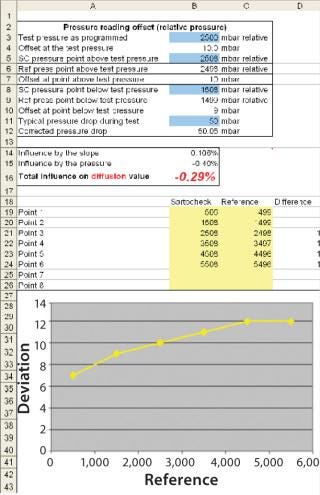
These trials show a very good correlation between theoretical and experimental values. An Excel spread sheet (Figure 9) for calculating the effects from an eventual offset was developed based on algorithms explained herein. For the case of a calibration offset, the calibration values can be entered into the spreadsheet and the overestimation or underestimation of the integrity-test values can be immediately evaluated based on a specific test pressure and surrounding calibration points.
Evaluating the impact as a percentage provides a fast and reliable risk analysis and can be comparable with the documented accuracy of the instrument during operational qualification (OQ). For example, if an instrument shows a diffusion reading error of +1% during OQ when it was perfectly calibrated and –3% based on the pressure reading offset evaluation with the spreadsheet, then its accuracy would still be within instrument specifications (±5%). Quality assurance personnel may then decide whether they need to check individual test results or if the deviation may be classified as without consequences.
The developed spreadsheet may or m
ay not be used for evaluating calibration offset on integrity test units from manufacturers than the one specified in this article.
About the Author
Author Details
Magnus Stering is product manager for Integrity Testing Solutions, Sartorius Stedim Biotech; [email protected].
REFERENCES
1.).
