Mathematical Model for Production of Recombinant Antibody 14D9 By Nicotiana tabacum Cell Suspension Batch CultureMathematical Model for Production of Recombinant Antibody 14D9 By Nicotiana tabacum Cell Suspension Batch Culture
Transgenic plants are increasingly considered a competing system for producing high-value recombinant proteins for biomedical and industrial purposes at affordable costs (1). Researchers have shown that molecular farming (or biopharming) is a secure technology that is capable of rendering valuable recombinant proteins free of toxins and animal pathogens in a relatively short time (2,3,4,5,6). Scientists have also demonstrated that most recombinant antibodies produced in plants maintain their functional properties (substantial bioequivalence) as well as do those produced in mammalian cell cultures (7, 8).
Full antibody 14D9 is an IgG1- type immunoglobulin from mice that catalyzes the enantioselective protonation of prochiral enol ethers (9). Recombinant full antibody r14D9 has been expressed in Nicotiana tabacum plants as well as organ, tissue, and cell-suspension cultures. Highest yields were obtained with the KDEL retrieving signal to the endoplasmic reticulum (Ab-KDEL line) (10, 11).
PRODUCT FOCUS: ANTIBODIES
PROCESSFOCUS: PRODUCTION
WHO SHOULD READ: PROCESS DEVELOPMENT, MANUFACTURING
KEYWORDS: CATALYTIC ANTIBODIES, MOLECULAR FARMING, PHYTOFERMENTATION, SCALE-UP, STIRRED-TANK BIOREACTORS
LEVEL: ADVANCED
To develop a large-scale bioprocess, it is important to optimize that process by balancing biological and engineering variables for maximizing productivity. One bottleneck in biopharming is the scalability and modeling of batch cultures at large scale. Fundamentally, difficulties arise because bioreactors and mathematical models originally were designed for microbial monocultures, precise chemical inputs, and best-case process measures. Those factors have led to computerized or remote-controlled automation mainly for ensuring regulatory compliance (12,13,14,15,16).
Plant cells harbor metabolic processes that are relatively more elaborate than those of microorganisms and involve more genetic and/or metabolic regulatory controls. In addition, suspension-cultured plant cells tend to aggregate, are prone to rapid sedimentation, and are vulnerable to high-shear sensitivity (17). So a mathematical model is needed that acknowledges kinetic and growth processes, basic aspects of cell structure, and physiology and productivity.
Klykov and Kurakov proposed a new combination of structured and unstructured mathematical models for cell cultivation in fed-batch and chemostat systems that resolve certain drawbacks (18,19,20). In that integrated model, the ratio of maintenance energy to energy consumed for biomass growth or the precise rate of accumulation of stable or nondividing cells is taken into account (Figure 1). The model is based on treating the biomass as two main groups: dividing and nondividing cells (using a combination of statistical data and qualitative causal assumptions). So a phytofermentation process is a “mixture” of cells of different ages.This is population characterized by the parameter R (R = Xst/X, in which Xst is the nondividing cell concentration at the synchronized degree R, and X is the biomass). The age structure of a cell population varies. Thus characterizing those variations is fundamental for the structured model.
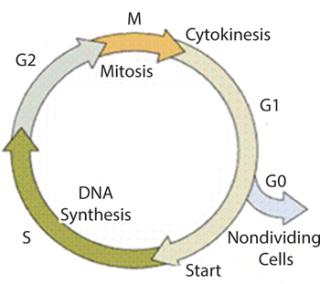
Figure 1: ()
By contrast, the unstructured model is based on decreasing absolute and specific growth rates of the biomass. Those parameters are directly related to biomass concentration at the growth limitation phase when oxygen is limited (GIP). Also in this model, energy substrate consumption rate for viability maintenance m is specified by oxygen and trophic coefficient a that is assumed as a constant (A = m/a). During GIP, the population is synchronized to nonproliferating cells, which consume oxygen only for primary metabolism.
Here, we have scaled up the Ab-KDEL cell-suspension culture from a 225-mL Erlenmeyer flask to a 2-L bioreactor. We used the mathematical model described above to estimate and predict growth rate of cell cultures and expression level of recombinant protein. We used two inoculum sizes to obtain experimental data and to calculate specific growth rates and productivity for testing the model under those two conditions.
Materials and Methods
Experimental Data: Cell Culture and Maintenance: We maintained the Ab-KDEL Nicotiana tabacum cv. Xanthi cell-suspension culture in 225-mL Erlenmeyer flasks containing Murashige and Skoog (MS) modified medium with sucrose 30 g/L, 1-naphtalenacetic acid (2 mg/L), and kinetin (0.2 mg/L) as plant growth regulators as described by López et al. (11). Inoculum size was 5% (w/v), and culture conditions were 24 ± 2 °C, 16-h photoperiod (irradiance = 13.5 mmol/ ms), and 100 rpm in a rotary shaker.
Bioreactor Operation: We used a stirred-tank bioreactor (Minifors, Infors HT) with a 2-L vessel and a mechanical agitation provided by a marine propeller (100 rpm) and a bubble aeration system provided by a porous metal sparger. Working volume was 1 L, and culture conditions were 24 ± 2 °C, a set point aeration of 0.1 vvm, and a 42.7/h starting kLa value. We monitored relative partial O2 pressure (Oxyferm 225, Hamilton) and pH (Mettler Toledo) online using autoclavable electrodes, and performed O2– electrodes calibration with pure N2. We estimated oxygen transfer coefficient (kLa) and oxygen uptake rate (OUR) using the dynamic method both in Erlenmeyer and bioreactor batch cultures (21). For the abovementioned conditions, estimated OUR was 4.57 mmol O2/Lh. We monitored the entire process using Iris Explorer software version 5.2.
Batch Culture: We inoculated a 2-L vessel containing 1-L final volume of MS modified medium with 10-day-old Ab-KDEL N. tabacum cell-suspension cultures at two different inoculum sizes (1% and 5% w/v). We took samples every two days during a 14-day culture period.
Analytical Methods: Cell growth was estimated as fresh biomass weight (FW) and dry biomass weight (DW). We estimated sucrose concentration in the culture medium (11). Total soluble protein content was evaluated with bovine serum albumin as standard (22).
We made plant extract by disrupting plant material in a homogenizer (Polytron PT 10-35, Kinematica) and adding cold phosphate-buffered saline (0.24 g KH2PO4/L, 1.44 g Na2HPO4/L, 0.2 g KCl/L, 8 g NaCl/L, pH 7.0– 7.2) containing 10-g leupeptin/mL. We centrifuged it at 14,000g for 20 min at 4 °C and used the supernatant for
conducting the analytical tests. We performed sodium-dodecyl sulfate polyacrylamide gel electrophoresis (SDS-PAGE) (9%) in a nonreducing condition with a loading volume of 30 µL for each sample and stained it with Coomassie Brilliant blue R-250 (23).
We determined concentration of 14D9 both in biomass extracts and culture media with a sandwich ELISA using goat antimouse antibodies specific for γ and κ chains and a mouse IgG as a standard (Sigma- Aldrich). We measured only those antibodies assembled into γ–κ chain complexes. We evaluated the ability of antibodies to recognize their hapten using direct ELISA and determined antibody integrity using Western blot, which included goat antigamma (γ chain) or antikappa (κ chain) mouse chain–conjugated peroxidase concentration 1:1,000 (Southern Biotechnology). We detected immune complexes after incubation with Supersignal West Pico chemiluminiscent substrate (Pierce Chemical Company).
Mathematical Models: Cell suspension cultivation is often complicated because of cell aggregation, which forms specific zones where cell growth is limited and nondividing cells accumulate. So a cell population rapidly differentiates intodividing and nondividing (stable) cells. To calculate the dynamics of cell growth, it is necessary to take into account the difference in energy substrate metabolism of stable and proliferating cells in such zones and use both structured and unstructured models that were previously successfully applied for batch processes (18, 19).
The equation for unstructured modeling of the logarithmic growth phase (LGP) is Equation 1, in which X is the amount of biomass calculated using an unstructured model; Xp is the maximum estimated amount of biomas; Xlim is the amount of biomass at the start of the limitation of cell growth; and τ and τlim are the terms of the estimated time of cultivation and cultivation duration from start until the beginning of the limitation of cell growth, respectively.
Equation 2 is the structured model for biomass in the growth inhibition phase (GIP). Equation 3 is a structured model for substrate (metabolites) in the growth inhibition phase, in which n is an integer specifying the order of the derivative of this function; Xdiv is the quantity of dividing cells; Xst is the quantity of nondividing (stable) cells; K is the overall growth rate multiplied by the rate of accumulation of stable (or nondividing) cells; A is the ratio of energy required to maintain viability to energy required for biomass accumulation and/or maintaining the rate of accumulation of stable (nondividing) cells. If n = 1, then C = 1; if n = 2, then C = 0. P and S are the metabolite and the substrate, respectively, so that kdivP,S and kstP,S coefficients are constants for synthesis of dividing and nondividing cells.
Equation 1:

Equation 2:

Equation 3:

Parameter A, which was not used in any practical way earlier, estimates periodic culture growth and describes a delay of total biomass growth rate. Delay of growth during the growth inhibition phase (GIP) occurs because of a presence of limitation factors such as low concentrations of dissolved oxygen, nutrients, medium heterogeneity, or other variables that provoke growth arrest. During GIP, the share of stable cells within the population is equal to that of nonproliferating cells, which consume energy. At that point, accumulation of stable cells occurs at a constant specific rate equal to that of the growth delay (A = m/a). On the basis of the present model, we described consumption of substrates used for cell construction and synthesis of metabolites in the cultures consisting of two groups of cells differing in energy consumption. Specific growth rate of biomass X per hour (µ), maximum culture specific growth rate (µmax), and other significant parameters were calculated according to methods decribed previously (19).
Statistical Analysis: We carried out independent experiments in duplicate. Samples were taken every two days during each assay. We performed analytical determinations in triplicate and ANOVA in each test. A Tukey test established significant differences (p < 0.05).
Results and Discussion
We selected kLa as the criterion for scaling up the process — with the same value in both the Erlenmeyer flask and the bioreactor (42.7/h), which is in the expected range (10–50/h) for plant cell-suspension cultures (21). The high aeration and homogenization levels attained in this bioreactor are advantageous because they produce a gentle flow (preventing the formation of cell clumps) and a moderate shear stress (1).
Figure 2 shows the growth phase during Ab-KDEL suspension culture at the two inoculum sizes tested. The growth curves show that the lag phase extended to the fourth day for bothmanuscript.inoculum sizes. That was followed by an exponential phase up to the eighth day for 1% w/v (Figure 2A) and to the 10th day for 5% w/v inoculum size (Figure 2B). Then both cultures reached stationary phase.
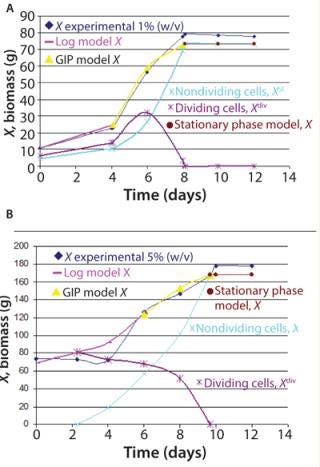
Figure 2: ()
We found significant differences (p < 0.05) regarding growth (80 g/L and 180 g/L maximal biomass in 1% and 5% w/v inoculum size, respectively). This underlines the significance of the inoculum density, which affects cell physiology, nutrient and oxygen avoidance, and rheological and physical characteristics of the batch culture. The complexity of this biological phenomenon requires use of nonlinear mathematical models to identify growth parameters and design a predictable model (20). Based on the Klykov–Kurakov model, consumption rate of substrates used for primary and secondary metabolites and expression of the recombinant prote
in in the cultures are determined by the energy demand of the two groups of cells (Equation 3). Figure 2 also shows a comparative analysis of dividing and nondividing cells at both inoculum sizes using both unstructured and structured models. The dividing cells (log model, X) match experimental data and grow to day four or six, depending on the inoculum size (1% or 5% w/v, respectively). The model also predicts the proliferation of nondividing cells (shown by the GIP) and a decrease in dividing cell population (which entered stationary phase between days 8 and 10), as observed in the experimental data. The experimental coefficient µmax showed significant differences between 1% w/v (max = 0.201/d) and 5% w/v (0.073/d) inoculum sizes, in accordance with the model applied (Figure 2).
Furthermore, pH values vary during the cultivation in accordance with earlier experimental data and predicted dynamics of the biomass in the batch cultures (Figure 3). The pH showed an initial acidification of the media followed by an increase up to the end in both cultures. Progressive acidification result from preferential ammonium (NH4 +) uptake by the cells. After ammonium depletion, increased pH promotes consumption of available nitrate (NO3-). In addition, we observed significant differences in relative acidity measured in both batch cultures (Figure 3). The batch inoculated with the smaller inoculum showed less acidification — followed by a pronounced alkalinity — than the batch inoculated at 5% w/v. That could result from rapid rate of cell growth and availability of nutrients in culture. Such variations in pH profile were also observed in cell suspensions of various species (24). Growth and pH follow the same performance, which is also in accordance with the model applied.
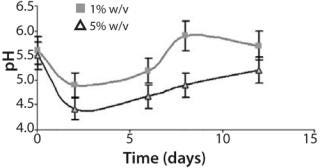
Figure 3: ()
Figure 4 shows the dynamics of the population age for 1% and 5% w/v inoculum sizes and the subsequent prediction of antibody r14D9 accumulation. According to the model, we assumed that proliferating cells produce the recombinant protein. Expression of r14D9 began on the fourth day, when cell proliferation ends, continued up to the tenth day (1% inoculum size) or eighth day (5% inoculum size), and then abruptly decayed. The mathematical model calculated with the dividing and nondividing cell populations (LOG + GIP + destroy 1%, model calculation in Figure 4) matches experimental data. Maximum r14D9 was produced at lower inoculum size, an experimental result predicted by the model.
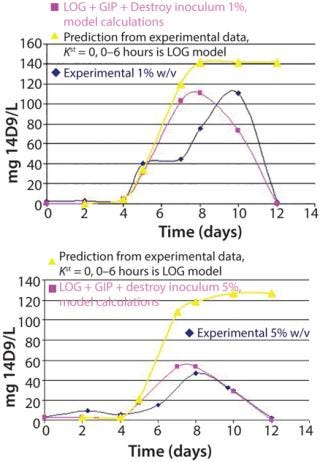
Figure 4: ()
Recombinant antibody accumulation seems to be time-dependent, although expression is under the constitutive promoter CAMV 35S — as was reported for plant, organ, tissue, and cell cultures (10, 11, 23, 24). Antibody decay could be due to degradation of recombinant protein by proteases, loss of tertiary and quaternary antibody structure, or antibody adsorption by the glass of the vessel (11, 12). By contrast, recombinant protein is produced upon initial entering into stationary phase when protease activity is incremented. This proteolysis could explain the abrupt loss of recombinant protein at the end of the cultures.
Figure 5 shows the SDS-PAGE and Western blot of a biomass extract from the batch inoculated with 1% w/v. Under nonreducing condition, it is shown as a single band corresponding to the r14D9, with a molecular mass of about 150 kDa (Figure 5A). That antibody size corresponds to the assembled IgG with both expected chains (γ2κ2) (11, 23). Results under reducing and nonreducing conditions revealed that the r14D9 was correctly assembled (Figure 5B).
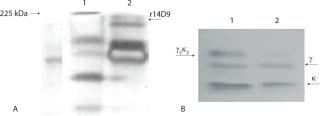
Figure 5: ()
Successful Cultivation Model
Performance of the N. tabacum in vitro cultures expressing the recombinant antibody 14D9 (Ab-KDEL line) was analyzed when transferred from 225-mL Erlenmeyer flask to a 2-L bioreactor. The best performance of the N. tabacum in vitro cultures expressing the antibody r14D9 in a 2-L bioreactor corresponds to the culture initiated with the lowest inoculum size (1% w/v) as the mathematical model predicts. The proposed modeling approach for cultivation of plant cells using a structured model reflects the real dynamics of changes in the age structure of cell populations in the batch cultivation. Separation of the growing cell population based on physiological age into two groups — dividing cells and stable cells (nondividing) — allows for application of a structured model for scaling up from bench scale to a phytofermentor. Processing data obtained during cultivation and according to the structured model provides the opportunity for deeper understanding of the dynamics of changes occurring in cell populations, accurate prediction of both the dynamics of biomass growth and biosynthesis of a target protein or metabolite, and significant reduction of the cost of improving cultivation of cells on an industrial scale.
About the Author
Author Details
Corresponding author PL Marconi and MA Alvarez are researchers at Instituto de Ciencia y Tecnología Dr. César Milstein, CONICET-Fundación Pablo Cassará, Saladillo 2468, Ciudad de Buenos Aires, Argentina (C114O FFX), 54-11-4886-5242, fax 54-11-4886 4065; [email protected]. SP Klykov is senior researcher and VV Kurakov is CEO, both at PHARM-REGION, Ltd., c.1, b.10, Baryshikha St., Moscow, 125222, Russia.
REFERENCES
1.) Huang, T, and K McDona
ld. 2012. Bioreactor System for In Vitro Production of Foreign Proteins Using Plant Cell Cultures. Biotechnol. Advances 30:398-409.
2.) De Muynck, B, CB Navarre, and M Boutry. 2010. Production of Antibodies in Plants: Status After Twenty Years. J. Plant Biotechnol 8:529-563.
3.) Paul, C, and J Ma. 2011. Plant-Made Pharmaceuticals: Leading Products and Production Platforms. Biotech. Appl. Biochem. 58:58-67.
4.) Yuan, D. 2011. The Potential Impact of Plant Biotechnology on the Millennium Development Goals. Plant Cell Rep. 30:249-265.
5.) Ma, J. 2005. Current Perspectives on the Production of Pharmaceuticals in Transgenic Plants. EMBO Rep. 6:593-599.
6.) Franconi, R, OC Demurtas, and S Massa. 2010. Plant-Derived Vaccines and Other Therapeutics Produced in Contained Systems. Expert Rev. Vaccines 9:877-892.
7.) Zimran, A. 2011. Pivotal Trial with Plant Cell–Expressed Recombinant Glucocerebrosidase, Taliglucerase Alfa: A Novel Enzyme Replacement Therapy for Gaucher Disease. Blood 118:5567-5773.
8.) Zeitlin, L. 2011. Enhanced Potency of a Fucose-Free Monoclonal Antibody Being Developed as an Ebola Virus Immunoprotectant. PNAS 108:20690-20694.
9.) Reymond, J-L. 1993. Antibody Catalyzed Hydrolysis of Enol Ethers. J. Am. Chem. Soc. 115:3909-3917.
10.) Martinez, C. 2005. Expression of the Antibody 14D9 in Nicotiana tabacum Hairy Roots. EJB 8:170-176.
11.) López, J. 2010. Influence of the KDEL Signal, DMSO, and Mannitol on the Production of Recombinant Antibody 14D9 By Long-Term Nicotiana tabacum Cell Suspension Culture. Plant Cell Tissue Organ 103:307-314.
12.) Monod, J 1942.Recherches sur la Croissance des Cultures Bacteriennes2nd ed, Hermann and cie, Paris.
13.) Pirt, SJ 1975.Principles of Microbe and Cell Cultivation, Blackwell Publishing, Oxford.
14.) Leudeking, R, and EL Piret. 1959. A Kinetic Study of Lactic Acid Fermentation. J. Biochem. Microbiol. Technol. Eng. 1:393.
15.) Derbyshev, VV. 2001. The Development Populations in Conditions of Limitation By Energy Supply. Biotechnol. 2:89-96.
16.) Klykov, SP. 1996. Effect of Culture Growth Rate on Salmonella Survival. Biotechnol. 1:35-39.
17.) Shih, S, and P Doran. 2009. Foreign Protein Production Using Plant Cell and Organ Culture: Advantages and Limitations. Biotechnol. Advances 27:1036-1042.
18.) Klykov, SP. 2011. A Cell Population Structuring Model to Estimate Recombinant Strain Growth in a Closed System for Subsequent Search of the Mode to Increase Protein Accumulation During Protealysin Producer Cultivation. Biofabrication 3:045006.
19.) Klykov, SP, and VV Vladimir. 2012. New Kinetic Structured Model for Cell Cultivation in a Chemostat. BioProcess Int. 10:36-43.
20.) Klykov, SP, and VV Vladimir. 2013. Analysis of Bacterial Biomass Growth and Metabolic Accumulation. BioProcess Int. 11:36-43.
21.) García-Ochoa, F, and E Gomez. 2009. Bioreactor Scale-Up and Oxygen Transfer Rate in Microbial Processes: An Overview. Biotechnol. Adv. 27:153-176.
22.) Bradford, MM 1976. A Rapid and Sensitive Method for the Quantification of Microgram Quantities of Protein Utilizing the Principle of Protein-Dye Binding. Anal. Biochem. 72:248-254.
23.) Petruccelli, S. 2006. A KDEL-Tagged Monoclonal Antibody Is Efficiently Retained in the Endoplasmic Reticulum in Leaves, but Is Both Partially Secreted and Sorted to Protein Storage Vacuoles in Seeds. J. Plant Biotechnol. 4:511-527.
24.) Cui, X-H. 2010. Production of Adventitious Roots and Secondary Metabolites by Hypericum perforatum L. in a Bioreactor Bioresources Technol. 101:4708-4716.
You May Also Like


