Host-cell proteins (HCPs) constitute an inevitable impurity of biopharmaceutical products originating from recombinant-cell culture. HCPs are a heterogeneous mix of different proteins, their specific characteristics depending on the kind of organism used as an expression platform, on the “destination” of the expressed recombinant product (extra- or intracellular), and on the corresponding purification approach (1–3). Contamination of a final drug substance with residual HCPs could lead to immunogenic reactions in some patients who receive the drug product (DP). So a reliable method for identifying — and quantifying — HCPs is an integral component of biopharmaceutical purification processes and quality specification of a final drug product.
Generic protein-detection methods such as total protein stains are insufficiently sensitive, especially in the presence of a great excess of recombinant product. Tscheliessnig, et al. overviewed methods for HCP detection, classifying them into immunospecific (immunoassays, Western blotting) and nonspecific (electrophoresis and MS-based) technologies (3). In most cases, enzyme-linked immunosorbent assays (ELISAs) have become the method of choice for HCP measurements (1, 2, 4, 5). They are based on polyclonal antiHCP antisera generated with a representative HCP mix originating from a null cell-line culture.
Because most expression systems are based on bacterial and mammalian cells, a broad range of “generic” HCP assays are commercially available for such platforms. However, a growing amount of evidence suggests a lack of efficiency in HCP detection for those assays (3, 5), so a fine tuning of such ELISAs probably is necessary (6). Because plant-based expression systems such as Physcomitrella patens have emerged only recently as an alternative to established recombinant-protein production platforms, corresponding plant-specific solutions for HCP quantification are needed. Here also, a specific immunoassay (ELISA) seems to be the method of choice (7, 8), although use of specifically tailored mass-spectrometric (MS) techniques has been reported. Nevertheless, development of a plant-cell–specific HCP assay (combined with identification of the most potent plant HCPs) has yet to be described.
Greenovation Biotech GmbH is a German biopharmaceutical company developing treatments for rare diseases using its proprietary BryoTechnology manufacturing platform based on moss (Physcomitrella patens) as an expression platform. This plant-based system strictly eliminates animal-derived media and strain components, making it free of zoonotic pathogens. Moss-expressed biopharmaceuticals meet high quality standards because plants can perform complex posttranslational modifications — and specifically, the moss is highly accessible to stable genetic engineering. The system thus allows for product-tailored solutions that could ameliorate a number of therapeutic outcomes (9, 10).
In 2014, Greenovation completed the first good manufacturing practice (GMP)–compliant production of its leading clinical candidate: human alpha-galactosidase (αGal) for treatment of Fabry disease. To meet requirements for release of DP material to be used in the phase 1 clinical trial in Germany, it was necessary to develop a P. patens– specific HCP immunoassay in collaboration with BioGenes GmbH.
Although not in the main scope of industry-driven research, identity and composition of a species-specific HCP cocktail can be of interest for better understanding of this expression system. Ultimately this could help improve it over time (e.g., through targeted development of specific knock-out strains). Here, we report our development of a P. patens– specific HCP ELISA, which we used subsequently for quantification of HCPs during GMP-compliant production of moss-made αGal. Moreover, we used 2D gel electrophoresis and LC–MS-MS analysis to identify major HCPs present in the supernatant of P. patens culture.
Antigen Preparation
Our representative HCP preparation came from a “mock” culture of the fucose/xylose double-knockout mutant (FT3/XT-ko) used as a background for most of Greenovation’s producer strains (11–13). In that strain, moss genes for plant-type fucosyl- and xylosyl-transferases have been deactivated by a homologous recombination technique, leading to humanized N-glycans (11). Because the HCP amounts are low in supernatant from our standardized fermentation process with P. patens, we needed a 100-L cultivation scale to obtain sufficient amounts of antigens for subsequent rabbit immunization.
The FT3/XT-ko strain was cultured for four weeks in a 100-L (200-L nominal volume) disposable Cellbag 200 bag (GE Healthcare) placed in a BioWave 200 SPS rocking bioreactor (GE Healthcare). The main culture parameters — medium, time, gas exchange, light intensity, and addition of osmotic active substances leading to protein secretion — corresponded to standard conditions used for manufacturing of most protein products at Greenovation. We determined the supernatant HCP concentration using a standard Bradford assay. At the end of cultivation (28 days), that concentration was 13 mg/L.
Moss biomass reached 4.5 g/L dry weight and was subsequently separated from the supernatant with the following filtration cascade:
moss harvest through cake filtration in a customized PP filtration housing (14) equipped with a 8.0- to 20.0-µm Seitz K900 320D filter (Pall GmbH)
depth filtration through two nominal exclusion sizes: Supracap 100 NP6P7001 and Supracap 100 NP8P0501 (Pall)
0.45-µm and 0.2-µm Sartopore 2 5445307H9 sterile filtration (Sartorius Stedim Biotech).
We divided the combined sterile filtrate into two batches, concentrating both and rebuffering them with tangential-flow filtration (TFF) on a Centramate 500S TFF cross-flow filter (Pall). Equipped with a 10-kDa cut-off DC010T12 T-Series TFF cassette with Delta regenerated cellulose membrane (Pall), it delivered
550 mL HCP antigen mix with ~370 mg/L protein concentration in Tris-based buffer, subsequently used for rabbit immunization and characterization of the HCP antigen mix
1.9 L HCP antigen mix with ~47 mg/L protein in 0.01 M phosphate-buffered saline (PBS) solution, used for preparation of an affinity column for subsequent purification of antibodies from rabbit antisera.
To maximize the amount of antigen for rabbit immunization in one injection round, we further concentrated the 550-mL HCP antigen mix with ultrafiltration using a 10-kDa cut-off Amicon ultrafiltration cell (EMD Millipore) to a final concentration of ~890 mg/L. Again, we determined the protein content of antigen pools using a standard Bradford assay.
Development of Anti-HCP Antibodies
We injected the concentrated HCP antigen mix into five rabbits, repeating those immunization injections 11 times over the course of six months to secure broader antigen recognition (5, 15). We bled the animals eight times, including a terminal bleeding. Altogether, we collected a 1.1-L antiserum pool from all animal bleedings and used an aliquot of 200 mL for affinity purification against the HCP antigen mix. We prepared an affinity matrix according to manufacturer’s instructions (GE Healthcare) by coupling ~25 mg of the HCP antigen mix onto Bromocyanactivated Sepharose chromatography media. Subsequently, we affinity-purified an antiserum volume of 200 mL to generate capture antibodies (antimoss-HCP-IgG at a concentration of 2.14 mg/mL).
A 13-mg aliquot of the isolated capture antibody served as starting material for preparation of detector antibodies. We dialyzed it against PBS and conjugated it with biotin to prepare detector antibodies that in turn would react with the enzyme conjugate (streptavidin-conjugated peroxidase). For biotin conjugation of the antibodies, we used a 40-fold molar excess of the biotinylation reagent (biotinamidohexanoic acid N-hydroxysuccinimide ester from Sigma-Aldrich) over immunoglobulin G (IgG). Then we removed the biotinylation reagent by dialysis in Tris-buffered saline and mixed the resulting antimoss-HCP-IgG-Biotin (0.79 mg/mL) with NaN3 for preservation.
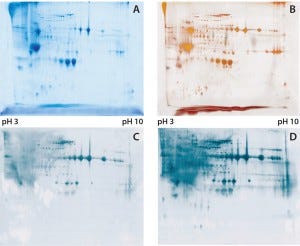
Figure 1: (A) Two-dimensional (2D) sodium-dodecyl sulfate polyacrylamide gel electrophoresis (SDSPAGE) total protein Coomassie stain of the Physcomitrella patens HCP antigen mix, 600 µg protein per gel; (B) 2D SDS-PAGE total protein silver stain of the P. patens HCP antigen mix, 300 µg protein per gel; (C) quality control testing of the total antiserum pool by 2D Western blot, 300 µg protein per gel; (D) quality control testing of the capture antibody by 2D Western blot, 300 µg protein per gel
To check the quality of our generated antibodies and ensure their recognition and coverage of P. patens HCP mix, we performed twodimensional (2D) analyses and compared the total protein pattern of the HCP antigen mix visualized with Coomassie and silver staining (Figures 1A and B) with HCP-specific Western blot patterns, using both the antiserum pool and the affinity-purified capture antibodies. As Figures 1C and 1D show, clearly stained HCP-specific Western blot signals appeared over the whole molecular weight range in both cases of 2D Western blotting. Those signals agreed well with the in-gel stained total protein patterns (Figure 1A and B), particularly for the capture antibody as visually estimated (Figure 1D). Differences in the staining intensity between the antiserum pool and capture antibody might be due to different absolute antibody concentrations in the purified antibody solution and the unpurified antiserum. In general, we were able to generate and isolate an appropriate set of antibodies that sufficiently recognize a P. patens HCP antigen mix.
Development and Evaluation of HCP Sandwich ELISA
For development of a sandwich ELISA, we optimized several parameters: concentration of the capture antibody, concentration of the detector antibody, and the incubation times with both antigen and detector antibodies. A suitable HCP master standard was prepared from the HCP antigen mix material. We set the preliminary working range of the assay to 0.1–5.0 ng/mL and obtained an acceptable intraassay precision with a coefficient of variance (CV) <4%. Those values came from optimized assay conditions, and we verified them in our validation study with samples originating from the actual moss culture as described below.
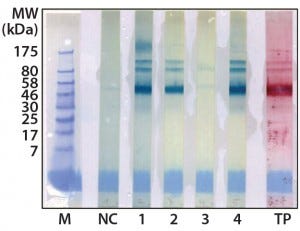
Figure 2: Western blot cross-reactivity after antibody immune adsorption against alpha galactosidase, 500 ng (αGal) protein per strip; MW of moss-αGal = 46 kDa
Optimization, Implementation, and Validation of the HCP Assay in GMP Compliant Production of Moss-Made Alpha-Galactosidase: We analyzed a set of samples from the culture and purification of moss αGal in a feasibility test with the developed HCP ELISA (16). We observed minor cross-reactivity between a small part of the HCP-specific antibodies and the recombinantly expressed αGal and confirmed this with a 1D Western blot (Figure 2). To exclude unspecific binding phenomena from our Western blot, we additionally carried out ELISA inhibition tests that confirmed the presumed cross-reactivity under near-native conditions in contrast to the Western blot method (data not shown). In such inhibition tests, samples are preincubated with potentially cross-reacting antibodies in excess over residual HCP but not in excess over the drug product to inhibit fully the HCP-derived signals. If any remaining ELISA reactivity is then observed in samples compared with a suitable buffer control, then that indicates product cross-reactivity with capture and detector antibodies used in the assay.
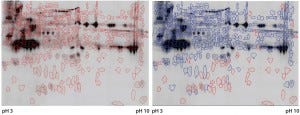
Figure 3: Cy5 and Cy3 scan of 2D fluorescence Western blot with electronic spot detection: (left) 2D fluorescence Western moss-HCP1-Cy5 image (580 detected protein spots marked red), 50 µg protein per gel; (right) moss-HCP1-Cy5 protein pattern compared with antimoss-HCP-IgG-IA-Gal immunodetection pattern detected with antirabbit-IgG-Cy3 conjugate (527 detected spots framed blue, undetected spots remain red-framed), middleintensity exportation of fluorescence scan (PMT scanning settings Cy5 525 V and Cy3 425 V).
Although such cross-reactivity between HCP-specific antibodies and drug substance is rare, it might occur in some HCP immunization trials. However, cross-reacting antibodies can be depleted by immune adsorption of capture antibodies against the drug substance. So part of the HCP-specific capture antibodies were immune-adsorbed by passage through an affinity matrix loaded with purified moss-derived αGal. The newly obtained pool of anti-HCP antibodies (antimoss-HCP-IgG-IA-Gal) subsequently tested negative for cross-reactivity with αGal by Western blotting (Figure 2) and ELISA, as described above. Additionally, we again evaluated coverage of P. patens HCP mix with our new antimoss-HCP-IgG-IA-Gal pool using 2D difference gel electrophoresis (DIGE) fluorescence Western blotting. We compared the 2D protein pattern of the Cy5-labeled HCP antigen with the HCP-specific Western blot pattern, in which the antimoss-HCP-IgG-IAGal was used together with secondary antirabbit-IgG-Cy3 conjugate. Our determination of HCP coverage by image analysis (using ImageMaster 2D Platinum version 7.0 and ImageQuantTL software from GE Healthcare) amounted to 90.8% (Figure 3A and B).
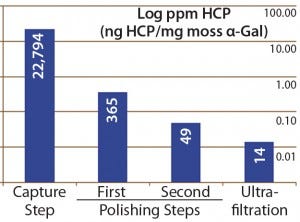
Figure 4: Host-cell protein amounts (ng HCP per mg moss-αGal) at different steps in downstream processing of the moss αGal from 100-L GMP-compliant production culture
Next we implemented our optimized assay as an in-process control in downstream purification of the moss αGal. Figure 4 illustrates the gradual depletion of HCP levels along each purification step, with a 14 ppm in the final drug substance. That value complies well with HCP levels of <100 ng/mg accepted by regulators for drug substances (1).
At this stage, our assay has been partially validated in terms of specificity, linearity, limits of detection and quantitation (LoD, LoQ), range, repeatability, and accuracy. Table 1 summarizes our validation results.
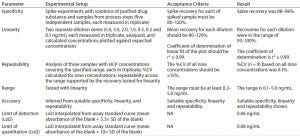
Table 1: Summary of preliminary assay validation; determination of LoD and LoQ through spike experiments is planned, along with full validation of the assay, before upcoming production of material for phase 2 clinical trials.
Characterization of the HCP Antigen Mix
We separated the concentrated HCP antigen mix by 2D-PAGE followed by Coomassie staining to deliver a widespread protein pattern over the whole molecular-weight range. We aimed to further characterize the host-cell proteome of P. patens (FT3/XT-ko strain) generated under Greenovation’s standard culture conditions. Therefore, we chose 51 of the most prominent protein spots (Figure 5) and identified them by analyzing the tryptic peptides with nanoLC–MS-MS. Subsequently, we subjected the obtained spectra to searches in an online P. patens – specific database (www.cosmoss.org) using the MASCOT search algorithm (17).
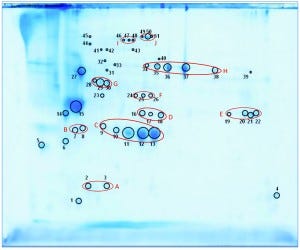
Figure 5: 2D SDS-PAGE total protein Coomassie stain of P. patens HCP antigen mix with 51 protein spots, which were identified using liquid chromatography with tandem mass spectrometry (LC– MS-MS) analysis; 600 µg protein per gel
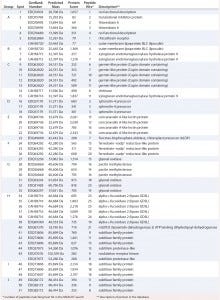
Table 2: Results of MASCOT searches using MS-MS spectra against P. patens–specific database version 1.6 (www.cosmoss.org)
Table 2 summarizes the best protein hits for each spot. Clearly visible from the 2D gel protein pattern, 33 of 51 protein spots cluster into 10 groups (Table 2, A–J). Those proteins with different isoelectric points but similar molecular weights may represent isoforms of the same protein. Identification results support that observation, with the highest scores obtained for protein spots belonging to the same group in almost all cases (groups B–J) and assigned to the same protein. Identification of the HCP mix revealed the following groups:
enzymes with proven function in modification of the P. patens cell wall — xyloglucan endotransglucosylase hydrolase (group B) and pectin methylesterase (18, 19) (group G)
proteins implicated in resistance to biotic and abiotic stress — germinlike and/or cupin-domain–containing proteins (20–23) (group C); spherulin-4 domain–containing proteins (24) (group D); concanavalin-A–like lectin protein (25) (group E); chitinase (spot 14) (18); GDSL-like lipase (26–28) (group H); glyoxal oxidases (29) (spots 27 and 31–33); lipocalin (30, 31) (spot 6); and serine proteases from subtilase family (groups I and J)(32, 33)
metabolism related proteins — ferredoxin–nadp+ reductase-like protein (19) (group F) and fructose-bisphosphate aldolase (spot 23).
An HCP Assay for Plant-Made Pharmaceuticals
We demonstrated successful development of a novel HCP assay for biopharmaceuticals derived from the P. patens expression host. Further fine tuning of this assay will be necessary before its use in release analytics of DP for clinical trial phase 2. That requires full validation, examination of the HCP population in pre- and postcapture process streams, potential readjustment of the acceptable HCP levels in DP (based on the results from phase 1 clinical trial), and so on.
Through depletion of cross-reactivity between generated capture antibodies and the drug substance (αGal), we have also shown that optimization of this newly established “multiproduct” HCP assay to a product-specific assay is feasible. With that, we have accomplished another important milestone for establishment of Greenovation’s technology as a next-generation biopharmaceutical production system.
Acknowledgments
We thank Dr. Klaus Wölfle (Biomeva GmbH) for help in planning and performing the validation study; Protagen Protein Services GmbH for help in analysis of the HCP antigen mix; and Dr. Claudia Geserick (Biogenes GmbH) for HCP-coverage evaluation analysis. We also thank all Greenovation Biotech GmbH staff for excellent technical assistance.
References
1 Eaton LC. Host Cell Contaminant Protein Assay Development for Recombinant Biopharmaceuticals. J. Chromatogr. A 705(1) 1995: 105–114.
2 Stamm O, et al. Analytical Methods: Host Cell Proteins. Europ. Biopharmaceut. Rev. 12, Autumn 2012: 74–80.
3 Tscheliessnig AL, et al. Host Cell Protein Analysis in Therapeutic Protein Bioprocessing: Methods and Applications. Biotechnol. J. 8(6) 2013: 655–670.
4 Wolter T, Richter A. Assays for Controlling Host-Cell Impurities in Biopharmaceuticals. BioProcess Int. 3(2) 2005: 40–46.
5 Schwertner D, Kirchner M. Are Generic HCP Assays Outdated? BioProcess Int. 8(5) 2010: 56–61.
6 Wang X, et al. Improved HCP Quantitation By Minimizing Antibody Cross-Reactivity to Target Proteins. BioProcess Int. 8(1) 2010: 18–23.
7 Shaaltiel Y, et al. Large Scale Disposable Bioreactor. WO 2008/135991 A2, 13 November 2008; www.google.com/patents/WO2008135991A2.
8 Murray EW, et al. A Host Cell Protein Assay for Biologics Expressed in Plants. BioProcess Int. 10(9) 2012: 44–51.
9 Decker EL, Parsons J, Reski R. Glyco-Engineering for Biopharmaceutical Production in Moss Bioreactors. Front. Plant Sci. 5, 2014: 346.
10 Reski R, Parsons J, Decker EL. Moss-Made Pharmaceuticals: From Bench to Bedside. Plant Biotechnol. J. 13(8) 2015: 1191– 1198.
11 Koprivova A, et al. Targeted Knockouts of Physcomitrella Lacking Plant-Specific Immunogenic N-Glycans. Plant Biotechnol. J. 2(6) 2004: 517–523.
12 Reski R, et al. Transformed Bryophyte Cell Having Disrupted Endogenous Alpha 1,3-Fucosyl and Beta 1,2-Xylosyl Transferase Encoding Nucleotide Sequences for the Production of Heterologous Glycosylated Proteins. US PTO 7781197 B2. 24 August 2010.
13 Niederkrüger H, Dabrowska-Schlepp P, Schaaf A. Suspension Culture of Plant Cells Under Phototrophic Conditions. Industrial Scale Suspension Cultures of Living Cells. Meyer H-P, Schmidhalter D, Eds. Wiley-Blackwell VCH: Berlin, Germany, 2014.
14 Große T, Niederkrüger H, Schaaf A. Filtration of Cell Culture Supernatants. WO 2014013045 A1, 22 January 2014; www.google.com/patents/WO2014013045.
15 Thalhamer J, Freund J. Cascade Immunization: A Method of Obtaining Polyspecific Antisera Against Crude Fractions of Antigens. J. Immunol. Meth. 66(2) 1984: 245–251.
16 Shen J-S, et al. Mannose ReceptorMediated Delivery of Moss-Made α-Galactosidase A Efficiently Corrects Enzyme Deficiency in Fabry Mice. J. Inherit. Metab. Dis. 27 August 2015: 1–11; doi:10.1007/s10545-015-9886-9.
17 Zimmer AD, et al. Reannotation and Extended Community Resources for the Genome of the Non-Seed Plant Physcomitrella patens Provide Insights into the Evolution of Plant Gene Structures and Functions. BMC Genomics 14, 2013: 498.
18 Tintelnot S. Der Einfluss von Abscisinsäure auf die Pflanzliche Zellwand: Untersuchung Extrazellulärer Proteine beim Laubmoos Physcomitrella patens (PhD thesis). Universität Freiburg: Freiburg, Germany, 2006.
19 Lehtonen MT, et al. Protein Secretome of Moss Plants (Physcomitrella patens) with Emphasis on Changes Induced By a Fungal Elicitor. J. Proteome Res. 13(2) 2014: 447–459.
20 Lane BG, et al. Homologies Between Members of the Germin Gene Family in Hexaploid Wheat and Similarities Between These Wheat Germins and Certain Physarum spherulins. J. Biol. Chem. 266(16) 1991: 10461– 10469.
21 Lane BG. Oxalate, Germins, and Higher-Plant Pathogens. IUBMB Life 53(2) 2002: 67–75.
22 Dunwell JM, et al. Germin and Germin-Like Proteins: Evolution, Structure, and Function. Crit. Rev. Plant Sci. 27(5) 2008: 342–375.
23 Zhang Z, Collinge DB, ThordalChristensen H. Germin-Like Oxalate Oxidase, a H2O2-Producing Enzyme, Accumulates in Barley Attacked by the Powdery Mildew Fungus. Plant J. 8(1) 1995: 139–145.
24 Cuming AC, et al. Microarray Analysis of Transcriptional Responses to Abscisic Acid and Osmotic, Salt, and Drought Stress in the Moss, Physcomitrella patens. New Phytol. 176(2) 2007: 275–287.
25 De Hoff PL, Brill LM, Hirsch AM. Plant Lectins: The Ties That Bind in Root Symbiosis and Plant Defense. Mol. Genet. Genomics 282(1) 2009: 1–15.
26 Oh IS, et al. Secretome Analysis Reveals an Arabidopsis Lipase Involved in Defense Against Alternaria brassicicola. Plant Cell Online 17(10) 2005: 2832–2847.
27 Naranjo MA, et al. Overexpression of Arabidopsis thaliana LTL1, a Salt-Induced Gene Encoding a GDSL-Motif Lipase, Increases Salt Tolerance in Yeast and Transgenic Plants. Plant Cell Environ. 29(10) 2006: 1890–1900.
28 Hong JK, et al. Function of a Novel GDSL-Type Pepper Lipase Gene, CaGLIP1, in Disease Susceptibility and Abiotic Stress Tolerance. Planta 227(3) 2008: 539–558.
29 Guan X, et al. Transient Expression of Glyoxal Oxidase from the Chinese Wild Grape Vitis pseudoreticulata Can Suppress Powdery Mildew in a Susceptible Genotype. Protoplasma 248(2) 2011: 415–423.
30 Charron J-BF, et al. Identification, Expression, and Evolutionary Analyses of Plant Lipocalins. Plant Physiol. 139(4) 2005: 2017– 2028.
31 Wang X, et al. Proteomic Analysis of the Response to High-Salinity Stress in Physcomitrella patens. Planta 228(1) 2008: 167– 177.
32 Schaller A. A Cut Above the Rest: The Regulatory Function of Plant Proteases. Planta 220(2) 2004: 183–197.
33 Wolf S, Rausch T, Greiner S. The N-terminal Pro Region Mediates Retention of Unprocessed Type-I PME in the Golgi Apparatus. Plant J. Cell Mol. Biol. 58(3) 2009: 361–375.
Corresponding author Paulina Dabrowska-Schlepp is analytics team leader, Mathias Knappenberger was at the time this project started downstream processing team leader, Holger Niederkrüger is head of production, and Andreas Schaaf is chief scientific officer at Greenovation Biotech GmbH, Hans-Bunte Straße 19, D-79108 Freiburg, Germany; [email protected]. Stefan Sommerschuh is head of assay development, and Nicole Gliese is project manager at BioGenes GmbH, Köpenicker Straße 325, D-12555, Berlin, Germany.


