Voices of Biotech
Podcast: MilliporeSigma says education vital to creating unbreakable chain for sustainability
MilliporeSigma discusses the importance of people, education, and the benefits of embracing discomfort to bolster sustainability efforts.
Analyzing charge variants of therapeutic proteins is critical for characterizing and monitoring quality attributes of antibodies. Charge variants include deamidation, formation of N-terminal pyroglutamate, aggregation, isomerization, sialylated glycans, antibody fragmentation, and glycation at the lysine residues. In some cases, such changes affect binding, biological activity, patient safety, and shelf life. The biopharmaceutical industry relies on tools such as ion-exchange chromatography (IEC), isoelectric-focusing gel electrophoresis (IEF), and capillary equivalents such as capillary isoelectric focusing (CIEF) and imaged CIEF (iCIEF) to characterize charge variants. iCIEF has contributed significantly to biopharmaceutical development with its high resolution, minimal development time, reduced sample volume, and fast run times 1,2,3,. Those benefits allow for applications across entire pharmaceutical processes, from cell culture development and optimization to commercial quality control (QC) release and stability activities. Here, we describe its application in QC and characterization (product and process). We focus on unique advantages for analyzing drug–antibody conjugates, and provide an in-depth example of iCIEF’s power for evaluating process changes. Finally, we detail a novel application for iCIEF profile characterization by mass spectrometry.
PRODUCT FOCUS:MABS AND CONJUGATES
PROCESS FOCUS: DOWNSTREAM PROCESSING
WHO SHOULD READ: QA/QC, ANALYTICAL, AND PROCESS DEVELOPMENT
KEYWORDS:PROCESS CHANGES, CHARACTERIZATION, PIVALUES, STABILITY, LOT RELEASE
LEVEL:INTERMEDIATE
Introduction to iCIE Technology
IEC has been the primary tool for charge-based biopharmaceutical structural and degradation pathway characterization, lot release, and stability activities. Although IEC remains a useful technique for analyzing charge-based heterogeneities, concerns about variability among column lots and lack of resolution and robustness for routine analysis of selected antibodies accentuate the need for alternative methods. iCIEF continues to gain use and acceptance for characterization of charge heterogeneity and experimental isoelectric point (pI) determination 2,.
IEC separates antibody populations primarily on the basis of surface charge of solvent-exposed residues — often with a significant undesired hydrophobic interaction. By contrast, iCIEF is a highly resolving technique that separates species primarily on the basis of a molecule’s pI intrinsic net charge. It takes into account surface-exposed and internal amino acids, with no loss of resolution due to hydrophobic interactions.
iCIEF separation is conducted by focusing isoforms in an ampholytic pH gradient through an applied electric field. Following the focusing step is a detection step, which in conventional CIEF would entail a chemical or pressure mobilization across a fixed UV detector 4,. Drawbacks of the mobilization step are that it not only extends run times, but it adds an optimization parameter and may affect the initial high resolution obtained during focusing. The distinctive advantage iCIEF of using over conventional CIEF is that it lacks a mobilization step. Detection is achieved through continuously scanning the whole capillary. That allows for a close UV monitoring of the focusing step, followed by an instant final charge variant profile without the need for mobilization 5,. Because a mobilization step is eliminated, the charge-variant profile can be recorded at its highest possible resolution, within an efficient run time of 15–20 min.

QC Applications
Measuring charge-based variant distribution is a key aspect of monitoring lot-to-lot consistency and stability. Charge profiles are sensitive to process changes and common degradation pathways, so regulatory agencies usually require that a charge-based assay be included for product release. In QC, iCIEF is an attractive alternative to IEC because it offers several advantages over traditional chromatography methods. With similar or better performance in resolution and precision, iCIEF offers a faster and often more robust separation. A highly reliable method suitable for an intended purpose is especially desirable for QC, in which troubleshooting can be quite cumbersome amid strict documentation requirements.
Several recent articles have discussed iCIEF applications in QC 2,3,. Using IEC for a representative recombinant monoclonal antibody (rMAb), Sosic et al. showed correlation of iCIEF-detected protein isoforms with charge heterogeneity 2,. They reported qualification details for using iCIEF in a QC environment as part of their quantitative analysis of rMAb protein charge heterogeneity and monitoring of protein stability. The researchers determined that the intermediate pI precision of the main peak was ≤0.2% relative standard deviation (RSD), and the relative percentage peak areas for acidic, main, and basic species were reproducible within 1.9, 0.9, and 16.6% RSD, respectively. They concluded that the iCIEF assay provides a suitable alternative to IEC in QC and allows for fast method development, short analysis time, and high sample throughput. Determining pI value can in most cases provide sufficient specificity to serve as an identity assay on a control system, thereby allowing the iCIEF method to serve a dual purpose: as product identification (ID) and as a purity assay for QC release.
Analysis of Antibody–Drug Conjugates
Antibody–drug conjugates (ADCs) are a new class of therapeutic proteins composed of a targeted MAb covalently linked — by means of an enzyme-cleavable linker — to a cytotoxic small molecule such as monomethyl auristatin E (MMAE) 6,. As a result of this targeted delivery, ADCs selectively bind and kill tumor cells that overexpress a target antigen while limiting drug toxicity to normal healthy tissues. Although IEC is appropriate to characterize charge variants of antibodies, it is not suitable for analysis or fractionation of ADCs. The presence of antimitotic agents in ADCs increases their hydrophobicity relative to unconjugated antibodies. That causes the ADCs’ charge variants to separate poorly by chromatographic methods (likely by interactions with stationary phase).
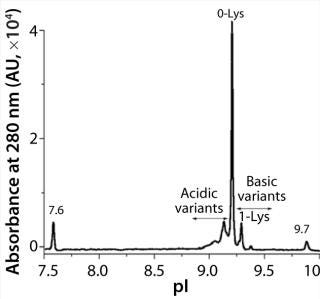
iCIEF is a more suitable technique to assess charge heterogeneities of ADCs. The separation mechanism of this electrophoretic technique is based primarily on pI differences of protein charge variants. Figure 1 shows the potential of iCIEF to determine overall charge distribution of ADCs. The electropherogram shows various isoforms of an ADC between the pI markers 7.6 and 9.7. The pI values of the ADC peaks (x axis) were calculated using two-point calibration with the pI markers. The main peak or 0-Lys form of the ADC has an apparent pI of 9.2. The more basic species with one and two C-terminal Lys residues at the heavy chain are baseline resolved from each other and the main peak. The acidic variants were also observed before
the 0-Lys peak.

Figure 1: ()
Profile Characterization for Process Development Support
Characterization and peak identification of iCIEF profiles are important for understanding distribution of product charge isoforms and how they affect biological activity. iCIEF profile characterization also provides a better understanding of degradation pathways.
To conduct iCIEF characterization, you must isolate the native protein separated by pI and accurately characterize it using orthogonal techniques such as in-line reverse-phase liquid chromatography with mass spectrometry (MS). However, as for many CE-based applications, routine characterization using this approach has limitations associated with sample fractionation directly from the capillary or direct in-line coupling to MS detection. Although IEC fractionation may be helpful in some instances, preparative IEC often yields low fraction purity because of differences associated with mixed-mode separations. This makes it difficult to characterize individual peaks in an iCIEF profile.
To overcome challenges of using off-line iCIEF characterization, some analytical laboratories are actively pursuing alternative preparative IEF methods using tools introduced nearly 20 years ago. Alternatives include the Bio-Rad Rotofor system 7,8,9,10, and the Agilent 3100 OFFGEL fractionator 11,12,13, for in-solution IEF of proteins. Each platform offers unique advantages. The Rotofor method uses liquid-phase (or free solution) IEF to separate large quantities of protein across a single 20-compartment chamber within a few hours. The OFFGEL fractionator offers multiplexed separation of protein by integrating liquid-phase recovery and IPG gel strips across two eight-lane trays (12 or 24 wells) simultaneously within 24–48 h. After the focusing step, analysts can recover highly purified and enriched native isoforms from the ampholytic solution through simple buffer exchange or protein A purification. Until emerging technologies such as free-flow electrophoresis 14,15,16, attain stable commercial ground, the Rotofor and OFFGEL methods will continue to offer easy-to-use, solution-based separation for native protein fractionation according to pI values.
Proteomics studies thus far have implemented preparative IEF platforms for routine separation of whole-cell protein extracts and complex peptide mixtures 17,18,19,20,. Similarly, the biopharmaceutical industry is finding great value in those devices for product development and characterization of rMAb products 21,. For example, scientists at Genentech developed preparative IEF using the OFFGEL[[newpage = 52]] platform to characterize iCIEF profiles for several therapeutic products. Zhang et al. published their identification of light-and heavy-chain isomerization of aspartate residues as major contributors to increased basic variants in the iCIEF profile of a thermally stressed Fab product 1,.
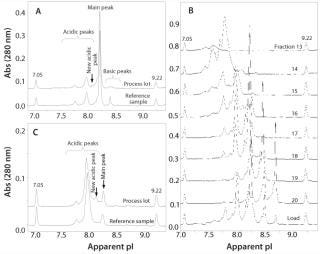
Case Study: In an unpublished study, development of a preparative IEF method was crucial in understanding and explaining the observation of a new peak observed in the iCIEF profile. The study included characterization of several lots of a standard rMAb product in clinical development. During analysis, a new acidic peak (∼3% of the total peak area) was detected using iCIEF in a process lot treated with a preharvest addition of cystine. Results were compared with a reference control manufactured without cystine (Figure 2A). Because separation by IEC could not be optimized to achieve adequate resolution of the new acidic peak, the OFFGEL system was used to isolate enriched charge isoform variants using optimized conditions determined from vast experience with capillary-based IEF separations. By integrating a mixture of narrow-range ampholytes with an appropriate narrow-range IPG gel strip, researchers fractionated enriched charged isoforms with purity ranges of 60–80% (Figure 2B).

Figure 2: ()
Further optimization of the OFFGEL separation resulted in isolation of a fraction containing four times the level of new acidic variant while depleting nearly all main and basic peaks (Figure 2C). Researchers subsequently analyzed that fraction using electrospray ionization–mass spectrometry (ESI–MS) and microchip sieving electrophoresis (MCE-SDS) 22,23,. Mass spectra showed all expected masses of the full-length, intact rMAb protein with the exception of two unknown species not present in the control sample (with masses of ∼23 and 123 kDa). Relative to the expected rMAb fragments, those masses were consistent with a cysteinylated heavy chain-heavy chain-light chain species (cys-HHL) and free cysteinylated light chain (cys-LC). Results from MCE–SDS analysis also confirmed elevated levels of fragment peaks consistent with free LC and HHL species (data not shown). Increased levels of cys-HHL in the OFFGEL fraction correlate with both the preharvest addition of cystine and the appearance of a new acidic peak in the iCIEF profile. Through use of the OFFGEL system and careful selection of ampholyte conditions, researchers identified and characterized the new acidic peak as noncovalent association between cys-LC and HHL forms. This example demonstrates the importance and power of off-line fractionation systems and their application during process development and manufacturing of therapeutic antibodies for charge isoform identification and iCIEF profile characterization.
About the Author
Author Details
Corresponding author Chantal Felten, PhD, is owner of Alpine Analytical Academy, Whistler, BC, Canada; 1-604-698-7885; [email protected]Oscar Salas-Solano, PhD, is the director of analytical biochemistry at Seattle Genetics, Inc., Bothell, WA; 1-425.527.2430; [email protected]David A. Michels, PhD, is a scientist in the department of protein analytical chemistry at Genentech, AMember of the Roche Group, South San Francisco, CA; 1-650-467-4944; [email protected]
1.) Zhang, J, H Yip, and V. Katta. 20
11. Identification of Isomerization and Racemization of Aspartate in the Asp–Asp Motifs of a Therapeutic Protein. Anal Biochem. 410:234-243.
2.) Sosic, Z. 2008. Application of Imaging Capillary IEF for Characterization and Quantitative Analysis of Recombinant Protein Charge Heterogeneity. Electrophoresis 29:4368-4376.
3.) Janini, G. 2002. Element of a Validation Method for MU-B3 Monoclonal Antibody Using an Imaging Capillary Isoelectric Focusing System. Electrophoresis 23:1605-1611.
4.) Mack, S. 2009. A Systematic Study in CIEF: Defining and Optimizing Experimental Parameters Critical to Method Reproducibility and Robustness. Electrophoresis 30:4049-4058.
5.) Wu, X-Z, J Wu, and J. Pawliszyn. 2001. Whole-Column-Imaging Detection for Capillary Isoelectric Focusing and Capillary Electrophoresis. LCGC 19:526-545.
6.) Sun, M. 2005. Reduction-Alkylation Strategies for the Modification of Specific Monoclonal Antibody Disulfides. Bioconjugate Chem. 16:1282-1290.
7.) Petrash, JM. 1991. Resolving Isoforms of Aldose Reductase by Preparative Isoelectric Focusing in the Rotofor. Electrophoresis 12:84-90.
8.) Goldfarb, MF. 1993. Use of Rotofor in Two-Dimensional Electrophoretic Analysis: Identification of a 100 kDa Monoclonal IgG Heavy Chain in Myeloma Serum. Electrophoresis 14:1379-1381.
9.) Egen, NB. 1988. Isolation of Monoclonal Antibodies to Phencyclidine from Ascites Fluid By Preparative Isoelectric Focusing in the Rotofor. Anal. Biochem. 172:488-494.
10.) Jiménez, J. 1990. Electric Properties of Photoaffinity-Labelled Pancreatic A-Subtype Cholecystokinin. Chromatogr. 511:333-339.
11.) Warren, C. 2010. Subproteomic Fractionation, iTRAQ, and OFFGEL-LC–MS/MS Approaches to Cardiac Proteomics. Proteomics 73:1551-1561.
12.) Zhang, Y. 2010. Comprehensive Analysis of Low-Abundance Proteins in Human Urinary Exosomes Using Peptide Ligand Library Technology, Peptide OFFGEL Fractionation and NanoHPLC-chip-MS/MS. Electrophoresis 31:3797-3807.
13.) Mena, ML. 2011. OFFGEL Isoelectric Focusing and Polyacrylamide Gel Electrophoresis Separation of Platinum-Binding Proteins. J. Chromatogr. A 1218:1281-1290.
14.) Krivankova, L, and P. Bocek. 1998. Continuous Free-Flow Electrophoresis. Electrophoresis 19:1064-1074.
15.) Poggel, M, and T. Melin. 2001. Free-Flow Zone Electrophoresis: A Novel Approach and Scale-Up for Preparative Protein Separation. Electrophoresis 22:1008-1015.
16.) Timm, V. 2010. Identification and Characterization of Oxidation and Deamidation Sites in Monoclonal Rat/Mouse Hybrid Antibodies. J. Chromatogr. B 878:777-784.
17.) Madoz-Gúrpide, J. 2001. Protein-Based Microarrays: A Tool for Probing the Proteome of Cancer Cells and Tissues. Proteomics 1:1279-1287.
18.) Brobey, RKB, and L. Soong. 2007. Establishing a Liquid-Phase IEF in Combination with 2-DE for the Analysis of Leishmania Proteins. Proteomics 7:116-120.
19.) Mulvenna, J. 2009. Proteomics Analysis of the Excretory/Secretory Component of the Blood-Feeding Stage of the Hookworm, Ancylostoma Caninum. Mol. Cell Proteomics 8:109-121.
20.) Krishnan, S. 2011. OFFgel-Based Multidimensional LC–MS/MS Approach to the Cataloguing of the Human Platelet Proteome for an Interactomic Profile. Electrophoresis 32:686-695.
21.) Meert, CD. 2010. Characterization of Antibody Charge Heterogeneity Resolved By Preparative Immobilized pH Gradients. Anal. Chem. 82:3510-3518.
22.) Bousse, L. 2001. Protein Sizing on a Microchip. Anal. Chem. 73:1207-1212.
23.) Chen, X. 2088. Microchip Assays for Screening Monoclonal Antibody Product Quality. Electrophoresis. 29:4993-5002.
You May Also Like