Voices of Biotech
Podcast: MilliporeSigma says education vital to creating unbreakable chain for sustainability
MilliporeSigma discusses the importance of people, education, and the benefits of embracing discomfort to bolster sustainability efforts.
BRISTOL-MYERS SQUIBB (WWW.BMS.COM)
Osmolality is a critical attribute for injectable formulations. It is desirable to have products match physiological osmotic conditions. Furthermore, osmolality provides confirmation of soluble content in solution. Preventing injection of hypo- or hyperosmotic solutions is a key element of parenteral formulation development. Additionally, some investigators have explored correlations between injection pain and formulation osmolality, although no significant correlation has yet been observed (1–4).
Osmolality is a valuable in-process test also because it provides a reliable and repeatable value that reflects overall solute content of a formulation. It is particularly useful to detect deviations in compounding when excipients such as stabilizing and tonicity modifying sugars, viscosity modifiers, and buffers are used at relatively high concentrations. Similarly, when the Donnan effect is present during ultrafiltration/diafiltration processes, osmolality is a good indicator of undesired coconcentration of some excipients along with proteins (5, 6).
Based on the above, osmolality is one of the tests included in specifications of parenteral drug products. For accuracy and precision in product-release data, it is crucial to ensure minimized assay variability among different methods, analysts, and sites. Our recent experiences in technology transfer have shown that monitoring and control of assay variability can prove to be particularly challenging when services of third-party manufacturing and research organizations are involved. Based on an investigation on disparities observed during said technology transfers, we feel the need to share our experiences with the broader biopharmaceutical development community.
Osmometers work on two leading principles depending on which soluble content is to be quantified: freezing-point depression and vapor-pressure depression. In both well-established methods, the amount of soluble content is deduced from its effect on colligative properties of a solution. In this study, we investigated the ability of these two working principles to make accurate deductions about formulations that contain high concentrations of soluble polymers (including but not limited to proteins).
Materials and Methods
To compare freezing-point based (FPB) and vapor-pressure based (VPB) osmometers, we used the following variables: IgG1-A, IgG1-B, and PEGylated protein from Bristol-Myers Squibb; and polyethylene glycol (PEG-10K) from Alfa Aesar. IgGs and PEGylated protein concentrations were within the range of 0–25% (w/v) in formulations that contained buffering agents, sugars, amino acids, metal chelators, and surfactants. Proteins and inactive ingredients used in formulations 1–4 were part of BMS proprietary products. For PEGylated protein (with PEG covalently attached) comparator, we prepared a solution containing 75 mg/mL bovine serum albumin (BSA) from SeraCare Life Sciences in deionized water with 0–22% (w/v) concentrations of PEG-10K — listed as formulation 5 herein. For each set of data collected for a given formulation, only the concentrations of proteins and polymers varied in each data group, whereas we kept constant the concentrations of inactive ingredients.

Equation 1: ξ is osmolality (mOsm/kg solution), mi is molality (moles/kg solution) of ith solute, vi is the number of particles formed by the dissociation of ith solute, and Фmi is the molal osmotic coefficient (a measure of ideality in dissociation behavior, which is complete dissociation with no water binding) of the ith solute.
We followed standard operating and cleaning protocols as described in the operating manuals for both instruments: a Wescor Vapro 5520 (VPB) system from Wescor Inc. and a Model 3320 osmometer (FPB) from Advanced Instruments Inc. Neither instrument displayed errors or alerts during osmolality measurements for evaluated samples.
We calculated theoretical osmolality contributions of dissolved polymers (including proteins) using Equation 1.
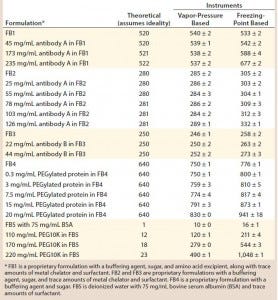
Table 1: Tabulated results on comparison of theoretical and experimental osmolality values using two osmometers with different working principles
In accordance with the method described in the instrument manuals, we measured water activity in samples of formulations 2 and 5 at 20 ± 2 °C (Table 1) using an Aqualab 4TEV instrument from Decagon Devices.
Results
Here we compare osmolality measurements performed using VPB and FPB instruments for the same formulations containing different protein and polymer concentrations. In addition, for a reference that is independent of instrument bias, we include theoretically calculated osmolality values for comparison. Table 1 lists osmolality results obtained for formulation buffers and varying concentrations of proteins and polymers in those buffers.
When we analyzed formulation buffer alone — or formulations with low protein concentration (e.g., <50 mg/mL) — the different osmometers provided comparable values within expected instrument-to-instrument variability. However, as Figure 1 shows, osmolality measurements performed on high concentration antibody samples (>150 mg/mL) showed a clear difference according to instrument type (VPB or FPB operating principles).
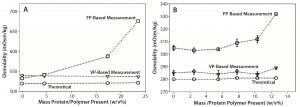
Figure 1A, 1B: Comparative data showing osmolality as function of protein/polymer solute concentration with overlaid theoretically calculated values (open circles), values measured by an osmometer based on vapor pressure (open triangles), values measured by an osmometer based on freezing point (open squares); (A) IgG1A in formulation 1 and (B) IgG1A in formulation 2
In Figure 1, panels A and B show osmolality data for an IgG1 monoclonal antibody (MAb) in two different formulations. Panel C demonstrates similar data for a second IgG1 MAb. In all three cases, VPB measurements agreed well with theoretically calculated osmolalities of those formulations. We observed an unexpected increase in osmolality with increasing protein concentration when measured with the FPB instrument. Panel D shows osmolality data for a PEGylated protein in a formulation that has an atypically high concentration of sugar (>0.5 M).
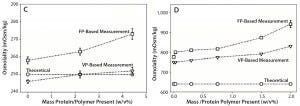
Figure 1C, 1D: Comparative data showing osmolality as function of protein/polymer solute concentration with overlaid theoretically calculated values (open circles), values measured by an osmometer based on vapor pressure (open triangles), values measured by an osmometer based on freezing point (open squares); (C) IgG1B in formulation 3 and (D) PEGylated protein in formulation 4
In that case, both VPB and FPB instruments showed notable deviation from theoretical calculations even without protein in the formulation buffer, suggesting that osmotic nonideality is related to low water activity as result of that high sugar concentration. At higher protein concentrations, both instruments showed further deviation from theoretically calculated osmolalities, and it was more notable in data from the FPB instrument.
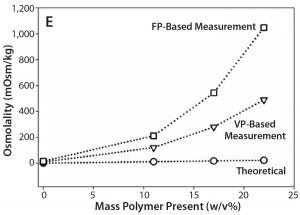
Figure 1E: Comparative data showing osmolality as function of protein/ polymer solute concentration with overlaid theoretically calculated values (open circles), values measured by an osmometer based on vapor pressure (open triangles), values measured by an osmometer based on freezing point (open squares); (E) PEG-10K in formulation 5
To test whether synthetic polymers also cause instrument bias in osmolality measurements, we collected data on a formulation containing 75 mg/mL BSA and different concentrations of PEG-10K (Figure 1E), which is a highly water soluble polymer with strong hydrogen-bonding ability. This experiment also provided measured osmolalities that were significantly higher than theoretical values with increasing PEG-10K concentrations — again more prominently from the FPB instrument.
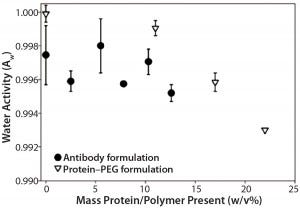
Figure 2: Formulations with increasing PEG-10K concentrations (in formulation 5) showed decreasing water activity, whereas increasing antibody concentrations (in formulation 2) did not show the same trend.
In an effort to understand whether decreased water activity was the only contributing factor causing deviations from theoretical values, we measured water activities of formulations 2 (IgG1) and 5 (PEG-10K) as a function of protein and polymer concentrations (Figure 2). With formulation 5, we observed a clear drop in water activity with higher PEG-10K concentration in solution, whereas formulation 2 did not display the same trend. That result suggests the presence of an additional contributing factor to the observed deviations in apparent osmolality with formulation 2: low protein concentration with ingredients that can decrease water activity (e.g., sugars and polymers with high water solubility).
Our results collectively suggest a dual mechanism in which both decreased water activity and antifreeze-like behavior of proteins and polymers in solution contribute to deviations of apparent osmolality from actual solution osmolality calculated based on dissolved solutes. With decreased water activity, that deviation was evident even without the experimental variable (protein or PEG, depending on the formulation tested) and affected both instruments to different degrees. The FPB instrument deviated more than the VPB instrument did.
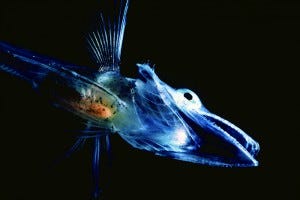
Icefish (Notothenioidei) larva off the coast of Antarctica UWE KILS (HTTPS://COMMONS.WIKIMEDIA.ORG)
Discussion
Water Activity and Osmotic Nonideality: One hypothesis for explaining the apparent increase in osmolality is the effect of nonideality, which is represented by the molal osmotic coefficient (φ) in Equation 1. Decreased water activity would result in nonideality, which mathematically manifests itself as an increase in osmotic coefficient and consequently an increase in overall osmolality.
Indeed, we did observe a measurable decrease in water activity with increasing polymer concentrations in the case of formulation 5, which had ≤22% (w/v) dissolved PEG-10K. Note that in this scenario, both VPB and FPB instruments measured higher osmolality readings than theoretical values assuming ideal behavior, and the FPB instrument showed a larger deviation. A similarly notable increase occurred in both VPB and FPB readings with increasing solute concentration in the case of formulation 4.
Formulation 4 contains protein-conjugated PEG and an atypically high concentration of sugar, both of which would lower water activity, resulting in osmotic nonideality. That further supports the association of water activity with deviations in osmolality measurements compared with theoretical calculations for some formulations. However, typical biologics formulations such as 1–3 do not have protein-bound solutes in quantities that would significantly lower water activity as a function of protein concentration. Figure 2 shows the lack of trending in water activity as a function of protein concentration in solution (formulation 2), with a strong decrease in the case of a PEG solution (formulation 5). So water activity alone fails to sufficiently explain the observed differences between values measured by VPB and FPB instruments. Similarly strong discrepancies between theoretical and experimental values of osmolality with PEG present are discussed in reports by Sandell and Goring (7) and by Elworthy and Florence (8).
Antifreeze Effect: Polyols such as ethylene glycol and propylene glycol are widely used as antifreeze materials because of their ability to mimic and replace hydrogen bonding between water molecules. In doing so, they perturb the ability of water molecules to achieve an ordered state that can crystallize into ice upon nucleation (9). Similar hydrogen bonding ability is observed in glycoproteins from fish that inhabit deep seas in polar regions, where such proteins prevent formation of ice crystals in the bodies of such fish at temperatures well below the freezing point of water (10, 11). Similar proteins also have been found in other organisms such as certain insects and cold-tolerant plants (12, 13). These proteins are especially evolved to provide protection against ice crystals; therefore, they do not have to be present at very high concentrations to be effective. However the involvement of hydrogen bonding in their mechanism of action suggests that any solute capable of strong hydrogen bonding will have varying degrees of antifreeze-like properties.
Many amino acid side chains in proteins can hydrogen bond with water. Additionally, a well-known property of proteins is hydrogen bonding ability of the peptide backbone itself. Sugar chains on glycosylated proteins represent a third potential source of hydrogen bonding moiety. Considering the availability of numerous functional groups that can replace the hydrogen bonding between water molecules, it is easily conceivable that proteins like other hydrogen-bonding solutes would display some antifreeze-like properties. In doing so, they would hinder the packing of water structure into an ordered cage of hydrogen bonds for crystallization. That effect would be in addition to the freezing-point depression in its classical meaning, which would originate from protein’s presence as a solute in the aqueous environment.
Because instruments based on freezing-point depression deduce osmolality solely based on the classical meaning of colligative properties, such an instrument would misinterpret the antifreeze-containing sample as a solution with much higher concentration of solute. That leads to an artificially high osmolality value. However, proteins that display antifreeze-like properties are not expected to have equally strong effects on increasing vapor pressure because their mechanism of action involves hindering lattice-like packing of water molecules more than the strength of their own interaction with water. That is consistent with our observations that VPB instruments provided more reliable alternatives to FPB instruments, particularly for high-concentration protein formulations (e.g., subcutaneous products).
Cryoconcentration Artifacts During FPB Measurements: Protein formulations are known to undergo cryoconcentration, which is freezing-triggered loss (during water crystallization) of content uniformity in bulk formulation. That creates gradients of solute concentrations and potentially phase separation of one or more ingredients in a formulation. Any phenomenon that affects content uniformity also has potential to change accuracy and precision of analytical methods through multiple mechanisms. Thus, FPB instruments have the added disadvantage compared with VPB instruments because of possible artifacts of freezing that can take place during measurements (14). Those can lead to observations of nonrepresentative physicochemical properties caused by a lack of content uniformity as well as nucleation of ice-crystal formation by particles generated during freezing triggered phase separation. Bhatnager et al. have reviewed a more comprehensive list of freezing-triggered phenomena and detailed their effects in protein formulations (15).
Additional Considerations: The possible causes of discrepancies between VPB and FPB osmometer results discussed herein do not constitute an exhaustive list of cautionary notes for these techniques. The simplest techniques with minimal sample preparation hold an unusual risk for oversight of their subtle complexities, partly because no deep expertise is necessary to run such tests. Sweeney and Beuchat have listed the assumptions and mathematical simplifications that are part of osmolality measurements and analysis (16). Inaccuracies can occur when instrumental limitations are poorly understood by analysts.
A Cautionary Tale
Despite published literature referenced herein, suboptimal practices in generation and interpretation of osmolality data are of continued concern in this field. Cautionary reports are scattered across a number of journals that serve diverse audiences, not necessarily targeting pharmaceutical research and development. Based on our observations, some conclusions can be drawn:
VPB osmometers appear to provide a more reliable alternative to FPB osmometers for high-concentration protein formulations and those that contain high concentrations of ingredients that can decrease water activity (e.g., sugars and highly water-soluble polymers). Antifreeze effects are protein/formulation dependent and will manifest at different concentrations for different proteins and formulations. At low concentrations of polymers, proteins, and sugars, both instrument types will provide satisfactory results.
When working with third-party research/manufacturing organizations or performing technology transfer between sites (and setting specifications), it is beneficial for analytical method and process developers to consider the instrument types used for osmolality measurement. Misalignment between theoretical and experimental osmolality results should not be attributed fully to nonideality and/or instrument bias. For example, osmolality is a useful tool to highlight the presence of Donnan effects in ultrafiltration/diafiltration operations. Investigations of discrepancies should include quantification of excipients and comparison of their levels with target concentrations.
Acknowledgments We thank Miron Ludzinski, who provided formulation 5 for testing.
Conflict of Interest We have no personal financial or nonfinancial conflicts of interest in submission and publication of this manuscript.
References
1 Doenicke A, et al. Osmolalities of Propylene Glycol-Containing Drug Formulations for Parenteral Use: Should Propylene Glycol Be Used As a Solvent? Anesth. Analg. 75(3) 1992: 431–435.
2 Klement W, Arndt JO. Pain on Injection of Propofol: Effects of Concentration and Diluent. Br. J. Anaesth. 67(3) 1991: 281–284.
3 Larsen B, et al. Less Pain on Injection By a New Formulation of Propofol? A Comparison with Propofol LCT. Anaesthesist. 50(11) 2001: 842–845; doi:10.1007/s00101-001-0234-0.
4 Sim JY, et al. Pain on Injection with Microemulsion Propofol. Br. J. Clin. Pharmacol. 67(3) 2009: 316–325; doi:10.1111/j.1365-2125.2008.03358.x.
5 Stoner MR, et al. Protein–Solute Interactions Affect the Outcome of Ultrafiltration/Diafiltration Operations. J. Pharm. Sci. 93(9) 2004: 2332–2342.
6 Steele A, Arias J. Accounting for the Donnan Effect in Diafiltration Optimization for High-Concentration UFDF Applications. BioProcess Int. 12(1) 2014: 50–54.
7 Sandell LS, Goring DAI. Correlation Between the Temperature Dependence of Apparent Specific Volume and the Conformation of Oligomeric Propylene Glycols in Aqueous Solution. J. Polymer Sci. B Phys. 9(1) 1971: 115–126.
8 Elworthy PH, Florence AT. Chemistry of Non-Ionic Detergents Part X: Activity Coefficients of Polyoxyethylene Glycols and Alkyl Polyoxyethylene Glycol Ethers in Aqueous Solution. Kolloid-Zeitschrift und Zeitschrift für Polymere 208(2) 1966: 157–162.
9 Mallajosyula SS, Vanommeslaeghe K, MacKerell AD. Perturbation of Long-Range Water Dynamics As the Mechanism for the Antifreeze Activity of Antifreeze Glycoprotein. J. Phys. Chem. B 118(40) 2014: 11696–11706.
10 DeVries AL, Komatsu SK, Feeney RE. Chemical and Physical Properties of Freezing Point-Depressing Glycoproteins from Antarctic Fishes. J. Biol. Chem. 245(11) 1970: 2901–2908.
11 Komatsu S, DeVries AL, Feeney RE. Studies of the Structure of Freezing Point– Depressing Glycoproteins from an Antarctic Fish. J. Biol. Chem. 10(245) 1970: 2909–2913.
12 Graham LA, et al. Hyperactive Antifreeze Protein from Beetles. Nature 388(6644) 1997: 727–728.
13 Griffith M, Yaish MW. Antifreeze Proteins in Overwintering Plants: A Tale of Two Activities. Trends Plant Sci. 9(8) 2004: 399–405.
14 Winzor DJ. Reappraisal of Disparities Between Osmolality Estimates By Freezing Point Depression and Vapor Pressure Deficit Methods. Biophys. Chem. 107(3) 2004: 317–323; doi:10.1016/j.bpc.2003.11.010.
15 Bhatnagar BS, Bogner RH, Pikal MJ. Protein Stability During Freezing: Separation of Stresses and Mechanisms of Protein Stabilization. Pharm. Dev. Technol. 12(5) 2007: 505–523.
16 Sweeney TE, Beuchat CA. Limitations of Methods of Osmometry: Measuring the Osmolality of Biological Fluids. Am. J. Physiol. 264 (3, part 2) 1993: R469–R480.
Corresponding author Erinc Sahin and Vishal Nashine are senior research investigators; Aastha Puri is a research scientist; Mehrnaz Khossravi is associate director; and Rajesh Gandhi is group director of drug product science and technology at Bristol-Myers Squibb, New Brunswick, NJ 08903; [email protected].
You May Also Like