Voices of Biotech
Podcast: MilliporeSigma says education vital to creating unbreakable chain for sustainability
MilliporeSigma discusses the importance of people, education, and the benefits of embracing discomfort to bolster sustainability efforts.
It has been two decades since the theatrical release of the first Spider Man film with Tobey Maguire, the euro became the official currency for the European Union, and Anne Montgomery and Cheryl Scott began piecing together the inaugural issue of BioProcess International. In celebration of the 20th anniversary of this staple publication in the bioprocessing arena, we compared products and manufacturing capacity in 2002 with those in 2022 and delved into what has driven the changes that have occurred.
The biopharmaceutical industry, its state-of-the-art technologies, and the world at large all have changed since 2002. On the product side, the industry has witnessed an increase in the proportion of recombinant therapeutics sourced from mammalian cells, the emergence of antibody-based products expressed in microbial systems, and an explosion of mammalian-expressed antibody-based products. On the manufacturing capacity side, the industry has generated significant growth in mammalian manufacturing capacity, especially in Asia, along with industry-wide acceptance and implementation of single-use bioreactors. The changes we have witnessed in the past two decades have been intertwined (supply and demand) and at least partly driven by synergistic technological advances since 2002.
Created nearly 20 years ago itself, our proprietary bioTRAK database curates information related to recombinant biopharmaceutical products for the US/EU markets as well as the global facilities required to manufacture these products (1). To understand better how far the biopharmaceutical and bioprocessing industries have come since then, we extracted the profiles of products approved and made commercially available in both 2002 and 2022. We also used the profiles of operational bioreactors from 2002 and 2022. Note that although our database does include recombinant therapeutics that are designed specifically to treat SARS-CoV-2 infection (COVID-19), we did not include such products in our data set or analysis because of their unique manufacturing and approval processes.
Expression Technologies and Product Classes
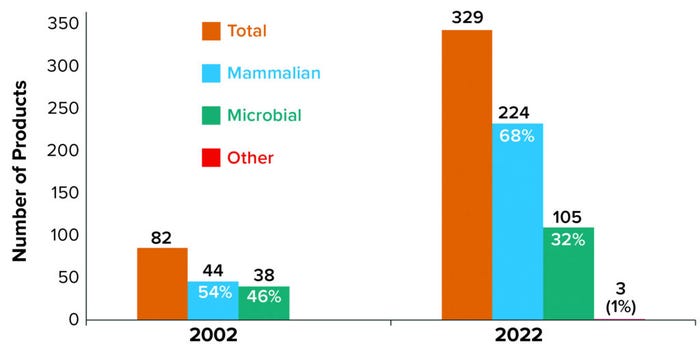
Products from mammalian cell culture have fueled the increasing numbers of approved products, with an 8.5% increase per year compared with 5.2% each year for microbially expressed products. As Figure 1 shows, the 82 recombinant products actively on the market in 2002 were split nearly evenly between mammalian and microbial sources. As of 12 June 2022, the number of commercialized recombinant products has grown significantly (>300%) to 329, with a noticeable shift in expression technology from a nearly even split in 2002 to a mammalian-based majority of nearly 70% in 2022.

Figure 1: Product distribution of marketed products by manufacturing technology
Analyzing the driving forces behind the growth in mammalian-based products easily reveals that antibody-based products (with a yearly growth of 12.5% over 20 years) are responsible. By comparison, yearly growth in the number of commercialized nonantibody-based products has been 4.7%. From microbial expression systems, the nonantibody-based products have a similar yearly growth rate to that of nonantibody-based mammalian products (4.8%), and antibody-based products demonstrated a slightly higher yearly rate of 13.9%. Because the first antibody-based product expressed in a microbial system was approved in 2006, we calculated the yearly growth rate for this group of products based on the 16-year period since then.
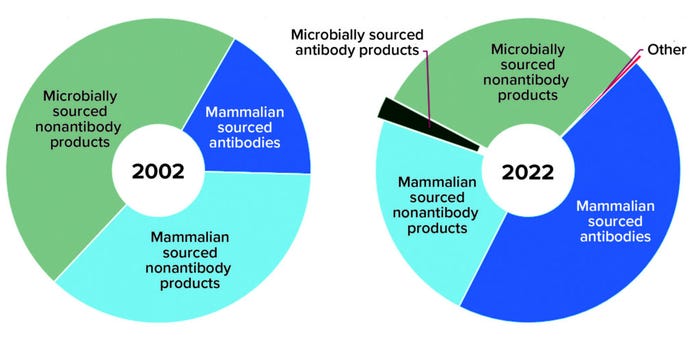
Antibody-based products include naked and bispecific full-length monoclonal antibodies (MAbs), antibody fusion proteins, and antibody fragments — as well as full-length and antibody-fragment conjugates leveraging an assortment of radiolabels, drugs, and polyethylene glycol (PEG) moieties. Nonantibody-based products include blood proteins, enzymes, cytokines, hormones, other proteins, and peptides as well as an assortment of conjugates. Over the past two decades, the overall approved product profile has shifted from a majority of nonantibody products (83%) to a more even distribution of nonantibody (53%) and antibody-based products (47%) (Figure 2).

Figure 2: Product type distribution of marketed products
Who’s Doing What
Expression Systems: In 2002, nonantibody products were the sole product group made using microbial expression systems; in 2022, antibody-based products represent nearly 8% of the 105 approved microbially expressed recombinant products — just 2% of all approved products. Back in 2002, a mammalian-based product was more likely to fall into the nonantibody category, which made up 68% of all mammalian products. In 2022, however, an approved mammalian-sourced product is more likely to be antibody based (66%).
Each product tracked in the bioTRAK database requires manufacturing capacity. Biopharmaceuticals can be made by product-development companies managing their own proprietary pipelines, outsourced through fee-for-service contract development and/or manufacturing organizations (CDMOs/CMOs), or manufactured by hybrid companies that both provide manufacturing services and manage their own product pipelines. In 2002, the total worldwide manufacturing capacity for non–insulin-based microbially expressed recombinant products was nearly 295,000 L. By 2022, that nearly doubled to just under 530,000 L.
The insulin market is unique and dissimilar from the general market of microbially sourced biopharmaceuticals. A small number of manufacturers are producing the large quantities of insulin required for the global market using dedicated manufacturing capacity. Production lines that are exclusive to insulin manufacturing are not available for making other recombinant proteins. Thus, we excluded insulin production from our microbial capacity totals and analysis.
Over the past two decades, mammalian-based cell culture capacity expanded nearly eight-fold, from nearly 795,000 L in 2002 to ~6,125,000 L in 2022. Table 1 highlights that growth along with changes in manufacturing distribution. For both mammalian and microbial systems, product-development companies have possessed the greatest proportion of capacity. However, the proportion of capacity owned by CMOs/CDMOs has increased three-fold relative to both product and hybrid companies over 20 years. During the period we analyzed, mammalian-based capacity for recombinant proteins grew yearly at 10.8% per year, whereas recombinant microbial-based capacity grew at 3.0% per year.

Table 1: Distribution of manufacturing capacity across own-product developers (in-house), contract manufacturing organizations (CMOs), and companies making both internal and external products (hybrid)
Geography: Our database includes manufacturing sites around the world that make biopharmaceuticals destined for US/EU patients. Figure 3 displays the regional growth exhibited for both mammalian and microbial (noninsulin) capacity over the past 20 years. North America continues to possess the largest proportion of mammalian cell-culture capacity. But Europe has emerged as the largest holder of microbial capacity. Although Asia has never possessed the largest proportion of either type, the region has grown the most during this time: yearly about 10% for microbial capacity and nearly 28% for mammalian.

Figure 3: Regional distribution of manufacturing capacity

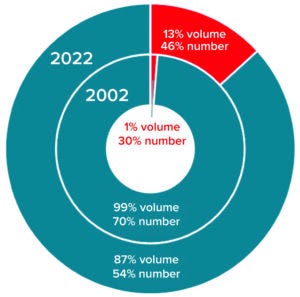
Figure 4: Comparing the distribution of
single-use bioreactors (red) and fixed
multiuse bioreactors (teal) for mammalianbased
manufacturing by volume and
number of bioreactors
It’s no surprise that the adoption and implementation of single-use technology has increased since 2002 (Figure 4). For mammalian-based manufacturing, single-use bioreactor capacity has grown from 1% to 13% volumetrically while the number of single-use bioreactors has increased from 30% to 46% of all installed units. By contrast, single-use fermentors did not exist in 2002 and currently represent <2% of microbially based manufacturing capacity (<10% of all fermentors installed).
Biomanufacturing Technologies
Antibody-based products initially were generated by in vivo methods. Kohler and Milstein’s 1975 invention of hybridoma technology set the stage for the advancement of antibody-based products, and the first such therapeutic from Chinese hamster ovary (CHO) cells in culture was approved in 1997 (rituximab). Other work in the 1990s furthered antibody-based products with yeast- and phage-display technologies, and the first phage-displayed antibody product was approved in 2002 (adalimumab). Since then, antibody-based products have evolved to a “platformed” technology with a somewhat standardized pathway for discovery and development.
Some recent advances are becoming more commonly used in developing future antibody products. These technologies include sequence optimization, improved antibody-target affinity through iterative refinements accompanied by binding-target and epitope predictions, and the increasing ability to create antibody products rationally for targeting difficult-to-isolate proteins. Acceleration of such advances has come from in silico modeling that leverages continually advancing computing capabilities, artificial intelligence, and “big-data” mining and manipulation. Equipment advances in liquid, cell, and sample handling have enabled significant high-throughput screening of antibody panels, pools, and even single clones. Those advances enable the industry to facilitate screening of individual primary B cells from immunized animals or convalescent patients for discovering antibodies that target unique antigens. Improvements in automation also have facilitated rapid high-throughput systems to synthesize genes, clones, and variant libraries.
Product-based technologies for discovery and development of recombinant proteins have not been the only contributors to the expansion of antibody products in the global market. Single-use technologies spanning the biomanufacturing process — from bioreactors to filters and chromatography columns to filling needles — have played an increasingly important role over the past two decades.
Single-use bioreactors for suspension cell culture began with the Wave system in the late 1990s. The first stirred-tank disposable reactor was introduced in 2006, paving a path toward 2,000-L reactors and larger. Regulatory approval of the first biopharmaceutical from a single-use bioreactor came in 2014 with velaglucerase alfa enzyme-replacement therapy for Gaucher’s disease (2). Offering several advantages over traditional stainless-steel bioreactors — smaller footprints, shorter times for installation, preparation, and turn-around — single-use technologies have expanded into a competitive market with numerous suppliers, ultimately lowering the bar of biomanufacturing accessibility worldwide.
Meanwhile, continuous manufacturing — combining a highly intensified, perfusion-based cell culture system with continuous downstream processing — is becoming a realistic goal for many bioprocessors. Advancements in this area are likely to bring increased availability and adoption of continuous technologies. That should further facilitate the expansion of biomanufacturing by decreasing the physical footprint of bioprocessing and improving productivity through unit-operation efficiencies.
Looking to the Future
With those product and manufacturing-related advances driving their discovery, development, and manufacturing, it is no surprise that antibody-based products from mammalian cell culture have emerged as the dominant product group since 2002. In 2022, the industry continues to leverage those manufacturing advances to reduce fixed manufacturing costs.
The resulting decrease in cost of goods (CoG) should lead to more affordable biotherapeutics. That would allow them to penetrate the markets for cost-sensitive indications and expand into treatment populations for whom treatment price once was a barrier. These developments will continue to drive the biopharmaceutical market for the foreseeable future.
We in the BioProcess Technology Group of BDO-USA congratulate and thank Anne, Cheryl, and the entire BPI team on 20 years of creating and maintaining such an influential publication and keeping the biopharmaceutical industry abreast of its ever-advancing capabilities and strategies. We are excited keep pace with the inevitable advances coming over the next 20 years of BioProcess International.
References
1 bioTRAK database. BDO-USA: Boston, MA, 2022; https://www.bdo.com/industries/life-sciences/bioprocess-technology.
2 Palmer E. Shire Announces FDA Approval of Manufacturing Facility for VPRIV® (Velaglucerase Alfa for Injection) Drug Substance. Fierce Pharma 14 February 2014; https://www.fiercepharma.com/manufacturing/shire-announces-fda-approval-of-manufacturing-facility-for-vpriv%C2%AE-velaglucerase-alfa.
Corresponding author Dawn M. Ecker is the managing director of bioTRAK database services within the BioProcess Technology Group, BDO-USA, LLP; [email protected]. Thomas J. Crawford is a senior associate at the BioProcess Technology Group, BDO-USA, LLP. Patricia Seymour is a managing director at the BioProcess Technology Group, BDO-USA, LLP, One International Place Boston, MA 02110; https://www.bdo.com/industries/life-sciences/bioprocess-technology. bioTRAK is a registered trademark of BDO-USA, LLP.
You May Also Like