Voices of Biotech
Podcast: MilliporeSigma says education vital to creating unbreakable chain for sustainability
MilliporeSigma discusses the importance of people, education, and the benefits of embracing discomfort to bolster sustainability efforts.
October 1, 2009
As an updated US FDA guidance document emphasizes, the life sciences industry needs to use data to better understand manufacturing processes and sources of variation to minimize product risk and achieve better process control in future batches (1). Lessons learned through such efforts also can be applied to future process design, extending the value of data analysis. Bioprocess manufacturers typically rely on lot traceability to determine the composition of their final manufactured products. Lot traceability is only one aspect of the required capability. It requires knowing all the upstream components that made up a final batch — and, therefore, which product lots need to be recalled when there is a defect in an upstream material or process condition. But lot traceability alone cannot meet all needs, especially when process streams undergo multiple splits and recombinations during the course of production.
A better solution is to use an appropriately designed enterprise manufacturing intelligence (EMI) software solution that accesses the right contextual data on demand and automatically accounts for “batch genealogy” to make meaningful upstream/downstream correlations possible. This can reveal important relationships between upstream process parameters and downstream process outcomes. The following case study about a manufacturing process for a drug I’m calling “Mycitra” (for anonymity’s sake) demonstrates how to use such data access and contextualizing software to make meaningful, quantitative correlations between parameters from upstream and downstream operations. The manufacturing process used here has a process stream that’s split and recombined with material from other subbatches along the way from its first to last process steps (Figure 1).
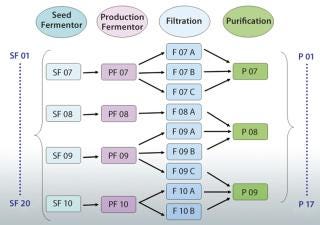
Figure 1: ()

Figure 1:
WWW.ISTOCKPHOTO.COM
An Anonymous Case Study
The Mycitra process includes an inoculation step followed by seed and production fermentor steps, and it ends with column purification steps. A satisfactory final product is produced with no batch failures, but testing shows a slightly higher impurity level (a byproduct) in some final batches. The team needs to understand the source of this process variability to achieve better process control in future batches. The first step of investigation includes examining available process data from different angles to find an explanation.
Initially, the team looks at a table view of the batch genealogy data, with all pathways by which process material moves from upstream to downstream steps visible along with splits and recombinations. Next, the replicate structure of the data is used to take step-to-step cardinality (step genealogy) into account when comparing parameters from upstream and downstream steps in the process. Finally, changing the batch ID mapping to look at data organized around a different step in the process provides additional explanations for which process conditions are driving the outcome.
Suppose we have a manufacturing process (Figure 2) where one process parameter in the first step is run at four different points within its approved range. If we want to determine whether a process parameter in step 1 correlates with the final process outcome, all pathways for the flow of materials between steps 1 and 4 must be considered, and the fractional contribution to the final product made by the process conditions in the first must be calculated. Using manual spreadsheets, calculations like this can rapidly become impractical and error-prone for a process with several splits and recombinations. Using appropriately designed EMI software, an investigating team can correlate upstream and downstream parameters much more easily by automatically taking batch genealogy into account.
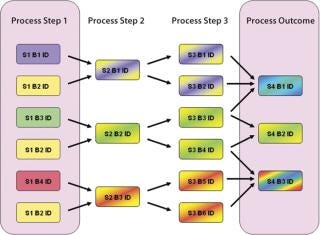
Figure 2: ()
For the Mycitra process in our case study (Figure 1), each production fermentor output is split during processing into several subbatches for filtration, then recombined for purification. The team can view the batch genealogy and all pathways that take each starting batch from a seed fermentor to final purification. Then a grouping of data is created (an analysis group, AG) labeled “SF” for the seed fermentor and set as the step around which all batch IDs should be organized (the step universe). This allows the software to automatically create a replicate structure for all data in the AG organized around the batch ID used at the SF step. The team can include in this AG the process parameters of interest from various steps organized around the same replicate structure, including the average impurity level derived from replicate impurity measurements made at the purification step. Data from available batches are used to create the AG.
Next, the team uses their software’s integrated data analysis environment to see the data in a tabular view and turn the average impurity parameter from the purification step into a replicate parameter. This replicate structure is generated to match the number of parameter values upstream and downstream and thus enable one-to-one comparisons and correlations. If the values for an impurity level are observed for their replicate structure, the batch IDs associated with each process step between the upstream seed fermentor and the downstream purification step appear as replicate parameters along with the respective values for that associated impurity level. There are a total of 20 batches at the seed fermentor step, so only a few batches are reviewed for simplicity’s sake. That enables the team to view a genealogy table and see for each selected upstream batch all the possible pathways between upstream and downstream to find the level of impurity that actually occurs in each batch.
Focus on Purification: It now makes sense to center the step universe on the final purification step and compare downstream batches (Figure 3). Now all upstream parameters are replicated to match the number of downstream batches, so the team can make correlations if necessary. The following types of analyses can be performed:
Discrete control charts showing contamination levels (Figure 3)
Multiple correlations on a single chart/scatter plot
Linear regression
Score plots showing similarities and differences among batches
Loadings plots showing which parameters stand out to help create hypotheses (e.g., perhaps the combination of temperature and pH level is the problem)
Interaction plots of the temperature and pH.
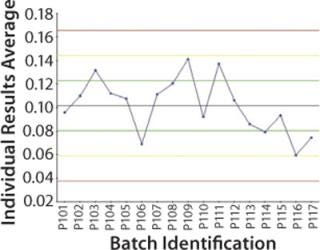
Figure 3: ()
The Mycitra team uses the final purification step as the step universe to examine impurity concentrations across the batches (Figure 3). The team finds no significant correlations between the outcome of interest and any parameters in the upstream SF step. Looking further, however, when centering the step universe on the filtration step, each filtration batch became a separate batch ID, and the team ends up with 51 corresponding downstream batch IDs. (In each case, three filtration subbatches were combined into one purification batch, and there were 17 batches at the purification step, so the number 51 comes from three times 17.)
Using the new AG, the team can examine the effect of pH, osmolality, and final volume across the filtration batches on the final impurity level associated with each upstream filtration batch. On the control chart, the team notices that protein concentration is abnormally high in some filtration batches, which may result in high impurities downstream. The hypothesis is that a more concentrated filtered bulk solution could have higher by-product impurity levels downstream because of protein–protein interactions in the presence of catalysts in the process stream.
To prove that hypothesis quantitatively, the team performs a correlation (Figure 4). With 51 batches at filtration and only 17 batches (only 17 independent impurity measurements) at purification, the EMI software would use three repeated values of the impurity level in each final product batch for this calculation. Such an approach can give an overestimated correlation. To prevent that, the “universe” is switched over to the purification step (Figure 4).
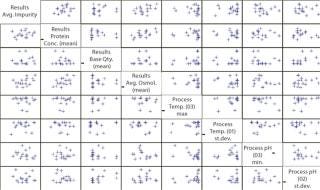
Figure 4: ()
Focus on the Seed Fermentor: The team does not see any process parameters upstream that correlate with the impurity, so the raw material lots/vendors are examined to determine whether they are associated with higher impurity levels. There is, of course, no way to calculate the weighted average of a vendor or lot name, so the SF step is used as the universe, in which each raw material lot is an individual batch. That way, associations among the impurity levels, media lots, or vendors can be observed.
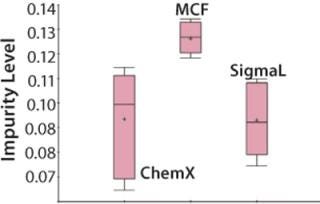
Figure 5: ()
Switching to the SF step universe allows the team to easily compare outcomes associated with raw materials from different vendors and begin testing the hypothesis that characteristics of media from a particular vendor may be responsible for high impurity levels in the product. Now the EMI software compares the weighted average of downstream impurity levels with upstream media pH in the SF step. Repeating this calculation for all SF batches gives 20 values for the estimated impurity levels resulting from them. That enables the team to view downstream impurity levels with the upstream SF batches or media lots on a line plot or a control chart. A discrete line plot shows impurity levels for each media lot, so the team can easily see that nine media lots are associated with the high impurity level in the final product.
The Mycitra team knows that media from several different vendors were used in this manufacturing process. So the media vendor parameter is added from the hierarchy, and a “box and whisker” plot is used to select the impurity level and group its results by vendor (Figure 4). There are a total of three vendors, and the media lots from one of them appear to be associated with higher levels of impurity in the final product compared with those from the other two.
An analysis of variance (ANOVA) test among groups is used to support or refute this conclusion. It shows that one of the three material vendors is statistically associated with higher impurity levels. Now the team can look closely at only those batches produced using raw materials from that vendor. They perform a linear regression restricting batches to those from the implicated vendor only, which shows that the media pH for those batches correlates to the high impurity. The solution is either to stop using material from that vendor or to keep the media pH low when using those raw materials.
Speeding Up a Complex Task
This case study demonstrates how easy it is to correlate upstream and downstream parameters in several different ways using appropriately designed EMI software to take the genealogy of all batch splits and recombinations automatically into account. This example may be somewhat simplistic, but doing similar calculations in an Excel spreadsheet for a 10- or 20-step process with numerous splits and recombinations could take days and probably cannot be done without introducing an unacceptable level of error. The ability to easily set different process steps as the center of the “step universe” can provide different perspectives on process data and is helpful to unravel important relationships between upstream process parameters and downstream process outcomes.
The availability of appropriately designed self-service, on-demand data access technology that automatically accounts for the batch genealogy context in upstream/downstream correlations helps process designers and investigative teams in many ways. They can automatically account for the fractional contribution of process inputs to downstream outcomes resulting from splits and recombinations in the process stream, even when the split ratios are different for each run. Without this capability, manufacturers may not be able to make meaningful upstream/downstream correlations. Appropriately designed EMI software helps to understand the influence of upstream process conditions on downstream process outcomes to identify sources of unacceptable variability in downstream critical quality attributes (CQAs). Meaningful correlations can be made between final process outcomes and upstream process conditions without using spreadsheets or other manual methods that can introduce errors. And finally, the lessons learned can be transferred from current processes into future process designs, proactively anticipating the effects of splits and recombinations.
1.) CDER/CBER/CVM 2008. Guidance for Industry: Process Validation — General Principles and Practices, US Food and Drug Administration, Rockville.
You May Also Like