Voices of Biotech
Podcast: MilliporeSigma says education vital to creating unbreakable chain for sustainability
MilliporeSigma discusses the importance of people, education, and the benefits of embracing discomfort to bolster sustainability efforts.
Sponsored by Repligen
 Antisense oligonucleotides (ASOs) are short, synthetic, single-stranded oligodeoxynucleotides that can alter RNA and reduce, restore, or modify protein expression through several distinct mechanisms. ASO technology has become an important drug discovery platform for most major pharmaceutical companies. To date, six antisense drugs have been approved by regulatory agencies to treat diseases spanning viral infections, hyperlipidemias, and neurological diseases. More than 50 additional ASO drugs are in clinical trials.
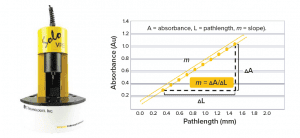
For an ASO drug product, an assay of its active pharmaceutical ingredient (API) provides a critical quality attribute (CQA) because of its direct impact on drug safety and efficacy. Therefore, proper in-process control (IPC) measurements must be implemented to ensure that an ASO assay results are within an acceptable range during different unit operations of drug-product manufacturing (e.g., API compounding and bulk filtration). We have used a platform HPLC-UV method for IPC assay measurements. Recently, we have developed a SoloVPE system assay a Slope Spectroscopy method that can provide both accuracy and precision comparable with those of HPLC. Moreover, the method provides several appealing advantages over use of HPLC, including simpler instrument setup, test procedure, and data analysis, all of which contribute to a shorter turnaround time.
Materials and Equipment |
SoloVPE device, C Technologies, Inc., a Repligen Company Cary 60 UV-vis spectrophotometer, Agilent Technologies ConfiRM–MID (m0.14) slope standard, SoloVPE Fibrette optic cable, Largest fused silica vessel (15 mm), ASO GMP and development batches (various lots), Ionis Pharmaceuticals ASO reference standard solutions (various lots), Ionis Pharmaceuticals |
This application note demonstrates the SoloVPE system’s universal ability to measure assay concentrations for ASOs of different chemical modifications precisely and accurately (see the Materials and Equipment box). We consider the Slope Spectroscopy method to be a promising new platform IPC assay method for ASO drug products.
Method Principle
The determination of ASO concentration using the SoloVPE system is based on the following Beer‑Lambert law–derived slope-spectroscopy equation:
m = εc
where m is the slope of the regression line by plotting absorbance as a function of pathlength at a given wavelength, ε is the extinction coefficient, and c is the sample concentration. Our method uses an ASO reference standard solution of a known concentration to eliminate a need to predetermine the ε value of the ASO. In this case, the sample concentration can be calculated using the following equation:
 where CStandard and CSample are concentrations of the standard and the sample, respectively, and mStandard and mSample are slopes of the standard and the sample at 260 nm, respectively. The measured sample concentration is adjusted further by an API purity factor to be reported as the final assay value.
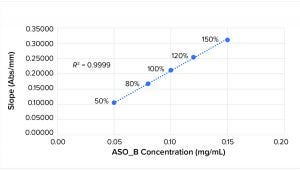
Figure 1: Linearity plot for ASO_B
Results and Discussion
The SoloVPE system method was tested extensively for ASOs with a number of chemistry modifications, including but not limited to base modifications, sugar modifications, internucleotide linkage modifications, and N-acetylgalactosamine (GalNAc) conjugates. Furthermore, the method has been validated internally as well as at contract manufacturing organizations (CMOs) for a number of ASOs in accordance with ICH Q2(R1) guidance.
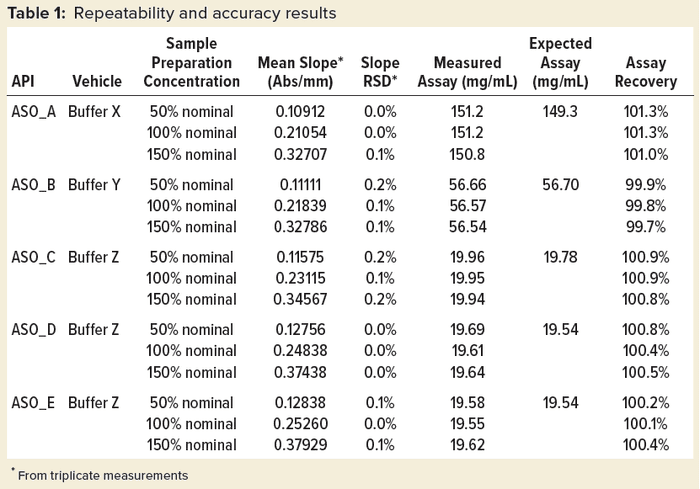
Table 1 shows repeatability and accuracy results of representative ASOs in different aqueous solutions. An expected assay of each sample was assessed using a qualified LC-UV‑MS method. In general, slope %RSD is no more than 0.2% from triplicate measurements for all the studied ASOs, whereas assay %recovery is within 98.0–102.0% when compared with the expected value.
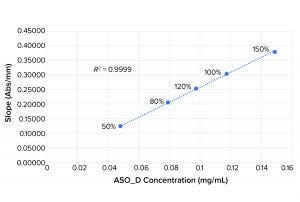
Figure 2: Linearity plot for ASO_D
Figures 1 and 2 show linearity plots for ASO_B and ASO_D: variations of mean slope as a function of ASO concentration ranging from 50% to 150% of the nominal target value and corresponding linear regression fitting curves by setting the intercept to 0. The excellent fit (R2 = 0.9999 for both ASO_B and ASO_D) confirmed the validity of the linear equation described in the above method principle.
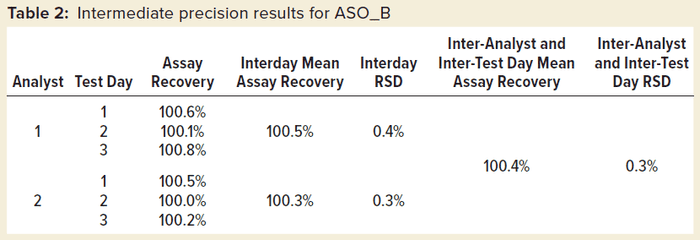
Table 2 shows intermediate precision results for one sample preparation of ASO_B measured by two different analysts on three different test days. We saw excellent intermediate precision with both interday %RSD and overall %RSD <1.0%.
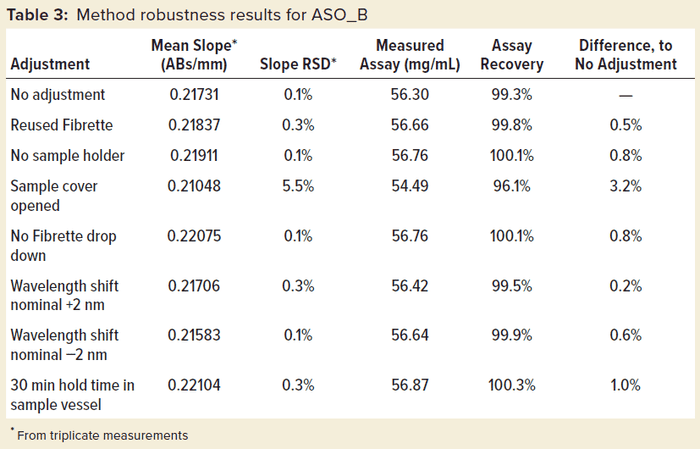
Robustness was tested further on ASO_B, as shown in Table 3. When this test was run, deliberate deviations from the standard operating procedure were performed. Among all those modifications to the method, only the action of leaving the sample cover open led to a significant increase in slope %RSD and an obviously underestimated assay value. That increased data variability can be explained by stray light affecting the measurement with the instrument cover open, leading to out-of-specification results.
Those can be remedied easily if the same sample is remeasured with the cover properly closed. Whereas that particular test scenario failed the robustness criteria as expected, all other protocol deviations passed with a very low %RSD of 0.1–0.3% and no more than 1% difference from the standard protocol, demonstrating the excellent robustness of the method.
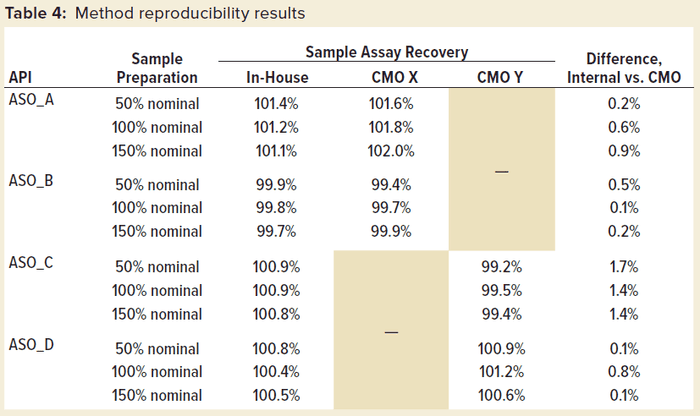
This method has been transferred successfully to CMOs and implemented in good manufacturing practice (GMP) drug-product manufacturing. Table 4 shows method reproducibility results of four different ASOs at the CMOs. Good reproducibility of the method between in-house and CMO results was confirmed, with the difference in assay %recovery being less than 2.0% for all the tested samples.
Accurate, Precise, and Robust
The SoloVPE system assay method has been proven to be accurate, precise, and robust. Therefore, it can easily and successfully be validated in accordance with ICH Q2(R1) requirements for chemically modified ASOs. We have shown herein that the Slope Spectroscopy method can be implemented universally across multiple sites with consistent results throughout product transfers. With all products tested for percent recovery, this resulted in an overall difference of <2%. Our results highlight the simplicity and performance of the SoloVPE system technology in comparison with HPLC. They provide the same level of accuracy and precision, but the overall time savings are greatly increased. Using the traditional method would take approximately six hours, whereas by using the SoloVPE system, multiple samples can be measured in under two hours, providing a 67% cost/time reduction compared to the former fixed-pathlength traditional UV method. The Slope Spectroscopy method enables significant process improvements that decrease turnaround time and simplify testing procedures. Therefore, the SoloVPE system and the Slope Spectroscopy method are qualified to serve as an efficient and universal IPC assay instrument and method for ASO drug-product manufacturing.
For Further Reading
Bennett CF. Therapeutic Antisense Oligonucleotides Are Coming of Age. Annu. Rev. Med. 70, 2019: 307–321; https://doi.org/10.1146/annurev-med-041217-010829.
Capaldi DC, Scozzari AN. Manufacturing and Analytical Processes for 2ʹ-O-(2-Methoxyethyl)-Modified Oligonucleotides. Antisense Drug Technology: Principles, Strategies, and Applications (2nd ed). Crooke ST, Ed. CRC Press, Boca Raton, FL 2008: 401–434; https://doi.org/10.1002/cmdc.200900040.
Crooke ST, et al. RNA-Targeted Therapeutics. Cell Metab. 27(4) 2018: 714–739; https://doi.org/10.1016/j.cmet.2018.03.004.
ICH Q2(R1). Validation of Analytical Procedures: Text and Methodology. International Council for Harmonisation of Technical Requirements for Pharmaceuticals for Human Use: Geneva, Switzerland, 2005; http://academy.gmp-compliance.org/guidemgr/files/Q2(R1).pdf.
Haiqing Yin is the assistant director, pharmaceutical development;
Ashley Davalos is a research associate, pharmaceutical development; and
Julie Ma is the director, pharmaceutical development, at Ionis Pharmaceuticals in Carlsbad, CA. Corresponding author Sara Haydu is a bioanalytics applications specialist at C Technologies, Inc., in Bridgewater, NJ; [email protected].
You May Also Like