Voices of Biotech
Podcast: MilliporeSigma says education vital to creating unbreakable chain for sustainability
MilliporeSigma discusses the importance of people, education, and the benefits of embracing discomfort to bolster sustainability efforts.
Sponsored by Cygnus Technologies
On paper, scaling a bioprocess from a 10-L to a 100-L to a 2,000-L bioreactor may seem like a straightforward math problem that could be solved by software. In practice, however, the exercise relies on a complex set of biological, chemical, and engineering assumptions; on maintenance of healthy cell cultures; and on management of equipment and analytics while adjusting to each increase in scale (1). Process development and quality control groups need to monitor how scale-up might affect critical quality attributes (CQAs) of a drug substance (DS) — including host cell proteins (HCPs). The HCP profile can change during process scale-up, necessitating further adjustments to the downstream purification process.
Although many HCPs are benign, some are immunogenic. Others can interact with a DS and reduce effective product dosage, which ultimately poses some risk to patients and can limit drug efficacy and stability. Managing HCPs thus constitutes a significant component of each biopharmaceutical drug developer’s overall risk-management strategy (2, 3). Organizations can choose to monitor HCPs in-house — often using enzyme-linked immunosorbent assay (ELISA) methods — and troubleshoot throughout the scale-up process. Some companies rely on service partners that understand the issues that can arise when increasing the scale of bioreactors and cell cultures.
In the following case study, a client experienced a fivefold increase in HCP concentration in a final DS after scaling up the bioprocess, with results evaluated by a Chinese hamster ovary (CHO) cell HCP ELISA kit. The company requested help from Cygnus Technologies in troubleshooting the process, which had been established by a contract manufacturing organization (CMO) at 450-L scale and then transferred to a new CMO (the client). The new CMO established technical feasibility in a 50-L pilot scale bioreactor and then scaled up to a 2,000-L current good manufacturing practice (CGMP) bioprocess. That process quantified about 5× higher levels of HCP in the DS than the 450-L scale. For analysis, the client collected samples from harvest material from each bioreactor, from each of the three main downstream process steps (Steps 1–3), and from the drug substance (DS). One hypothesis suggested that cross-reactivity of the anti-CHO HCP antibody with the DS made the DS interfere with the ELISA used to assess HCP concentration, causing an increase in signal by the increase in DS amount present.
Orthogonal Methods: In 2013, Cygnus Technologies developed a novel and proprietary immunoaffinity chromatography method called Antibody Affinity Extraction (AAE). It was designed to address the technical challenges and limitations of other orthogonal methods, such as two-dimensional Western blotting (2D WB) and 2D differential in-blot electrophoresis (2D-DIBE), which have been used to assess antibody coverage of HCPs. With an ability to extract and concentrate large sample volumes, the AAE method offers sensitivities that are higher than those of 2D electrophoresis. The immunoaffinity method is more predictive of how an anti-HCP antibody will perform in a HCP ELISA and provides sufficient sensitivity to evaluate individual HCPs that persist through purification processes.
In an AAE procedure, an HCP polyclonal antibody is immobilized covalently on a chromatography support. Iterative binding of an HCP sample is performed until no additional HCP binds, then elution fractions are pooled and prepared for subsequent analysis as described below (Figure 1). We used the same anti-CHO HCP polyclonal antibody from the ELISA kit the client used for our AAE-MS method, which incorporates liquid chromatography and mass spectrometry (LC-MS) to identify and quantitate HCP contents. Such MS analytics can be used to evaluate process changes, perform risk assessments, and characterize HCP reagents.
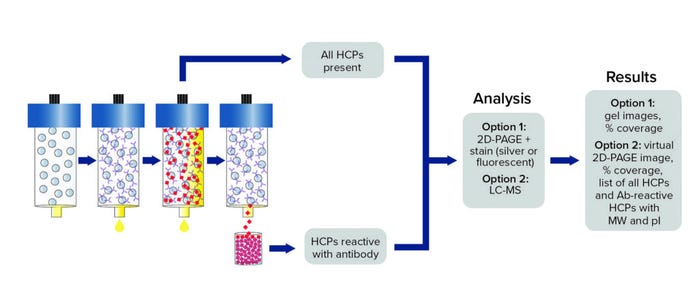
Figure 1: Antibody coverage by antibody affinity extraction (AAE) technology with two-dimensional polylacrylamide gel electrophoresis (2D-PAGE) or liquid chromatography with mass spectrometry (LC-MS) analysis options; MW = molecular weight, pI = isoelectric point.
The ELISA and AAE-MS technologies complement each other to provide actionable information: ELISA measures global HCP quantitation, and LC-MS identifies HCPs by molecular weight (MW) and isoelectric point (pI) while providing a secondary form of quantitation. To investigate where the breakdown in the CGMP bioprocess occurred in this case, we performed AAE-MS testing on customer-supplied aliquots from different steps of the CGMP purification process and found that HCPs were enriched in Step 3. Our report to the customer contained MW, pI, and quantity data on identified HCPs, enabling the client to make selective changes (e.g., related to MW cutoff and ion-exchange chemistries) in the purification process to remove those inadvertently enriched HCPs.
Materials and Methods
Samples: All samples were collected by the customer and sent to Cygnus Technologies:
• DS samples from 50-L (DS-50L), 450-L (DS-450L), and CGMP DS (DS-2000L) bioreactors
• 2,000-L mock harvest sample and samples from steps 1-3 of downstream CGMP process.
Sample Preparation: In a proprietary protocol, the anti-CHO HCP polyclonal antibody from Cygnus Technologies (F550 CHO HCP ELISA, 3G kit) was bound covalently to a chromatography support (the AAE column). That column was conditioned to prevent significant leaching of the antibody and to minimize nonspecific binding. We passed HCP-containing samples over the AAE column to extract reactive HCPs using a ÄKTA 25-L fast protein liquid chromatography (FPLC) system from Cytiva. The resulting samples were reduced, alkylated, digested with trypsin, desalted, and concentrated.
LC-MS: Peptides from digested proteins were separated on a Vanquish Horizon ultrahigh-pressure liquid chromatography (UHPLC) system by a reversed-phase C18 chromatography column and injected into an Orbitrap Eclipse Tribrid mass spectrometry system (both instruments from Thermo Scientific). We used data-dependent acquisition of results, analyzing samples in triplicate and in a randomized sequence. To minimize sample carryover, we implemented blank washing runs between sample injections.
HCPs were identified based on two peptides per protein from triplicate runs, using data searched from the proprietary, curated Cygnus Technologies CHO HCP database using Proteome Discoverer software from Thermo Fisher. Data about identified HCPs were exported into Microsoft Excel for analysis.
Our company’s proprietary, curated CHO HCP database includes information on pI, MW, and common contaminants (such as BSA, keratins, and trypsin) for identifying proteins. We spiked the Cygnus protein standard (CPS) into all samples and calculated the concentration (ppm) of HCPs in the harvest sample relative to CPS at 1,000 ppm. Then we calculated the ng/mL of harvest-sample HCPs by multiplying a Coomassie (Bradford) quantification in mg/mL of the sample by the ppm value. HCPs in both ng/mL and ppm were quantified relative to the DS Coomassie (Bradford) concentration in mg/mL. The lower limit of quantitation (LLoQ) of the CPS relative quantification is 10 ppm, and the LoD is 1 ppm.
Virtual 2D Gel Graphs: We generated a virtual 2D gel graph from MS results. In such graphs, green spots represent proteins found in samples taken before (pre-) and after (post-) AAE preparation. Red spots represent proteins found only in pre-AAE samples, and black spots represent those found only in post-AAE samples.
Antibody Coverage Calculation: Polyclonal ELISA antibody coverage is represented as a range between upper and lower coverage-boundary calculations. The lower boundary is calculated as post-AAE proteins ÷ unique proteins, which includes the calculation for the number of unique proteins (derived by adding pre- and post-AAE proteins, then subtracting matching proteins). The upper coverage boundary is calculated as post-AAE spots ÷ pre-AAE spots.
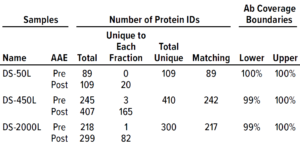
Table 1: Antibody coverage for Chinese hamster ovary (CHO) cells and identification of host-cell proteins (HCPs) from drug-substance samples by the F550 CHO 3G kit.
Results and Discussion
We analyzed three DS samples provided by the customer and characterized them before and after AAE-MS preparation for F550 CHO 3G antibody coverage and HCP identification (Table 1). With this method, we identified
• 109 unique proteins in DS-50L (89 in pre-AAE, 109 in post-AAE, 89 matching, showing 100% antibody coverage)
• 410 unique proteins in DS-450L (245 in pre-AAE, 407 in post-AAE, 242 matching, showing 99–100% antibody coverage)
• 300 unique proteins in DS-2000L (218 in pre-AAE, 299 in post-AAE, 217 matching, showing 100% antibody coverage).
Those results indicated broad F550 CHO 3G antibody coverage for all DS samples.
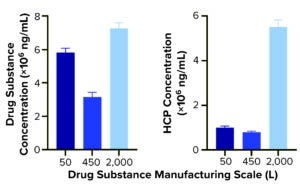
Figure 2a: Quantification of drug substance and HCPs at different bioprocessing scales.
Comparing DS HCP concentrations revealed differences among the three bioreactor process scales (Figures 2a and 2b). DS (in italics) and HCP concentrations (in parenthesis) were determined to be 5.8 mg/mL (10.0 μg/mL) for DS-50L, 3.1 mg/mL (8.0 μg/mL) for DS-450L, and 7.3 mg/mL (55.1 μg/mL) for DS-2000L (Figure 2a). Figure 2b displays that quantitative information in percent composition plots, further illustrating the difference in DS purity: As manufacturing scale increased from 50L to 2,000L, so did the percentage and concentration of HCPs observed in the final DS.
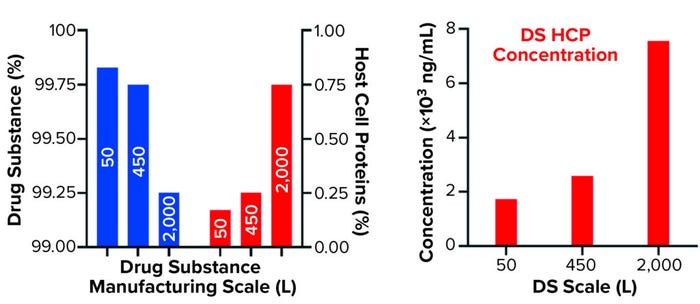
Figure 2b: Quantification of drug substance and HCPs at different bioprocessing scales
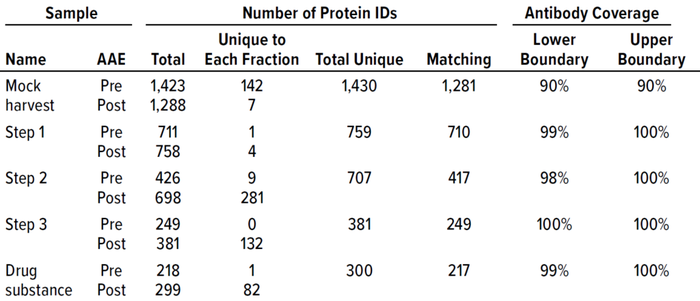
Table 2: F550 CHO 3G kit antibody coverage and HCP identification at good manufacturing practice (GMP) 2,000-L scale.
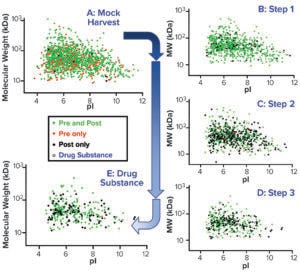
Figure 3: Virtual 2D gels of the CGMP 2,000-L purification process.
To confirm that the 2,000-L scale resulted in a higher HCP content than the other two bioprocess scales, we analyzed samples from each purification step by the AAE-MS method (Table 2). A progressive decline in the number of HCP identifications reflects an effective purification scheme (Figure 3). We show a progressive decrease from 1,430 proteins in the harvest material to 300 unique proteins in the DS-2000L.
We further characterized samples collected from individual steps by comparing LC-MS and ELISA quantitative data (Figure 4), excluding the mock harvest data for clarity. By tracking DS concentration through the 2000-L purification process, we determined that it decreased from Step 1 to Step 2 but increased in the final DS-2000L step. Data analysis revealed an effective mechanism for the decreasing HCPs from Step 1 to Step 3 based on the characteristics of the HCPs. However, HCP concentration increased after Step 3 (diafiltration), as did the DS itself. HCP quantification by ELISA and MS correlated well in Steps 2–3 and the final DS (Figure 4b).

Figure 4: Drug substance (DS) and host cell protein (HCP) impurity quantification in steps 1–3 of current GMP (CGMP) 2,000-L scale process; ELISA = enzyme-linked immunosorbent assay, MS = mass spectrometry.
The F550 CHO HCP ELISA 3G kit results also showed an increase in HCP concentration from Step 3 to DS. The original hypothesis for that difference had been interference from cross-reactivity of the antibodies with the DS leading to an increase in signal. The MS data refuted that, however, by demonstrating an increase in DS concentration even as both MS and ELISA methods showed a decrease in HCP amounts from Step 2 to Step 3 (Figure 4).
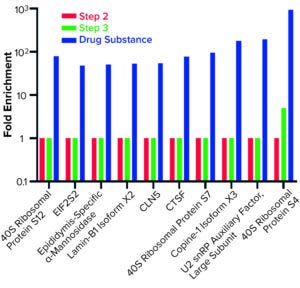
Figure 5: Host cell proteins enriched from step 3 to drug substance.
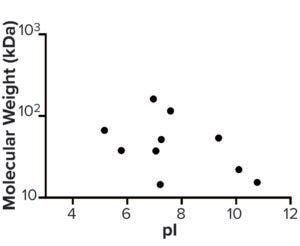
Figure 6: Molecular weight (kDa) and pI of host cell proteins enriched from step 3 to drug substance.
AAE-MS data analysis of Steps 1–3 and the final DS revealed several insights. HCPs were removed during Steps 1–3, but increased in concentration from Step 3 to DS. Plotting the fold increase in HCP concentration in Step 2, Step 3, and DS relative to the concentration in Step 1 shows that HCPs are increased by 10- to 1,000-fold (Figure 5). Those that increased from Step 1 to DS were mostly <100-kDa in MW, with pI values of 5–8 (Figure 6). Furthermore, a subset of HCPs was not cleared at all (Figure 7). Those had MWs of 50–100 kDa and pI values of 6–8 (Figure 8). These insights into the characteristics of the HCP impurities were reported to the customer as recommendations for process improvement.
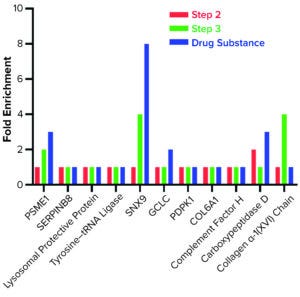
Figure 7: Host cell proteins not cleared during steps 1–3.
Proactive Analysis
Combining AAE-MS and ELISA methods provided an orthogonal analysis of drug substances and a bioprocess purification scheme to yield actionable information for a customer. The resulting information validated the client’s concerns regarding its scaled-up bioprocess. AAE-MS results provided quantitative information for HCPs present to allow for careful analysis of each purification step. That enabled the customer to observe which proteins were being enriched in its existing purification process. ELISA results provided an orthogonal analysis that confirmed the MS data reported. The MS data also highlighted the ELISA kit’s specificity because it did not detect the customer’s DS.
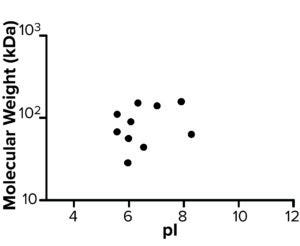
Figure 8: Molecular weight (kDa) and pI of host cell proteins not cleared during steps 1–3.
MS plays an important role in HCP analytics from clinical through postmarket phases, in evaluating the impacts of process changes, in risk assessment, and in characterizing reagent changes. Although complete characterization of downstream HCPs is not among current regulatory expectations, the value of such information to help biopharmaceutical companies improve product safety and efficacy are recognized as value-added data by proactive manufacturers and regulators.
References
1 Carpio M. Current Challenges with Cell Culture Scale-Up for Biologics Production. BioPharm Int. 33 (10) 2020: 23–27; https://www.biopharminternational.com/view/current-challenges-with-cell-culture-scale-up-for-biologics-production.
2 ICH Q11. Development and Manufacture of Drug Substances (Chemical Entities Biotechnological/Biological Entities). US Fed. Reg. 77(224) 2012: 69634-52012; https://database.ich.org/sites/default/files/Q11%20Guideline.pdf.
3 ICH Q6B. Test Procedures and Acceptance Criteria for Biotechnological/Biological Products. US Fed. Reg. 64, 1 August 1999: 44928; https://database.ich.org/sites/default/files/Q6B%20Guideline.pdf.
Further Reading
To learn more about Cygnus Technologies HCP analytical methods and services, see below.
Isaac J, et al. AAE-MS™ as an Orthogonal Method in HCP Analytics. BioProcess Int. eBook, July 2021; https://www.cygnustechnologies.com/media/folio3/productattachments/articles/AAEMS_as_an_Orthogonal_Method_in_HCP_Analytics_BioProcess_International_19_7_E1_July_2021_E-Book.pdf.
Isaac J, Zilberman A, Bishop E. Case Study: Bridging Anti-CHO HCP Antibodies from Two 3rd Generation Cygnus CHO HCP ELISA Kits by AAE-MS™. Cygnus Technologies (Maravai LifeSciences): Southport, NC, January 2020; https://www.cygnustechnologies.com/media/folio3/productattachments/whitepapers/Cygnus-Case-Study-CHO-Antibody-AAE_2022_web_F_v1.pdf.
Isaac J, Bishop E, Hoffman K. Antibody Affinity Extraction™ (AAE™) Empowers HCP Identification by Mass Spectrometry. Cygnus Technologies (Maravai LifeSciences): Southport, NC, 2019; https://www.cygnustechnologies.com/media/folio3/productattachments/whitepapers/cygnus-aae-appnote.final.v2.digital.pdf.
Zilberman A, et al. Host Cell Protein Analysis: Immunoassays and Orthogonal Characterization By Antibody Affinity Extraction and Mass Spectrometry Methods. BioProcess Int. special report, 17 August 2022; https://bioprocessintl.com/sponsored-content/host-cell-protein-analysis-immunoassays-and-orthogonal-characterization-by-antibody-affinity-extraction-and-mass-spectrometry-methods.
Host-Cell Protein Analytics: History and Future Trends. BioProcess Int. 20(7–8) 2022: 60–62; https://bioprocessintl.com/sponsored-content/host-cell-protein-analytics-history-and-future-trends.
Cygnus Techologies. HCP ELISA and HCP Ab Coverage Analysis. Vimeo, 2021; https://vimeo.com/498498406.
Cygnus Technologies. HCP Immunoassays and Role of Mass Spec in Identification of HCP Impurities in Downstream Samples. Vimeo, 2021; https://vimeo.com/511329015.
Cygnus Technologies. HCP Immunoassay Qualification: Review of Orthogonal Methods. Vimeo, 2021; https://vimeo.com/531474928.
Kerry Wooding, PhD, is a mass spectrometry scientist; Jacob Stubbs is a research and development associate; and Jared Isaac, PhD, is associate director of the chromatography and mass spectrometry group at Cygnus Technologies, LLC (part of Maravai LifeSciences), 4332 Southport-Supply Rd SE, Southport, NC 28461; 1-910-454-9442; https://www.cygnustechnologies.com.
AAE and AAE-MS are trademarks of Cygnus Technologies. ÄKTA is a registered trademark of Cytiva. Vanquish, Orbitrap Eclipse, Tribrid, and Proteome Discoverer are registered trademarks of Thermo Fisher Scientific.
You May Also Like