Voices of Biotech
Podcast: MilliporeSigma says education vital to creating unbreakable chain for sustainability
MilliporeSigma discusses the importance of people, education, and the benefits of embracing discomfort to bolster sustainability efforts.
December 1, 2013
You’ve probably been hearing a lot about risk assessment in recent months. Indeed, some 15 times more articles have been printed referencing the concept over the past year relative to a 12-month period just three years ago. That truly represents a geometric progression. Unfortunately, very few authors have been able to disambiguate the different methods or provide insight into this time-tested, multiple-industry philosophy that at its core uses good science to make better decisions.
When we undertake the challenge to understand risk, we are simply trying to be honest with ourselves in accepting that there are always unforeseen (as well as foreseen) risks in every process and system. In analyzing flood risk — for which the human decision-making engine is probabilistically underprepared to function well — one field statistician observed, “For extremely rare events, correct uncertainty estimates may lead us to conclude that we know virtually nothing. This is not such a bad thing. If we really know nothing, we should say so!” (1).
PRODUCT FOCUS: BIOPHARMACEUTICALS
WHO SHOULD READ: EXECUTIVES, PROJECT MANAGERS, QUALITY AND REGULATORY AFFAIRS
KEYWORDS: RISK MANAGEMENT, FMEA, LOGIC, DECISION-MAKING, ISHIKAWA DIAGRAM, ANALYSIS
LEVEL: INTERMEDIATE

Human decision-making under uncertainty is extremely fallible. Generally, our human tendency is to demonize new technology or courses of action that have catastrophic potential (e.g., nuclear power stations) — and we do so at the omission of probability information related to the actual likelihood of a problem. That is a critical oversight because of how risk is formally defined:

where R is risk, Pf is the probability of failure, and Mc is the magnitude of consequence should the failure mode occur. Because of that, probability is equally relevant as consequence. In the examples of flooding or nuclear power, although our human tendency is to focus on the catastrophic potential effects of failure, we do so at the expense of understanding how likely it is to happen.
From its Pasadena, CA, facility, the US National Aeronautics and Space Administration’s (NASA’s) Jet Propulsion Laboratory (JPL) tracks near-Earth objects (NEOs, http://neo.jpl.nasa.gov/ca) against the associated probabilities of any given object being an Earth-impactor with civilization-ending effects. If JPL were to detect an asteroid with potential for such catastrophic effect, that discovery would create mass panic. But it should not drive us to undertake irrational behaviors if the asteroid’s chance of hitting Earth was nearly zero. Our human inclination to overreact doesn’t apply only to real or perceived threats of catastrophic harm; our related cognitive processing carries through to all levels of decision-making and aspects of life.
The Manager’s Fallacy is an inability to make use of on-hand information thoughtfully and practically for improving decision-making potential. The real results of this cognitive fallacy were illustrated by a study in which a group of subjects was faced with hypothetical managerial decisions (2). Fewer than one in four participants asked for probabilistic information, and not one study participant sought precise likelihood data. In a group that was presented with precise likelihood data, fewer than one in five participants drew upon probabilistic concepts when making choices about alternative courses of action.

The Buyer’s Fallacy is a path of fallacious reasoning based on the fact that people generally dismiss low-probability events unless they personally experience them (which is certainly the last thing you’d like to happen). Many homeowners in California have purchased earthquake insurance after personally experiencing a severe earthquake, even though most responded (correctly) on a survey that the likelihood of another dangerous quake was lower now that stress on the local geologic fault had been reduced.
The Fallacy of Control is an extant gap in logical thinking that in part derives from the belief that we have much more ability to shape events that happen to us than we actually do. That part of the logical flaw is called fundamental attribution error, the tendency to assume that the actions of others are intentional rather than the product of randomness.
After the infamous terrorist attacks of 11 September 2001, for example, how many people traveled by car to prevent themselves from dying in an airline crash — only to die in automobile accident? It turns out that a sobering 725 more people died that way in the three months following the events of that day than would have been expected to do so based on normalized traffic death data. That phenomenon has been attributed to increased driving habits based on misunderstood risk severity in the context of probability data (3).
The Right Tool for the Job
Generally speaking, there is no single best tool for risk assessment. But for the breadth of issues that we can encounter, many tools are at our disposal to help us better analyze and assess our risks. How much we can understand about a particular risk is determined in part by the risk assessment tool we choose to apply to it. In 1958, Heisienberg eloquently put it this way: “We have to remember that what we observe is not nature herself, but nature exposed to our method of questioning.” Across many industries for which I’ve provided support, these are the most frequently used such tools with the highest rates of long-term success: five whys, fishbone diagrams, failure modes and effects analysis (FMEA), and contradiction matrices. They have proven themselves to offer the highest value repeatedly through helping users understand particular risks and allowing development of effective cou
ntermeasures.

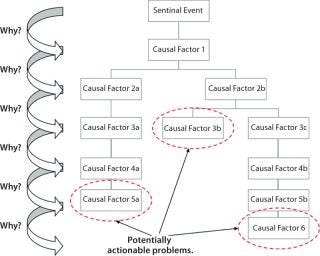
Five Whys is the most basic of root-cause analyses and risk-assessment tools. It is based on the notion of taking a particular risk or risk element and asking “why” it can happen or “how” it would be allowed to happen until a better understanding can be gained from the exercise. The number 5 is arbitrary and has been around since this technique’s initial use because it generally takes several (7 ± 2) iterations to begin to understand underlying causal factors of a risk. That is based somewhat on our human inability to process simultaneous information (4).
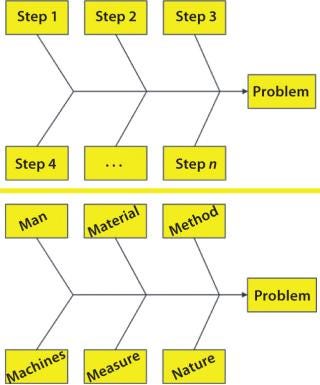
A fishbone diagram, also known as an Ishikawa or cause-and-effect diagram, visually represents the litany of problems that could (individually or collectively) lead to an unwanted effect. Just like the five-whys technique, a fishbone diagram can be used with virtually any sort of problem across any industry or service. It allows teams to find common ground on solutions. Care must be taken with this tool for cases in which more than one failure mode conspires to cause a single effect.

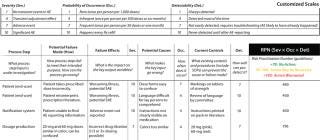
Failure Modes and Effects Analysis (FMEA) is a technique that incorporates some of the best of risk thinking into a formal structure. It usually involves three multipliers — severity (S), probability of occurrence (O), and detectability (D) — the product of which yields a risk priority number (RPN) that can be useful for sorting risks in a business context. Many risk assessments in the pharmaceutical industry involve some form of an FMEA-style analysis, with multipliers and ranked outputs. Be cautioned, however, that not all multipliers that I have seen used for such assessments should be given the same weighting. So a straight multiplication of factors can yield erroneous and inconclusive results. This can also lead to a false sense of confidence in the derived results — the concreteness fallacy, which I discuss further below.
A contradiction matrix, also called “is–is not” analysis, requires that a group understand all characteristics of a potential failure mode and ultimately determine whether the amassed evidence from a given deviation or failure supports one hypothesis over others. I have supported the use of contradiction matrices in legal cases involving forensic data as well as in the pharmaceutical industry. This particular tool depends entirely on the quality of evidence collected and, because of that, conscientious oversight of the data-collection methods is especially important.
Inductive and Deductive Logic
We can’t talk intelligently about assessing risk without understanding the difference between inductive and deductive thinking. Ideally in the scientific method, we do both at different stages. But we may need to choose (or be forced to choose) one or the other in understanding risk based on the direction we are assessing a problem from (a priori vs. a posteriori). Below I briefly point out their differences and the flaws in each one.
We practice inductive reasoning when attempting to generalize a conclusion based on observations or specific instances (a “bottom-up” approach from observations to a general theory). The flaw in doing so comes when insufficient evidence is available to determine a general principle based on a given set of occurrences. Sherlock Holmes actually used inductive thinking in many of his case studies — not deductive reasoning, as he would have had Watson believe.
We practice deductive reasoning when we take a broad hypothesis and determine whether it holds true for specific cases (a “top-down” approach from theory to observations). The flaw in deductive reasoning comes from a reliance on the initial premise being correct, and that can never be scientifically proved to be completely true (compare with null hypothesis significance testing).
For contemporary advanced reasoning, induction is thought of as an argument in which the premises make the conclusion likely. Deduction is thought of as an argument in which the premises make a conclusion certain.
We use statistical reasoning in good risk assessment to ascribe our foundation of understanding into the results, as in concepts such as our p values and confidence intervals. If confidence intervals associated with a particular analysis are very wide, then we don’t know much about our state of affairs at all. But we should not fall back into the concreteness fallacy: that because we have an analysis output, we “know” the answer. Instead, we have a parameter estimate complete with a measure of its uncertainty — nothing more, nothing less.
Analyzing the Results
Once we have prioritized risks by filtering them through a tool (or tools), then we can decide how to address them. But before we do that, however, it’s important to note that there are a few self-repeating layers to this process. Within individual risk assessments, we have stratified risks in some ordinal fashion. Then we have the set of risk assessments themselves, which make up their own strata. As we view the results, whether at the individual assessment level or an all-areas view, we need to avoid a few final pitfalls.
Table 1:

Ritualistic Decision Making: The potential is very real (regularly happening throughout many organizations that I’ve seen) for risk assessors to blindly make decisions based on simply a single score or some other such factor. The point of the RPN concept is to distill risks down into a sortable list. However, each area and each assessment is unique, and it can be very difficult (or impossible) to systematically characterize each department’s risks against some abso
lute scale of severity and probabilistic concerns. That is simply due to the nature of business, in which each group considers different things to be “mission critical,” and attributable to how frequently each department might see a given event transpire. Every risk register of sorted risk assessments needs to be carefully evaluated for nuances that should draw the appropriate attention
The illusion of control is closely tied to that notion of ritualistic decision making. Once we have sets and subsets of risk assessments, we should be very careful not to give into the feeling that “everything is under control.” That certainly is not the case. We may well be characterizing our systems, but all we have is a tabulation of relative risks — without solutions. Risks cannot merely be tabulated, but must be actively managed and controlled. Doing so requires smart and proper application of resources.
The concreteness fallacy is important enough to deserve another mention. Simply analyzing, assessing, and tabulating risks for your particular business does not constitute an objective measure. Risk assessment (and risk sciences in general) can work only when care is paid to the context of the risks in an overall system. Your company’s scoring system reflects only the particular relative risks that you’ve chosen to score. Don’t fall into the trap of thinking that everything you’ve scored are all the risks that exist. There’s a difference between the probable extent of risk (PER) and the observable extent of risk (OER). And a score is not the universal arbiter; it is a guide for what to do to reduce your risk. Falling prey to thinking that your numbers have any objective validity and tell the whole story is easy to do. Don’t mistake the map for the territory.
Knowledge Is Power
In the context of our ability to assess risk, apply resources, document all results, and make appropriate decisions (as difficult as all that can be), we should give thought to ICH Q9 (4). The guidance on risk management specifies, “The level of effort, formality, and documentation of the quality risk management process should be commensurate with the level of risk.” Once we have assessed risks and determined a process that includes options to resolve and manage those risks whenever appropriate, then we can decide the level of resources with which to prioritize them. There always will be latent risks: those that we understand are there but that we cannot chase forever. But we need to make sure we’ve classified them correctly. With a good understanding of each of these, we’re in a much better position to speak about the quality of our businesses.
About the Author
Author Details
Dr. Ben Locwin is head of training and development, risk and decision sciences in quality assurance at Lonza Biopharmaceuticals, 1-603-610-4682, [email protected]. He has coached and consulted in a number of industries including pharmaceutical, chemical, food and nutrition, academic, psychological sciences, and forensics.
1.) Reed, DW 2011.Letters in Applied Hydrology, DWRconsult, Wallingford.
2.) Kunreuther, H, and M Useem. 2010.Principles and Challenges for Reducing Risks from Disasters, Pearson Education, Inc, Upper Saddle River.
3.) Blalock, G, V Kadiyali, and DH Simon. 2005.The Impact of 9/11 on Driving Fatalities: The Other Lives Lost to Terrorism, Cornell University, Ithaca.
4.) Miller, GA 1956. The Magical Number Seven, Plus or Minus Two: Some Limits on our Capacity for Processing Information. Psychol. Rev. 63:81-97.
5.) ICH Q9: Quality Risk Management 2006.. US Fed. Reg www.ich.org/fileadmin/Public_Web_Site/ICH_Products/Guidelines/Quality/Q9/Step4/Q9_Guideline.pdf. 71:32105-32106.
6.) Shermer, M 1997.Why People Believe Weird Things: Pseudo-Science, Superstition, and Bogus Notions of Our Time, Henry Holt and Company LLC, New York.
7.) Vanderbilt, T 2009.Traffic: Why We Drive the Way We Do (and What It Says About Us), Vintage Books, New York.
You May Also Like