Using Data and Advanced Analytics to Improve Chromatography and Batch Comparisons
October 15, 2018
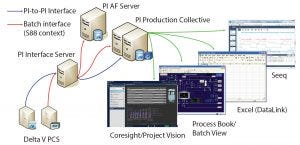
Figure 1: BMS clinical active pharmaceutical ingredient (API) manufacturing scale up: PI infrastructure (Delta V PCS from Emerson), Seeq (Seeq Corporation), Excel (Microsoft), and ProcessBook and Coresight/Project Vision (OSIsoft)
With all the hype surrounding the industrial Internet of Things (IoT), cloud computing, and digital transformations, the most important information technology factors still are data and the connections of sensors, systems, and applications that generate, store, find, and use those data to obtain operational intelligence. Data volumes are increasing rapidly, and they will continue to do so. The ability to find and make sense of data to obtain intelligence that improves process outcomes is more important than ever.
For clinical- and commercial-scale manufacturing in the pharmaceutical and biotechnology industries, just finding the right data to analyze can consume significantly more time than it does to perform analyses. Having the right applications to store and contextualize data is imperative. Obtaining business value by accessing and interpreting those data quickly and effectively can significantly affect decision making and, ultimately, a business’s bottom line.
Here I review how Bristol-Myers Squibb (BMS) leveraged its OSIsoft PI System data infrastructure with the Seeq (Seeq Corporation) advanced analytics application to find, compare, and analyze data for batch processes and scale-up to improve the company’s production efficiencies. Our review is based on discussions with BMS development engineer Robert Forest focused on improving chromatography column packaging and comparing unit operations performance across batches.
BMS stores data in multiple OSIsoft PI and other systems. The company can be challenged in its ability to find data corresponding to specific process conditions, events, and time periods. As a global biopharmaceutical company, BMS has set a goal to apply scientific rigor to produce clinical and economic benefits through medicines that improve patient lives. To enable that, the company needs to provide its scientists and engineers with improved technologies that will help them find and analyze data faster. And doing so would facilitate technology transfer from clinical trials to production-scale processes.
Scale-Up and Technology Transfer Challenges
The goal of BMS’s scale-up group is to develop robust and efficient processes for molecules in the company’s development pipeline. If a molecule proves successful in clinical trials, the group must then transfer those processes to commercial manufacturing. A big part of that process development involves capturing and analyzing data to generate adequate process knowledge that supports both technology transfer and regulatory filings.
Data are captured at a wide range of scales. Activities range from small-scale experiments executed on bench-top laboratory reactors (at gram scale) to large-scale generation of hundreds of kilos of product in large-scale equipment for clinical supplies. Because of the nature of that work, the company has unique challenges regarding data collection. The scale-up group works with a large number of molecules from within the company��’s development portfolio. Bioprocesses made up of many unit operations are unique to each molecule.
BMS continuously improves the processes used to make its drug candidate biomolecules. As a result, whenever scale-up is initiated for a particular molecule, the group may have only limited on-scale experience for the specific process. The company wants to make sure that it has as much data as possible to generate a complete understanding of the scale-up process. Large amounts of data are generated during scale-up, but assembling those data is time consuming, which often hampers data sharing, reuse, and collaboration.
In pilot plants, the company’s DeltaV control systems (Emerson) execute batch recipes. Those systems provide batch data and S88-related context to the OSIsoft PI System infrastructure. BMS users can access and visualize needed information using different PI System tools. These include the PI Vision system (OSIsoft) for process visualization, the ProcessBook system (OSIsoft) for batch views, and the Excel (Microsoft) system for DataLink (OSIsoft) for spreadsheet information (Figure 1).
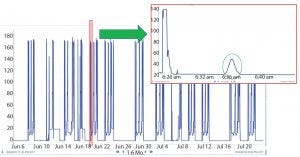
Figure 2: Raw data
Automating Chromatography Column Characterization
In many biopharmaceutical processes, chromatography is an important unit operation. Chromatography columns must be packed uniformly because how they are packed affects product throughput, purity, and yield. BMS performs a conductivity test to help ensure that a column is packed properly and uses the Seeq and PI systems to automate characterization of chromatography column packing homogeneity.
Before implementing the Seeq system, operators performed manual characterization using printouts to calculate symmetry. This tedious process involved measuring conductivity input, creating a step change, and then measuring conductivity output of a column. If the column is packed uniformly, the peak will be uniform. If not, the peak will be asymmetric. An asymmetry ratio was calculated to determine whether the column would adversely affect product quality and thus needed to be repacked.
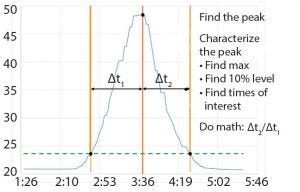
Figure 3: Chromatography column characterization for symmetry
Steps to Calculate Asymmetry Ratio
When BMS operators perform conductivity tests, they use a specific set of flow rates. They set up a search in the Seeq system to find the conductivity peaks automatically (Figure 2). The data are smoothed and filtered, and a derivative calculation is performed. Using the first derivative, peaks are split into left and right halves. That is implemented by setting up a search for derivatives greater than zero for the left half and less than zero for the right half (Figure 3). The 10% ∆t threshold value is found by calculating the range of the peak — from the maximum peak value to a baseline average before the peak. Then, the peak is trimmed between the periods of time when it is greater than the 10% threshold value for each half. The right and left half durations are used to calculate the asymmetry ratio automatically — all performed visually and interactively in Seeq. Next, that value is plotted on a reference curve in PI Vision system to enable visualization of the curve symmetry (Figure 4).
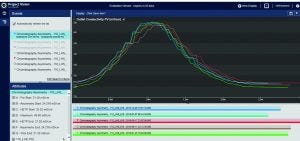
Figure 4: Evaluate and compare (overlay) peaks in PI Project Vision graphical user interface
Tools for Column Packing
Using modern technologies, BMS captures the specialized knowledge needed to test the uniformity of column packing. PI assessment framework (AF) and Seeq systems are used to find the data of interest quickly for conductivity testing to calculate asymmetry, summarize data, and plot curves for expert verification. The Seeq system enables BMS to operationalize its analytics by calculating a critical value (such as asymmetry ratios) and distributing it across the company enterprise. That enables BMS to know when a column was packed correctly, preventing product losses, product quality issues, and even prevent the complete loss of a batch.
Recommendations
The following actions are recommended to help pharmaceutical, biotechnology, and other data-intensive manufacturing organizations transform data into knowledge.
Use analytics to discover patterns, identify performance bottlenecks, prevent abnormal behavior, and enable near–real-time manufacturing simulations.
Use open architectures to help you connect, store, explore, discover, and find the right data quickly.
Use technologies that can store, access, and discover industrial real-time data intelligence easily and quickly.
Use tools that facilitate improved visualization of data, which can provide immense value to companies.
Apply analytics to enable conditions for rapid scale-up from clinical to manufacturing.
Use technologies that have a proven track record, then roll out to other appropriate applications that improve product quality, throughput, and production efficiencies.
Acknowledgments
The author thanks Dr. Robert Forest (development engineer with Bristol-Myers Squibb) and Brian Crandall (principal analytics engineer at Seeq).
Janice Abel is principal consultant at ARC Advisory Group; [email protected].
You May Also Like


