https://bioprocessintl.com/wp-content/uploads/2015/04/032015-Vanderlaan_HamsterPLBL2.mp3
All recombinant protein biotherapeutics must be tested for the presence of residual host-cell protein (HCP) impurities (1–3). The most common analytical method for doing so is a polyclonal sandwich immunoassay. Polyclonal anti-HCP antibodies are selected to recognize the broadest population of HCPs possible. The immunogen and analytical standard are produced from a blank-run fermentation that mimics the production run but lacks the specific biotherapeutic protein. Because of the large number of impurities present in harvested cell-culture fluid (HCCF) that might copurify with the protein of interest, an HCP immunoassay must detect a broad spectrum of proteins. Thus, a limited number of anti-HCP antibodies in the immunoassay reagents will be directed against each particular protein impurity. Moreover, the assay results are immunologically weighted: Highly immunogenic HCPs will be detected more readily than non- or weakly immunogenic HCPs.
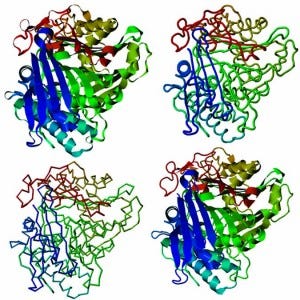
PLBL2 models from PSI, the online protein model portal WWW.PROTEINMODELPORTAL.ORG
During biopharmaceutical production, a single HCP can copurify with a product through the downstream process. By contrast, the HCP immunogen and assay standard contain the thousands of host proteins that could be final-product impurities. Antibodies used in such assays often are affinity purified against the same diverse mixture of proteins as those used in the immunogen. So the relevance of the antibody population and assay standard to a particular product-copurifying impurity might not be optimal. That disconnect makes enzyme-linked immunosorbent assays (ELISAs) only semiquantitative for HCPs.
Typically, a single HCP numerical value is reported for such assay results, representing the ratio of HCPs (ng) to product (mg). That value can reflect a single protein or a collection of several such impurities. Furthermore, if a potentially significant copurifying impurity is nonimmunogenic (or weakly immunogenic), then the assay could miss it. Likewise, if a copurifying impurity is highly immunogenic, the assay could overquantify its value. For these reasons, orthogonal analytical methods often are used to ensure product purity (3).
As noted in the earliest publications on this topic (4), one property of HCP ELISAs is that a particular test sample may not dilute in parallel with the analytical HCP standard used. In that paper, nonlinear sample dilution was ascribed to “antigen excess”: a single or limited number of copurifying HCP impurities saturating available antibodies to that particular protein. As a sample is diluted, the measured dilution-corrected impurity level rises. As the authors note, for cases in which dilution-corrected values eventually plateau, the HCP antigen has been diluted sufficiently to fall within the linear range of the assay for that particular HCP, so the plateau value is reported as an estimate of that impurity level. When no plateau is reached, the value from the most dilute sample is reported, which might be only a minimum estimate of the HCP level.
In theory, if different products show nonlinear dilution behaviors in an HCP ELISA, each product might have its own unique copurifying HCP antigen in excess. However, here we report that the same HCP — phospholipase B-like 2 (PLBL2) — copurifies with multiple Chinese hamster ovary (CHO)-produced antibody therapeutics. In all cases, this impurity manifests as a nonlinear dilution in our CHO protein (CHOP) ELISA.
Materials and Methods
In-Process Pool Samples: All in-process pool samples came from therapeutic humanized monoclonal antibodies (MAbs) currently or formerly in development at Genentech (a member of the Roche group). We named our samples accordingly: MAb 1 served as a negative control, having no detectable CHOP as measured by multiple analytical methods; MAb 2 had extreme dilution-nonlinearity in the platform CHOP ELISA and was investigated further to identify the cause of that nonlinearity (5). Other MAbs had varying levels of nonlinear CHOP dilution.
Development of Antibodies and ELISAs for CHOP and PLBL2: For the CHOP assay, we concentrated HCCF from a culture of nontransfected CHO cells by ultrafiltration, then diafiltered it against phosphate-buffered saline (PBS). We used the resulting mixture of CHO proteins as an immunogen to generate anti-CHOP antibodies and an analytical standard for our assay. Antisera from immunized goats were purified over an affinity column made by immobilizing the immunogen on activated glycerol-controlled pore glass (glyceryl-CPG) from EMD Millipore.
For the PLBL2 MAb-based assay, we immunized mice with CHO- derived PLBL2 (see below) and made hybridomas from their spleen and lymph node cells (6). For further development, we selected a pair of MAbs that were suitable for generating a sandwich ELISA. Transient transfection cultures of CHO cells produced antibodies with cloned mouse immunoglobulin (IgG) genes from the hybridomas, and we affinity purified those antibodies using protein A chromatography. We used one member of the antibody pair as a coating antibody and biotinylated the other for use as a detection antibody.
For the PLBL2 polyclonal antibody-based assay, we immunized rabbits with the CHO-derived PLBL2. The resulting antibodies were affinity purified over a PLBL2 column made by coupling PLBL2 to activated glycerol-CPG. We either used those purified antibodies to coat microplates or conjugated them to horseradish peroxidase (HRP) for use as detection antibodies in the sandwich ELISA.
Using methods that are well- described in literature (7), we formatted a platform CHOP assay as a sandwich ELISA. It’s based on direct conjugation of HRP to the detection antibody, with detection using tetramethylbenzidine (TMB, formulated as SureBlue Reserve from KPL) as a substrate. For this assay, the biotinylated second antibody was detected by streptavidin-HRP followed by washing and TMB substrate.
Purification and Identification of PLBL2 As an Impurity in MAb Products: We purified PLBL2 from final MAb 2 product by first loading a 1-mg sample of product in PBS with 0.05% Tween 20 mobile phase onto a 1.6- to 2.0-mL CHT-1 ceramic hydroxyapatite column from Bio-Rad Laboratories (8, 9). Continued washing with PBS-Tween preceded a step elution with 0.5 M sodium phosphate to remove the antibody from the column. We collected fractions throughout the chromatography process and assayed them with the CHOP ELISA, pooling CHOP- positive fractions for further analysis.
Because the pooled fractions had low concentrations of a potentially sticky protein, we took care to minimize losses on surfaces and filters. Pools were concentrated to 20 μL using Amicon spin filters prewet with sodium-dodecyle sulfate (SDS). Then we added Laemmli sample buffer containing 2% SDS directly to the filters and mixed with a vortex mixer before sample recovery. The entire retentate was transferred to a single lane on an SDS polyacrylamide gel electrophoresis (SDS-PAGE) gel. After resolving that lane by electrophoresis, we stained the results either with SYPRO Ruby fluorescent protein dye or SimplyBlue Safe stain (both from Life Technologies) and rinsed with water before imaging.
As described elsewhere (10), we excised gel bands covering either the entire 30–70 kDa region or discrete, visible bands within that range, then washed those in 25 mM ammonium bicarbonate (Sigma) containing 5% acetonitrile (Burdick and Jackson), followed by 25 mM ammonium bicarbonate in 100 μL of 50:50 acetonitrile:water for 20 minutes before 100% acetonitrile. The in-gel trypsin digestion (0.2 μg, Promega) in 25 mM ammonium bicarbonate at pH 8 was incubated overnight at 37 °C, then arrested by addition of 5 μL of 1% formic acid. We extracted peptides from the gel slices using 0.1% formic acid containing 5% acetonitrile (50 μL) and finally with 50 μL of pure acetonitrile. Extractions were pooled, dried completely, and reconstituted in a volume of 10 μL with 0.1% formic acid.
We injected half the total sample volumes (5 μL) with an autosampler onto a 75-μm × 150-mm Waters column at a 1-μL/min flow rate using a Waters nanoAcquity ultraperformance liquid chromatography (UPLC) system. It applied a gradient from 98% Solvent A (water + 0.1% formic acid) to 80% Solvent B (acetonitrile + 0.08% formic acid) over a 40-minute period. We analyzed the samples on-line using nanospray ionization into a hybrid LTQ-Orbitrap XL mass spectrometer (Thermo Scientific). Data were collected in data-dependent mode with the parent ion analyzed by Fourier- transform mass spectrometry (FTMS), and we selected the eight most abundant ions for fragmentation and analysis with the LTQ instrument. Using the Mascot search algorithm (Matrix Sciences), we analyzed tandem mass spectrometric data against the Uniprot database including peptide sequences from all mammals.
Gene Sequence Primers
Cloning, Expression, and Purification of Hamster PLBL2: Technicians at Blue Heron Biotechnology synthesized and cloned the hamster PLBL2 gene (G3I6T1_ CRIGR) with a C-terminal hexahistidine-tag into a Hoffmann-La Roche proprietary vector. The sequence of the PLBL2 gene was confirmed using the following primers: pRK-F, pRK-R, PLBL2- mid-F, and PLBL2-mid-R (see the “Gene Sequence Primers” box above).
Using standard methods, we transformed One Shot TOP10 chemically competent Escherichia coli cells (Life Technologies) with the pRK5sm–PBLB2 plasmid using standard methods, then selected transformants on Luria broth (LB) agar plates containing 50 μg/mL carbenicillin antibiotic. From an overnight culture of TOP10 cells, we purified the plasmids using a QIAprep spin maxiprep kit (Qiagen). Transient transfections at the 35-L scale were expressed PLBL2 as described elsewhere (11).
We ultrafiltered HCCF tenfold by tangential-flow filtration (TFF) using 10-kDa molecular weight cutoff (MWCO) membranes. The ultrafiltered HCCF was diafiltered against 10 volumes of a PBS-NaCl buffer. Then we applied the resulting material to a Ni-NTA immobilized metal-affinity chromatography column (Qiagen) and eluted with an increasing imidazole gradient. After conditioning the Ni-NTA pool with a buffer containing sodium sulfate, we applied it to an Octyl Sepharose hydrophobic-interaction chromatography (HIC) column from GE Healthcare. The HIC column was eluted with a decreasing sodium sulfate gradient.
We rechromatographed the resulting pool on a Ni-NTA column step-eluted with a high concentration of imidazole, then concentrated the resulting pool using centrifugal filtration units equipped with 10-kDa MWCO membranes (EMD Millipore). The concentrated Ni-NTA rechromatographed pool was formulated on a Superdex 200 size- exclusion chromatography (SEC) column from GE Healthcare. We collected fractions from that column and analyzed them with SDS-PAGE, high-pressure liquid chromatography (HPLC), and standard Western blotting techniques (using antibodies to detect CHOPs and phospholipase B2) to determine purity.
Surface Plasmon Resonance (SPR): To evaluate binding interactions between CHO PLBL2 and intact antibodies or fragments, we used SPR technology on a Biacore T200 instrument from GE Healthcare. Using two different formats ensured that molecules for comparison were kept in the mobile phase as analytes instead of being immobilized as ligands onto sensor chips. All SPR experiments were carried out at 25 °C and corrected against signals from the in-line reference cell and buffer-blank.
With the first format, we evaluated interactions of PLBL2 with various rhuMAbs. Here, anti-hu IgG Fc (GE Healthcare) was covalently immobilized to all four flow cells (FCs) of a Series S CM5 sensor chip (GE Healthcare) to a level of ~6,500 response units (RU). We then used immobilized anti-hu IgG Fc to capture rhuMAbs diluted into HBS-EP+ buffer — 10 mM 4-(2-hydroxyethyl)-1- piperazineethanesulfonic acid, 150 mM sodium chloride, 3 mM ethylenediaminetetraacetic acid, 0.05% polysorbate 20, pH 7.4 — for FC2, FC3, and FC4 to achieve an immobilization level of ~900 RU. FC1 served as an in-line reference cell. With CHO PLBL2 diluted to 1.0 μM in HBS-EP+ buffer subsequently injected into all four FCs at a 50-μL/min flow rate for 60 seconds, dissociation proceeded for three minutes. At the end of each association/dissociation cycle, we regenerated the sensor chip by injecting 3 M magnesium chloride into all four FCs for 30 seconds.
Using the second format, we compared PLBL2 binding interactions with full-length, F(ab)2, and Fc fragments generated from Genovis IdeS enzymatic cleavage of three rhuMAbs in PBS at an enzyme:antibody ratio of 1:200. We incubated the mixture overnight at ambient temperature before affinity purification across MAbSelect Sure protein A and Capto-L protein L resins (both from GE Healthcare) to remove IdeS and undigested MAbs before beginning our SPR studies. Here, CHO PLBL2 was immobilized onto two of the four flow cells (FC2 and FC4) of a Series S CM5 sensor chip using a standard amine coupling and blocking procedure recommended by the manufacturer and ~4,000-RU immobilization levels. We used the two remaining FCs (FC1 and FC3) as in-line references for FC2 and FC4 and treated them similarly (without immobilized proteins) before blocking. We diluted intact antibodies and fragments to 1 μM in HBS-EP+ buffer and ran them over FCs coated with immobilized CHO PLBL2 for five minutes at a 5-μL/min flow rate. In-line reference-corrected responses were reported five seconds before the end of each sample injection. And we regenerated the sensor chip by injecting 10 mM Glycine (pH 2.0) over the immobilized CHO PLBL2 at a 30-μL/min flow rate for 10 seconds.
CHOP ELISA Blocking with Anti- PLBL2 Antibodies: To determine whether PLBL2 was the only CHOP impurity causing nonlinear MAb 2 sample dilution, we assayed in-process pool samples potentially containing both PLBL2 and other CHOP in our PLBL2 ELISA and in our CHOP ELISA. Samples were assayed either neat or after preincubation with rabbit polyclonal anti-PLBL2. Sample dilutions were assayed by CHOP ELISA either neat (undiluted) or after preincubation with rabbit polyclonal anti-PLBL2. In particular, we noted the impact of anti-PLBL2 antibodies on the CHOP ELISA and whether the sample diluted nonlinearly.
Results
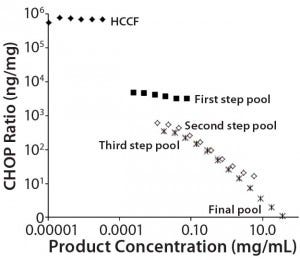
Figure 1: Nonlinear dilution of in-process pool samples for a MAb product in clinical development; twofold dilution series were plotted according to CHOP ratios (ng CHOP/mg product) for samples taken from the initial harvested cell culture fluid (HCCF) and several intermediate downstream purification pools. Pools early in the purification process dilute in parallel to the assay standard (giving dilution- independent CHOP ratio values); later pools show increasing CHOP ratio values as samples are diluted. The only processing between the third step and final pools is an ultrafiltration/ diafiltration (UF/DF) concentration and buffer exchange step.
Black diamonds = HCCF; X = third step pool; Black squares = first step pool; * = final pool; Open squares = second step pool
We used a platform CHOP ELISA to detect CHOP impurities in biopharmaceuticals produced by a relatively harmonized upstream cell culture process. Using a common assay for multiple products makes it possible to identify atypical results in specific clinical candidates. In one such case, we observed an atypical, profoundly nonlinear dilution of samples late in purification. Figure 1 shows the CHOP ratios (ng CHOP/mg product) of twofold serially diluted samples from the initial HCCF and several intermediate purification pools. Those early in the downstream process dilute in parallel with the assay standard (giving dilution-independent CHOP ratio values); later pools show increasing values as samples are diluted.
We calculated the coefficient of variation (CV) for assays at each of those sample dilutions. If the CV was ≤20%, we concluded that differences across dilutions are within acceptable levels of variability for ELISA sample replicates, and the sample was reported as exhibiting no dilution nonlinearity. If the CV is >20% and inspection shows an increasing CHOP level with increasing sample dilution, then a sample was reported to have dilution-dependent behavior. As illustrated in Figure 1, the CV of dilutions for later pools was 155%, well above the cut-off value.
One explanation for nonlinear sample dilution is that a single CHOP is present in excess of available anti- CHOP antibodies (3, 4), so it exceeds the ELISA’s antibody binding capacity. Under such an interpretation, sample dilution to the assay limit gives the most reasonable estimate of the CHOP ratio. For the Figure 1 preparation, we estimated the CHOP ratio in the final product to be ~300 ng/mg.
Because that sample contained an abnormally high level of a potential CHOP impurity in the final purification pool, we investigated it further using an approach described elsewhere (2). This involves capturing the MAb on a chromatographic support, where it is tightly bound, and then collecting flow-through and washes in an effort to isolate the dissociated impurity from the product. The approach is based on the assumption that the reason for impurity copurification is an interaction between it and the MAb product, which must be disrupted for impurity dissociation.
For that reason, we captured our product on a 1-mL CHT column that was washed with PBS-Tween (Figure 2). The UV chromatogram trace shows product elution late in the chromatogram at >150 mM phosphate concentrations. Collected fractions were assayed in the CHOP ELISA (Figure 2a’s trace with diamond marks), with immunoreactive material (eluted early in the chromatogram) well-separated from the product. A small amount of such material coeluted with the product and was not pooled with other immunopositive fractions for subsequent study.
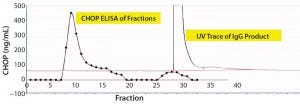
Figure 2a: Chromatographic separation of CHOP impurities from the product; (a) UV trace shows product elution late in the chromatogram at concentrations of phosphate >150 mM. Collected fractions were assayed in the CHOP ELISA (diamonds) and show immunopositive material eluted early in the chromatogram (well-separated from product). A small amount of immunoreactive material coeluted with product and was not included in subsequent studies.
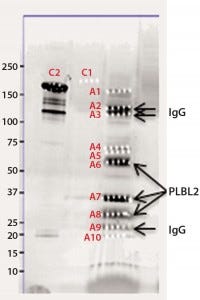
Figure 2b: Chromatographic separation of CHOP impurities from the product; CHOP- positive fractions 8–20 were pooled, concentrated, and analyzed on a sodium- dodecyl sulfate polyacrylamide gel electrophoresis (SDS-PAGE) gel. lane 1 = reference material; lane 2 = ELISA positive fractions
As described above, the CHOP- positive fractions (fractions 8–20) were pooled, concentrated, and analyzed by SDS-PAGE. Sypro Ruby-stained bands were excised, digested with trypsin, and the resulting gel-extracted peptides were sequenced by mass spectrometry. After comparing the peptide sequences with databases of product, CHO proteins, and other mammalian proteins, we identified phospholipase B-like 2 (PLBL2) as the main impurity.
We observed several dye-stained bands (Figure 2b). Although some minor bands were product-related, we identified the three major bands as having homology to hamster PLBL2. Literature on PLBL2 (12, 13) and information from its UniProt entry (Q8NHP8) describes the protein as a mannose-6-phosphate glycosylated lysosomal molecule that is synthesized as a 66-kDa preproenzyme. Under mildly acidic conditions, this enzyme is clipped into two chains that remain strongly associated in native conditions; however, in the presence of SDS and when heated, those chains separate into N- and C-terminal fragments. That explains the three bands on the gel: those two clipped fragments and the full-length protein.
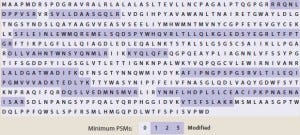
Table 1: SYPRO Ruby stained bands were excised and digested with trypsin; the resulting peptides were analyzed by mass spectrometry. The coverage plot maps identified peptides of PLBL2 to the highest database hit.
Coverage: 195/585 (33%)
Having identified our putative CHOP impurity, we had the PLBL2 gene cloned for transient expression in CHO cells, then purified the results and used them to raise both mouse monoclonal and rabbit polyclonal antibodies. We developed PLBL2- specific ELISAs using those reagents. Both ELISAs gave comparable results across multiple products and intermediate pools. We used the MAb- based ELISA to assess PLBL2 in all our MAb portfolio biotherapeutics, including both commercial products and those in clinical development.
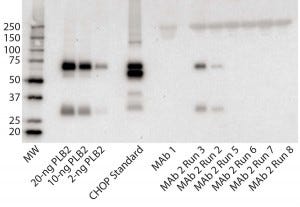
Figure 3: Immunoblot using rabbit polyclonal antisera to PLBL2; (left to right) the lanes correspond to MW standards, a PLBL2 standard at three different protein concentrations, the CHOP standard, MAb 1, and six lots of MAb 2. The first two of those six represent MAb 2 prepared before the protocol was optimized, and the last four came after changes made to reduce PLBL2 levels.
Figure 3 shows an immunoblot using the rabbit polyclonal antisera. In the gel, the PLBL2 standard is visible down to ≥2 ng/lane and shows staining of both the full-length protein and the smaller clipped fragment. The CHOP ELISA standard detected four bands. No anti- PLBL2 reactive bands were detected in a MAb 1 sample, which served as a negative control throughout the study (ELISA PLBL2 ratio in MAb 1 is below the assay’s limit of detection, 0.3 ng/mg). However, the same two bands detected in the PLBL2 standard were detected in two MAb 2 manufacturing runs: PLBL2 ratios of 120 ng/mg for run 2, and 300 ng/mg for run 3. Run 3 corresponds to that shown in Figure 1, which had pronounced nonlinear dilution in the total CHOP ELISA.
We revised the MAb 2 manufacturing process to reduce PLBL2 levels and observed no anti- PLBL2 reactive bands in final-product samples from the resulting updated process. Corresponding ELISA data for those lots showed PLBL2 levels <1 ng/mg. We have found that purification processes can be modified successfully to reduce PLBL2 levels to <1 ng/mg.
Our survey of Genentech commercial biologics showed that PLBL2 is undetectable in Herceptin, Avastin, Perjeta, Rituxan, and Xolair products. However, we did find it as an impurity in several products that are still in clinical development. Nonlinear dilution behavior of samples in the CHOP ELISA often evidenced PLBL2 as the CHOP present in antigen excess. In some cases, the CHOP ELISA showed low CHOP ratio values in the final product (<2 ng/ mg). But PLBL2 was present at similar levels based on PLBL2-specific ELISA results, suggesting that PLBL2 could be the predominant CHOP species even in products with low total CHOP. We implemented purification improvements to reduce PLBL2 levels in all clinical products for which it was detected. Reduction of PLBL2 from MAb 2 pools (Figure 3, Runs 5–8) illustrates the success of those improvement efforts.
We also evaluated fluorogenic synthetic phospholipase substrates (Life Technologies) to determine to determine whether the enzyme was active but found no enzymatic activity with those substrates for either our purified PLBL2 or MAb biotherapeutic in-process samples. Additionally, although PLBL2 is suspected to have enzymatic activity, no associated substrates have been published (14). If the protein is enzymatically active, then its substrate remains unidentified.
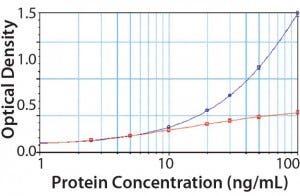
Figure 4: PLBL2 assayed in the platform enzyme-linked immunosorbent assay (ELISA) for CHOP; at low levels, PLBL2 recovery is near 100%. As PLBL2 levels increase, the assay response does not similarly increase, which is consistent with the interpretation that only a limited number of antibodies is available to bind PLBL2. Here, “antigen excess” is expected to lead to nonlinear dilution in samples containing >10 ng/mL of PLBL2.
We spiked purified PLBL2 into the CHOP ELISA (Figure 4). At low concentrations (<10 ng/mL), the CHOP assay accurately quantifies PLBL2 spikes. Increasing concentration of PLBL2 decreases spike recovery consistent with saturation of the anti-PLBL2 antibodies in the overall CHOP ELISA. The most accurate PLBL2 estimate (using only the CHOP ELISA) occurs when a sample is diluted to near an assay’s quantitation limit. That supports the “antigen- excess” hypothesis as the cause of sample dilution nonlinearity in the CHOP ELISA.
To further establish a connection between nonlinear dilution of samples and PLBL2 as the causative impurity, we incubated in-process pools with a tenfold molar excess of rabbit anti- PLBL2 before ELISA testing. With that pretreatment (designed to coat PLBL2 in the samples with antibodies), PLBL2 binding was completely blocked in the PLBL2 ELISA. In the CHOP ELISA, samples diluted linearly with a low CHOP value (<1 ng/mg). That result showed that all the previously observed nonlinearity could be explained by PLBL2 in the sample.
Using the PLBL2-specific ELISA, we assessed PLBL2 levels in HCCF from a number of production cell cultures and blank-run cultures. Levels varied widely among production runs (Figure 5). For many MAbs, we measured several HCCF samples for different production cultures, and the bar graphs show their minimum (solid bar) and maximum (hashed bar) values. With a median PLBL2 level of 2.5 μg/mL, values ranged 0.76–7.7 μg/mL. If expressed relative to the total CHOP content of the HCCF, PLBL2 content ranged 0.16%–1.2% of the CHOP, with a median value of 0.37%. Levels range over about an order of magnitude across cultures.

Figure 5: Levels of PLBL2 in HCCF samples displayed as μg/mL (left) and percentage of the total CHOP (right) from 13 different MAb products; for cases in which multiple independent production cultures were measured for the same MAb, the solid bar shows the lowest observed value, and the stippled bar shows the highest observed value. Wide variation among cultures in PLBL2 levels is shown by absolute μg/mL and as relative percentage of the total CHOP.
Previous studies on MAb biotherapeutics have shown that the biggest influence on CHOP level in protein A pools is the antibody rather than nonspecific binding to the chromatography media (15). So potentially small differences in antibody sequence might greatly influence CHOP interactions with the antibodies. In an effort to understand why CHO-derived PLBL2 copurifies with only some MAbs, we conducted two more studies.
First, we used SPR to look for PLBL2–antibody (or antibody fragment) interactions (Figure 6). This demonstrated interactions between immobilized MAbs and PLBL2 and vice versa. However, measuring such interactions required micromolar levels of PLBL2 in the mobile phase. The binding was readily reversible, with a return to baseline in minutes. These observations suggest that the binding interaction is relatively weak, and only high MAb concentrations during purification processes allow these impurities to be carried along.
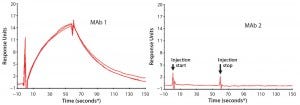
Figure 6: Representative surface plasmon resonance (SPR) sensograms showing reversible binding between 1 μM PLBL2 and immobilized MAb biotherapeutics; (left) MAb 1, with which PLBL2 tends to copurify, shows positive binding. Multiple traces in the MAb 1 panel show measurement reproducibility with independent MAb 1 preparations (lots), each of which was made with the new process and is free of copurifying PLBL2. But the positive interaction of PLBL2 and the antibody remains a property of the antibody. (right) MAb 1, with which PLBL2 does not copurify, does not respond in the sensogram, showing that this antibody does not exhibit the PLBL2 binding properties of MAb 2. (* sample start)
Further SPR studies showed that PLBL2 was interacting with the F(ab′)2 portion of the MAb rather than its Fc region (Figure 7). MAb 1 served as the negative control, and MAb 2 was the positive antibody. These results show that most of the SPR signal is derived from the F(ab′)2 fragment. MAb 6 had a very weakly positive SPR signal to both the intact molecule and its F(ab′)2 fragment.
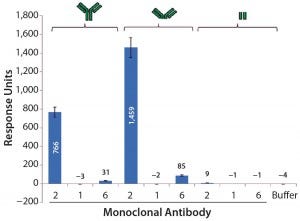
Figure 7: Average SPR binding levels for 1 μM of antibody and antibody fragments to immobilized CHO PLBL2 — the first three bars show the binding response values of intact MAbs; the next three bars show binding response values of the F(ab’)2 fragments of those MAbs; the final three bars show binding response values of their Fc portions. Reference flow-cell subtracted binding response values of samples to immobilized CHO PLBL2 were reported as the response five seconds before the end of each injection. Data are reported as average values, and error bars represent standard deviations of four experimental replicates.
Finally, we assessed whether other CHOP ELISA antibody preparations — both those from commercial kits and developed in-house — were responsive to PLBL2. In some cases, PLBL2 detection was low or nonexistent with those antibody preparations (data not shown). Thus, some CHOP ELISAs might be insensitive to this particular impurity. If the ELISA reagents are insensitive to PLBL2, then samples shown to have low CHOP values might yet contain high levels of this impurity.
Discussion
PLBL2 may be a relatively common and potentially overlooked HCP impurity in therapeutic MAbs produced by CHO cultures. In our case, HCP ELISA dilution nonlinearity was not an assay artifact; it was a consequence of antigen excess and reflected the need to dilute samples “into the range of the assay” so there would be sufficient antibody to capture and detect the HCP impurity. It is important, therefore, to test samples for HCP impurities at multiple dilutions. Nonlinear responses should be investigated because they may indicate the presence of a single or limited number of HCP species that can copurify with product and might be present in large amounts.
Identification of sample dilution nonlinearity thus is an important signal that an HCP may be present in antigen excess. Our description of the antigen- excess phenomenon and associated nonlinearity is not new. It was detailed in the first paper that described an ELISA for HCPs— in that case for E. coli proteins in recombinant human growth hormone (4).
Although the nonlinearity observed in our CHOP ELISA for multiple different products could have resulted from multiple, different CHOP species, our results show that a single CHOP had independently copurified with multiple antibodies. Several teams have put forth the “hitchhiker impurities” idea that major HCP impurities in final therapeutic products are there because they bind to the product (15–20). Sisodiya et al. found that antibody–CHOP interactions contributed significantly to carrying CHOP along in the recovery process and observed significant differences between antibodies in their interactions with CHOP (15).
Those observations have been confirmed with PLBL2 as a specific CHOP. It appears to copurify based on an association with the Fab′2 portion of particular antibodies. Also, the probability that PLBL2 will copurify with a given antibody may depend on the particular clone selected for production. CHO cells are heterogeneous in PLBL2 expression levels, as illustrated by the production cultures whose HCCF PLBL2 levels differ by over tenfold. Similarly, PLBL2 levels in blank runs vary, so anti-CHOP antibody preparations produced in response to those blank- run immunogens also could differ in their ability to detect PLBL2.
Initially, we evaluated a commercial ELISA test kit for hamster PLBL2 from Cusio Bio in China. However, the kit did not react with our purified PLBL2 standard, making it unsuitable for use in establishing product impurity levels. We are unaware of any other commercially available kits or reagents for detection of hamster PLBL2, so we developed our own immunoassays.
PLBL2 was originally described in a study that screened for proteins containing mannose-6-phosphate. In both published literature and our own experience, the two PLBL2 constituent peptides remain closely associated after acid hydrolysis. Denaturing conditions are required to dissociate those fragments. Consistency between our two PLBL2-specific ELISAs (one based on a pair of mouse MAbs and one based on rabbit polyclonal antibodies) supports the idea that the whole protein copurifies with recombinant therapeutics. We have observed no cases in which only the N-terminal or C-terminal peptides were present, nor any case in which one or the other fragment was in excess.
Phospholipases exist widely in nature and can be found in bee, spider, and snake venoms as well as in bacteria. However, nonmammalian species have distinct genes and share low sequence homology with mammalian PLBL2. In particular, although a phospholipase has been found to be a virulence factor in fungi, and infected humans have generated antibodies to this enzyme (21, 22), that molecule is unrelated to PLBL2. The natural substrate for PLBL2 is as yet unreported, but it may be an arylamidase (14). Synthetic substrates used to measure bacterial phospholipases were not hydrolyzed by our purified recombinant hamster PLBL2.
One primary concern about HCP impurities is their potential to be immunogenic. As foreign proteins, they might elicit an immune response in exposed patients (23, 24). Hamster PLBL2 has ~80% amino acid sequence identity with its human ortholog, and many of their differences are surface-exposed residues. Given the multiple amino-acid differences between human and hamster PLBL2, it is reasonable to assume that PLBL2 would be immunogenic in humans. So for patient safety, PLBL2 levels should be reduced as much as practically possible in recombinant biotherapeutics (25).
We have no reason to think that our observations are unique to Genentech CHO cells or the Genentech production process. It is possible that PLBL2 is a frequent impurity in CHO-derived MAb biotherapeutics across the industry. It is also possible that widely used commercial CHOP ELISAs do not detect this impurity, or they could significantly underreport its presence.
We have instituted process changes to reduce PLBL2 levels in all our MAb products. As illustrated herein for one product, it is possible to reduce PLBL2 to levels near or <1 ng/mg. We reduced patient risk with a combination of a sensitive assay for PLBL2 and implementation of PLBL2- reducing process changes.
References
1 Tscheliessnig AL, et al. Host Cell Protein Analysis in Therapeutic Protein Bioprocessing: Methods and Applications. Biotechnol. J. 8(6) 2013: 655–670.
2 Wang X, Hunter AK, Mozier NM. Host Cell Proteins in Biologics Development: Identification, Quantitation, and Risk Assessment. Biotechnol. Bioeng. 103(3) 2009: 446–458.
3 Zhu-Shimoni J, et al. Host Cell Protein Testing By ELISAs and the Use of Orthogonal Methods. Biotechnol. Bioeng. 111(12) 2014: 2367–2379.
4 Anicetti VR, et al. Immunoassay for the Detection of E. coli Proteins in Recombinant DNA Derived Human Growth Hormone. J. Immunol. Meth. 91(2) 1986: 213–224.
5 Corren, J, et al. Lebrikizumab Treatment in Adults with Asthma. New England J. Med. 365(12) 2011: 1088–1098.
6 McCullogh KC, Spier RE. Monoclonal Antibodies in Biotechnology. Cambridge University Press: New York, NY, 2009.
7 Wild D. The Immunoassay Handbook: Theory and Applications of Ligand Binding, ELISA, and Related Techniques, Fourth Edition. Elsevier Science: Oxford, UK, 2013.
8 Gagnon P, et al. A Ceramic Hydroxyapatite-Based Purification Platform: Simultaneous Removal of Leached Protein A, Aggregates, DNA, and Endotoxins from MAbs. BioProcess Int. 4(2) 2006: 50–60.
9 Stanker LH, Vanderlaan M, Juarez-Salinas H. One-Step Purification of Mouse Monoclonal Antibodies from Ascites Fluid By Hydroxylapatite Chromatography. J. Immunol. Meth. 76(1) 1985: 157–169.
10 Champion KM, et al. Comparison of the Escherichia coli Proteomes for Recombinant Human Growth Hormone Producing and Nonproducing Fermentations. Proteomics 3(7) 2003: 1365–1373.
11 Wong AW, Baginski TK, Reilly DE. Enhancement of DNA Uptake in FUT8-Deleted CHO Cells for Transient Production of Afucosylated Antibodies. Biotechnol. Bioeng. 106(5) 2010: 751–763.
12 Deuschl F, et al. Molecular Characterization of the Hypothetical 66.3-kDa Protein in Mouse: Lysosomal Targeting, Glycosylation, Processing, and Tissue Distribution. FEBS Lett. 580(24) 2006: 5747–5752.
13 Lakomek K, et l. Initial Insight into the Function of the Lysosomal 66.3 Kda Protein from Mouse By Means of X-Ray Crystallography. BMC Struct. Biol. 9, 2009: 56.
14 Repo H, et al. Is the Bovine Lysosomal Phospholipase B-Like Protein an Amidase? Proteins 82(2) 2014: 300–311.
15 Sisodiya VN, et al. Studying Host Cell Protein Interactions with Monoclonal Antibodies Using High-Throughput Protein A Chromatography. Biotechnol. J. 7(10) 2012: 1233–1241.
16 Hunter AK, et al. Separation of Product Associating E. coli Host Cell Proteins OppA and DppA from Recombinant Apolipoprotein A-I(Milano) in an Industrial HIC Unit Operation. Biotechnol. Progr. 25(2) 2009: 446–453.
17 Levy NE, et al. Identification and Characterization of Host Cell Protein Product-Associated Impurities in Monoclonal Antibody Bioprocessing. Biotechnol. Bioeng. 111(5) 2014: 904–912.
18 Nogal B, Chhiba K, Emery JC. Select Host Cell Proteins Coelute with Monoclonal Antibodies in Protein A Chromatography. Biotechnol. Progr. 28(2) 2012: 454–458.
19 Wilson MR, Easterbrook-Smith SB. Clusterin Binds By a Multivalent Mechanism to the Fc and Fab Regions of IgG. Biochim. Biophys. Acta. 1159(3) 1992: 319–326.
20 Zhang Q, et al. Comprehensive Tracking of Host Cell Proteins During Monoclonal Antibody Purifications Using Mass Spectrometry. MAbs 6(3) 2014:659–670.
21 Chen SC, et al. Purification and Characterization of Secretory Phospholipase B, Lysophospholipase, and Lysophospholipase/ Transacylase from a Virulent Strain of the Pathogenic Fungus Cryptococcus neoformans. Biochem. J. 347(2) 2000: 431–439.
22 Santangelo RT, et al. Detection of Antibodies to Phospholipase B in Patients Infected with Cryptococcus Neoformans By Enzyme-Linked Immunosorbent Assay (ELISA). Med. Mycol. 43(4) 2005: 335–341.
23 Bailey-Kellogg C, et al. CHOPPI: A Web Tool for the Analysis of Immunogenicity Risk from Host Cell Proteins in CHO-Based Protein Production. Biotechnol. Bioeng. 111(11) 2014: 2170–2182.
24 Rosenberg AS, Worobec A. Immunogenicity Concerns of Therapeutic Protein Products, Part 2: Considering Host- Specific and Product-Specific Factors Impacting Immunogenicity. BioPharm Int. December 2004.
25 Koren E, et al. Recommendations on Risk-Based Strategies for Detection and Characterization of Antibodies Against Biotechnology Products. J. Immunol. Meth. 333(1–2) 2008: 1–9.
Corresponding author Martin Vanderlaan is in analytical operations at Genentech (a Member of the Roche Group), 1 DNA Way, South San Francisco, CA 94080; 1-650-225- 4439, fax 1-650-225-5695; [email protected]. Julie Nishihara, George Tsui, Margaret Lin, Feny Gunawan, Sara Parker, Robert Ming Wong, Karthik Veeravalli, Patrick McKay, Chris Yu, Lori O’Connell, Benjamin Tran, Chris Fong, Judith Zhu- Shimoni, and Denise Krawitz are in technical development; Wendy Sandoval, Peter Liu, and Rajesh Vij are in research; Justin Low, Xiangdan Wang, Jihong Yang, and Valerie Quarmby are in development sciences; and Kathleen Francissen is in CMC regulatory — all at Genentech, as well.


