Maximizing Data Collection and Analysis During Preformulation of Biotherapeutic Proteins
Preformulation research, a critical component in the development of biotherapeutics, explores the effects of variables such as pH, ionic strength, and excipients on the solution behavior of a protein. This activity can greatly assist in guiding downstream formulation development, and it provides valuable information concerning protein stability, solubility, and structure. Successful preformulation research leads to identification of potential protein degradation pathways and development of robust formulations with acceptable product shelf-lives.
PRODUCT FOCUS: PROTEINS
PROCESS FOCUS: DOWNSTREAM PROCESSING, FORMULATION
WHO SHOULD READ: FORMULATIONS, MANUFACTURING, PROCESS ENGINEERING, AND ANALYTICAL PERSONNEL
KEYWORDS: AGGREGATION, PROTEIN UNFOLDING, DATA ANALYSIS, STABILITY
LEVEL: INTERMEDIATE
The potential impact of preformulation research is not limited to merely guiding formulation development. By identifying conditions that best preserve the integrity of the molecule, a working knowledge of the protein stability under a range of solution conditions also can aide in purification/process development. Thus, the earlier preformulation research studies can be performed during product development, the greater the potential benefits that may be realized.
Several potential obstacles to preformulation research may preclude the results of such studies providing maximal benefits. First, the allowable period for preformulation research must be in line with the overall program objectives and timeline. The timeframe may be curtailed if a project timeline is particularly aggressive. Second, given that the samples used initially in preformulation research should be obtained very early during process development, the amount of sample available can be very limited (e.g., low milligram quantities). To maximize the benefits of preformulation research, such studies should minimally reflect three basic requirements: to be performed quickly and with minimal amounts of material, to provide a robust overview of the solution behavior of a molecule, and to be understood by collaborators who are not necessarily familiar with the tools used during preformulation research.
Reducing Sample Requirements and Improving Throughput
Preformulation studies are most helpful when they are initiated as early as possible in product/process development, which is unfortunately when material for analysis is often in short supply. Spectroscopy provides a means to obtain information concerning structure and stability using a very small amount of protein (1). For example, far-ultraviolet circular dichroism (far-UV CD) experiments provide detailed information on the content of secondary structural elements in a protein and can require as little as 20 µg of protein (2, 3). Intrinsic fluorescence experiments can require even less protein (5-20 µg) to probe tertiary structure in a molecule (4, 5). Other biophysical techniques (e.g., near-UV CD, second-derivative absorbance spectroscopy, and analytical ultracentrifugation) can provide further insights into the tertiary and quaternary structure of a protein (6, 7).

Figure 1:
WWW.PHOTOS.COM
Accelerated stability studies are a frequently used tool in the initial evaluation of protein stability. For example, after short-term incubation of a solution at elevated temperatures, the effects on protein properties such as bioactivity and purity may be assessed. For an even more immediate assessment of protein stability, differential scanning calorimetry (DSC) experiments can be performed to obtain a melting temperature (Tm) and other thermodynamic values such as the amount of heat absorbed/emitted by a reaction (ΔH) and change in heat capacity (ΔCp) of protein unfolding under a range of formulation conditions. These thermodynamic parameters may be good predictors of which conditions will provide for long term real-time stability (8).
Acid α-glucosidase is a lysosomal enzyme involved in the catabolism of glycogen (9,10,11). To illustrate one application of preformulation research, we evaluated the solution behavior of the 110-kDa form of recombinant human acid α-glucosidase (rhGAA) as a function of pH using several spectroscopic techniques and analyzed the results using a thermodynamic approach. Using thermodynamics is very advantageous in comparing the stability of molecules in different formulation conditions. Specifically, the derivation of thermodynamic parameters from spectroscopic unfolding data, be it thermally or chemically induced, has been well defined and understood for many decades and thus provides a robust assessment of protein stability (12, 13).
Thermodynamic parameters describing the solution behavior of a protein are quantitative measures that can be used to compare the stability of a protein as probed by different methods. This is essential because different spectroscopic methods monitor different aspects of protein structure (e.g., far-UV CD monitors secondary structure) as unfolding occurs. The disruption of structure that each technique monitors does not have to occur simultaneously. For example, the classic signature for an intermediate present upon unfolding is that the unfolding curve derived from secondary structure unfolding does not overlay with that resulting from the denaturation of tertiary structure. As such, reconciling results gained from different techniques is not a simple exercise. However, the use of thermodynamics allows for such behavior to be identified and for global analysis to be performed, providing a single set of parameters that describes the entire unfolding of a protein even with more complex aspects such as oligomerization or the presence of an intermediate.
The CD spectrum of rhGAA (Figure 1) contains one broad, negative peak with a shoulder at 230 nm and a minimum that extends from 210 nm to 220 nm at 20 °C in 25 mM sodium phosphate (pH 7.0) as measured at a protein concentration of 50 µg/mL. The shoulder at 230 nm is most likely reflective of an aromatic-aromatic interaction, thus providing a tertiary probe. Notably, this spectrum does not resemble either the characteristic spectrum for a protein with mostly α-helical structure, which shows dual minima at 222 nm and 208 nm, or mostly β-sheet topology, which shows a single minimum around 216 nm (2, 3). Thus, it is quite likely that rhGAA contains a mixture of both elements. These results indicate that far-UV CD is a particularly valuable technique for monitoring rhGAA unfolding because it probes both secondary structure (210-225 nm wavelengths) and tertiary structure (wavelengths ∼230 nm).
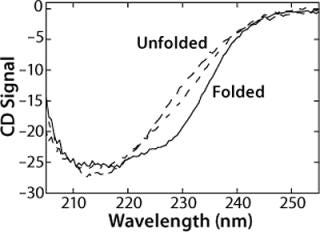
Figure 1: ()
We monitored the thermal unfolding of rhGAA with far-UV CD spectroscopy in an effort to obtain apparent thermodynamic parameters describing the process (Figure 1). As temperature increases, the shoulder at 230 nm is greatly reduced in signal. Meanwhile, the very broad 210-220 nm minimum becomes much sharper, and a defined minimum at 214 nm becomes apparent. There is also an increase in signal between 210 nm and 220 nm. An isochromatic point is seen at 220 nm, implying that a two-state unfolding transition could be appropriate to model the behavior of rhGAA as a function of thermal perturbations. These thermal melts were repeated at pH 4-8 in 25 mM sodium phosphate, so pH was the only variable that changed. Additionally, the same general trend was seen for changes in the far-UV CD spectrum upon thermal unfolding at all pH values.
Assessing Solution Behavior By Maximizing Data Analysis
With constraints on both the time-frame for preformulation research and the amount of sample available to perform these studies, often the number of experiments that can be performed is limited. Thus, not only is the choice of analytic technique of great importance, but maximizing the use of data collected is also crucial to ensure a robust assessment of a molecule’s solution behavior.
Singular-value decomposition (SVD) analysis is a mathematical method used to fit a large set of data quickly and to guide data fitting by revealing the number of distinct spectroscopic species present during an unfolding experiment (14). We have found this approach to be very valuable. SVD analysis breaks data down into a minimum number of independent basis vectors. Each vector has its own spectrum and temperature dependence. These basis vectors are used to create a composite matrix in which three matrices are contained (14, 15). The matrices represent the signal dependence on temperature, wavelength, and the weights of the basis spectra.
SVD analysis offers some great advantages over typical methods of analyzing unfolding data. Usually, when unfolding data are obtained, the wavelength of maximum change is identified and the signal at that wavelength plotted as a function of temperature. In the case of rhGAA, that wavelength would be 230 nm. SVD analysis allows for all wavelength data to be analyzed simultaneously. The vector relating signal dependence to temperature is a composite representing the unfolding curves generated at all wavelengths in the far-UV CD spectrum. This is beneficial for cases in which a single experimental spectrum monitors more than one unfolding response, such as the rhGAA unfolding as monitored by far-UV CD following both the disruption of secondary and tertiary structure. A single unfolding vector describes both processes. Additionally, the SVD vector provides an improved signal-to-noise ratio, which lends itself to more reliable data fitting for determination of thermodynamic parameters during preformulation (Figure 2A and 2B). This is an appropriate strategy for preformulation research given constraints that may limit the number of experiments that can be run. Hence, SVD analysis allows rapid analysis of a large amount of data obtained from a single experiment.
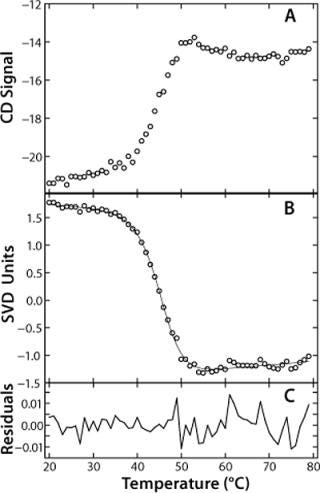
Figure 2: ()
Additionally, SVD analysis is model-independent and can actually be used to assist in deciding which equilibrium model is appropriate to fit a given set of data. The wavelength vector reveals the number of distinct spectroscopic states populated during thermal unfolding. In the case of rhGAA, just two distinct spectroscopic species are revealed, indicating that a simple two-state model is sufficient to describe the thermal unfolding. Secondary and tertiary structures are thus being disrupted the same way. Should an intermediate be populated during unfolding, then three distinct spectroscopic species would be observed, and appropriate unfolding models could be designed to incorporate them. This feature of SVD analysis also makes it an attractive preformulation tool. Determining the proper thermodynamic model to fit unfolding data is often very difficult. SVD analysis provides valuable insight into the existence of intermediates and can thus determine what, if any, additional experiments need to be conducted. This approach helps in mitigating the limitations of small amounts of protein for analysis available for a limited number of experiments.
In the case of rhGAA, we determined apparent thermodynamic parameters by fitting the SVD unfolding curve to a two-state model, Native↔Nonnative (Figure 2B). This fitting provided values for the ΔHapp, Tmapp and ΔCpapp for the thermal unfolding of rhGAA at a given pH.
This model yields a good data fit, confirmed by the randomness of the residuals in Figure 2C. We conducted thermal unfolding experiments at a pH range of 4-8 to gain an understanding of how this protein’s stability depends on pH. These fits provided apparent thermodynamic parameters that showed rhGAA is most thermodynamically stable between pH 5 and 6 (Figure 3), as noted by the highest ΔHapp and Tmappvalues within this range.
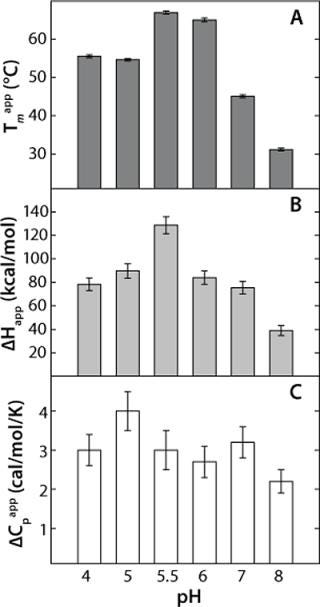
Figure 3: ()
These data also illustrate the relationship between obtaining Tm values from thermal denaturation monitored by spectroscopic experiments and using differential scanning calorimetry. Table 1 shows the Tm values from a similar pH study conducted with DSC, which identified pH 5.5 as having the highest Tm within the pH range tested. However, the Tm values determined by DSC are higher than those determined from spectroscopy experiments because of the well-known scan-rate dependence of such measurements. DSC experiments in these examples were conducted at scan rates of 30 °C/hour and 200 °C/hour, whereas spectroscopy experiments are performed at much lower scan rates in the range of 5-10 °C/hr (Figure 3). Because of the kinetics of unfolding, that often leads to a lower value for Tm monitored by spectroscopy. However, the general trend is the same for both techniques, so the pH of maximum Tm can be determined by either one.
Table 1: Apparent melting temperatures (Tmapp) of rhGAA (1 mg/mL) in 25 mM sodium phosphate as a function of pH as determined by differential scanning calorimetry (DSC)
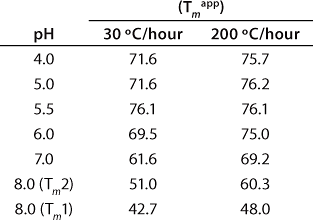
Table 1: Ap
It should be noted that the thermal unfolding of rhGAA is irreversible. Thus, the thermodynamic parameters describing this process need to be qualified as apparent values. In preformulation development, however, comparative numbers are extremely valuable for guiding downstream development. So even though the parameters determined in this study are not true thermodynamic values, their role in preformulation development is still very useful.
Communicating Complex Analyses Simply
Describing the complexities inherent in analyzing spectroscopic data and determining thermodynamic parameters often creates an obstacle to maximizing the impact of preformulation studies. It may be an unreasonable expectation for individuals outside the protein characterization and formulation groups to have an up-to-date and thorough understanding of protein biophysical tools. Furthermore, communicating how such biophysical analyses are performed — and the implications of the calculated thermodynamic parameters describing protein stability — to those who do not regularly use them can be challenging.
To facilitate communication of these apparent thermodynamic data, we have developed a simple, graphical tool termed a “transition plot.” To construct one, Fapp models are determined for each condition at which denaturation experiments have been performed (at each pH value for the rhGAA example). Fapp plots show the fraction of unfolded protein present as a function of temperature and are calculated using thermodynamic parameters determined from the unfolding experiments (16, 17). The Fapp plots are then used to construct a three-dimensional contour plot with the formulation variable of interest (pH in this example) plotted on the x axis, temperature plotted on the y axis, and the z axis representing the fraction of unfolded protein. To further simplify this graphical tool, colors are assigned to various regions of the contour to highlight conditions at which the protein is mainly folded or unfolded and to better visualize the transition between the two states.
In the case of rhGAA, Fapp plots were generated using the apparent thermodynamic parameters previously determined by fitting the SVD thermal unfolding data to a two-state model (native and nonnative). To do so, the folded and “unfolded” baselines are assumed to have slopes of zero. Because Fapp refers to the apparent fraction of “unfolded” protein, the y intercepts of the baselines are set to zero and one for the folded and “unfolded” baselines, respectively. Fapp is then calculated as a function of temperature at each pH using the thermodynamic parameters for that pH value. Therefore, the transition from native rhGAA (Fapp = 0) to nonnative rhGAA (Fapp = 1) at each pH can be seen. Figure 4 shows the Fapp curves for each pH condition.
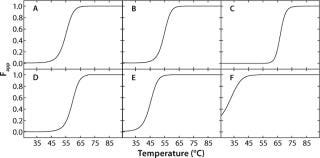
Figure 4: ()
To construct a transition plot for the “unfolding” of rhGAA as a function of temperature and pH, the Fapp values at each pH are plotted in a contour (Figure 5). Rather than use the proximity of lines at defined intervals to illustrate the change from native to nonnative protein, colors are added that correspond to defined states of the protein. Dark blue indicates that >90% of the protein exists in the folded state at equilibrium (Fapp=0.10), and a bright red indicates that =90% of the protein exists in the nonnative state (Fapp=0.90). Green signifies Fapp=0.50, representing the Tmapp at that particular pH value.
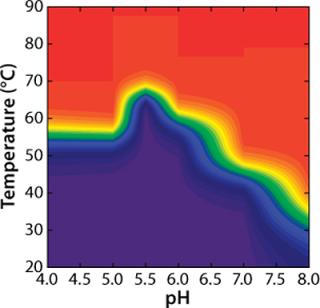
Figure 5: ()
Multiple Uses, Multiple Benefits
As illustrated, transition plots provide a concise graphical tool to illustrate a protein’s solution behavior based on complex thermodynamic analyses. One need not be well versed in protein biophysics and thermodynamics to examine such a plot and identify the conditions under which a protein is highly ordered and likely to be In the case of rhGAA, for example, the transition plot clearly indicates that the pH range at which rhGAA is most stable is 5.0-6.5. When real-time stability studies are conducted on rhGAA, it is observed that at 25 °C the rates of both protein aggregation and loss of enzymatic activity are greatly accelerated outside that pH range (data not shown). Whereas this information is extremely useful for downstream protein formulation work, it can greatly benefit other areas of the bioprocess development, especially purification.
An illustration tool used in the past to summarize/visualize a large amount of biophysical data was the experimental “phase diagram” (18, 19). However, the transition plots described here offer clear advantages in concerted analysis. The main advantages of this approach, namely “transition plots” over the “empirical phase diagrams” discussed elsewhere are
incorporation of single-value decomposition analysis that allows for a concerted data analysis, improving data signal and mitigation of noise and thus reducing the possibility that aberrant spectroscopic signals are interpreted as a distinct thermodynamic species
modeling the data as a function of relevant thermodynamic parameters rather than just representing a large amount of data obtained by different biophysical techniques based on different principles.
It should also be noted that although the rhGAA example used only far-UV CD experiments to illustrate thermal denaturation of the protein, the thermodynamic analysis and transition plot construction shown here is not limited to the use of a single technique. As is usually the case in preformulation research, if results from other biophysical techniques are necessary, then their incorporation into the transition plot construction can be accomplished during data fitting. For example, unfolding curves generated from other spectroscopic techniques (e.g., near-UV CD, second-derivative absorbance spectroscopy, or various fluorescence-based experiments such as intrinsic tryptophan fluorescence or 1-anilino-8-naphthalene-sulfonate (ANS) binding) can be analyzed simultaneously by global fitting routines to yield a single set of thermodynamic parameters from which Fapp curves and transition plots can be constructed.
Extreme caution should be exercised, though, when using any data analysis method that incorporates more than one spectroscopic technique. Such fitting algorithms are very amenable to proteins that unfold reversibly. However, many proteins do not do so because of such factors as their size, complex disulfide-bonding patterns, or posttranslational modifications. These factors also affect the kinetics of unfolding, often causing it to take place over long periods, the effect of which is commonly seen in the scan-rate dependence of DSC thermograms (Table 1). Thus, if unfolding experiments such as thermal denaturation are to be conducted using more than one spectroscopic method, it is imperative that measures be taken such that heating rates, equilibration times once reaching desired temperatures, and data collection times are all exactly the same for different methods.
If that is not done, simultaneously fitting data from different techniques can lead to the erroneous interpretation that distinct states (e.g., intermediates) exist when in reality the differences being observed among techniques leading to this interpretation merely result from differences in the experimental parameters that govern data acquisition for each technique. Thus, although it is sometimes necessary to use multiple techniques to elucidate the existence of intermediates, it is often best to analyze each method individually as well as collectively to ensure that results obtained from the concerted analysis are biophysically appropriate.
Construction of the transition plot for rhGAA illustrates an ideal example showing how this methodology can be used in preformulation research. Each unfolding curve was collected in about six hours and only required ∼50 µg of material. So the entire transition plot for rhGAA requires <0.5 mg of material and only about a week of instrument time to collect the data. Additionally, far-UV CD thermal denaturation experiments for rhGAA provided spectra that contained probes for both secondary and tertiary structure. SVD analysis provided a means to simultaneously fit the data collected at all wavelengths in the far-UV CD experiments, thus providing a robust assessment of the rhGAA's solution behavior and reducing the time required for analysis and data fitting. Finally, incorporation of the data into a transition plot provided a graphical tool to easily convey the complex thermodynamic results from these experiments. This study thus fulfills the requirements for effective preformulation research: It requires minimal amounts of protein and can be done on a short timescale while still providing a robust analysis of the solution behavior of that protein. And it conveys those findings in an easy-to-interpret figure that can assist not only downstream formulation development, but also other research groups whom the information could help.
Although our example is concerned with the effects of pH on protein stability, you can also place increasing ionic strength or the concentration of an excipient on the x axis to graphically illustrate those effects on protein stability. The results can also be used to design real-time accelerated stability studies. Because the transition plot describes thermal boundaries for protein unfolding, a quick examination of it provides guidance so that temperatures used for such studies keep the protein in its native conformation rather than a partially unfolded form that is likely to be more prone to degradation.
Additionally, other responses to physical and chemical stresses can be investigated. For example, aggregation is not reliably quantified by CD or intrinsic fluorescence methods. However, turbidity measurements can be collected as a function of some formulation variable, such as temperature or pH, and plotted on a transition plot. Whereas use of all these techniques may not be feasible during preformulation development, their analysis later during a drug’s development cycle can only add to the understanding of a protein’s solution behavior. Such results illustrate the potentially broad use of this thermodynamic analysis and transition plot construction — and how it could be widely beneficial in a variety of areas in biotherapeutic development.
REFERENCES
1.) Meyer, JD. 2002. Effects of Conformation on the Chemical Stability of Pharmaceutically Relevant Polypeptides. Pharm. Biotechnol. 13:85-107.
2.) Kelly, SM. 2005. How to Study Proteins By Circular Dichroism. Biochim. Biophys. Acta 1751:119-139.
3.) Kelly, SM, and NC. Price. 2000. The Use of Circular Dichroism in the Investigation of Protein Structure and Function. Curr. Protein Pept. Sci. 1:349-384.
4.) Jiskoot, W. 1995. Application of Fluorescence Spectroscopy for Determining the Structure and Function of Proteins. Pharm. Biotechnol. 7:1-63.
5.) Royer, CA. 1995. Fluorescence Spectroscopy. Meth. Mol. Biol. 40:65-89.
6.) Laue, TM, and WF. Stafford. 1999. Modern Applications of Analytical Ultracentrifugation. Annu. Rev. Biophys. Biomol. Struct, 28:75-100.
7.) Perez-Ramirez, B, and JJ. Steckert. 2005. Probing Reversible Self-Association of Therapeutic Proteins By Sedimentation Velocity in the Analytical Ultracentrifuge. Meth. Mol. Biol. 308:301-318.
8.) Remmele, RL. 1998. Interleukin-1 Receptor (IL-1R) Liquid Formulation Development Using Differential Scanning Calorimetry. Pharmaceut. Res. 15:200-208.
9.) Hoefsloot, LH. 1988. Primary Structure and Processing of Lysosomal Alpha-Glucosidase: Homology with the Intestinal Sucrase-Isomaltase Complex. Embo J. 7:1697-1704.
10.) Hoefsloot, LH. 1990. Expression and Routing of Human Lysosomal Alpha-Glucosidase in Transiently Transfected Mammalian Cells. Biochem J. 272:485-492.
11.) Wisselaar, HA. 1993. Structural and Functional Changes of Lysosomal Acid Alpha-Glucosidase During Intracellular Transport and Maturation. J. Biol. Chem. 268:2223-2231.
12.) Baldwin, RL, and GD. Rose. 1999. Is Protein Folding Hierarchic? I: Local Structure and Peptide Folding. Trends Biochem. Sci. 24:26-33.
13.) Chen, Y. 2007. Protein Folding: Then and Now. Arch. Biochem. Biophys..
14.) Henry, ER, and J. Hofrichter. 1992. Singular Value Decomposition: Application to Analysis of Experimental Data. Meth. Enzymol. 210:129-192.
15.) Ionescu, RM. 2000. Multistate Equilibrium Unfolding of Escherichia coli Dihydrofolate Reductase: Thermodynamic and Spectroscopic Description of the Native, Intermediate, and Unfolded Ensembles. Biochem. 39:9540-9550.
16.) Gloss, LM, and CR. Matthews. 1997. Urea and Thermal Equilibrium Denaturation Studies on the Dimerization Domain of Escherichia coli Trp Repressor. Biochem. 36:5612-5623.
17.) Simler, BR. 2004. Zinc Binding Drives the Folding and Association of the Homo-Trimeric Gamma-Carbonic Anhydrase from Methanosarcina thermophila. Protein Eng. Des. Sel. 17:285-291.
18.) Kueltzo, LA. 2003. Derivative Absorbance Spectroscopy and Protein Phase Diagrams As Tools for Comprehensive Protein Characterization: A bGCSF Case Study. J. Pharmaceut. Sci. 92:1805-1820.
19.) Rexroad, J. 2006. Thermal Stability of Adenovirus Type 2 As a Function of pH. J. Pharmaceut. Sci. 95:1469-1479.
You May Also Like

