Identifying False Metabolite Measurements During Cell-Culture Monitoring Effective Application of the Multivariate Hotelling’s T2 Statistic

Upstream process scientists and engineers actively monitor bioreactor metabolite levels during cell culture using off-line blood-gas analyzers (BGAs) and related instrumentation. But such tools introduce inherent variability into metabolite measurements. The magnitude of that variability depends on the measurement range.
Mammalian cells are sensitive to concentrations of one such metabolite: dissolved CO2. In cell cultures, CO2 levels often are reported as partial pressure (pCO2) in millimeters of mercury (mmHg). Available literature frequently reports that elevated pCO2 concentrations have adverse impacts on cell health, causing changes in cell metabolism, decreases in cell productivity, and altered glycosylation profiles in expressed therapeutic proteins (1–3). Thus, bioreactor CO2 concentration often is designated as a critical process parameter (CPP) or in-process control (IPC) parameter with action limits of ~50–150 mmHg (typically <120–150 mmHg) to prevent the aforementioned issues.
Multiple factors affect dissolved CO2 concentrations in bioreactors, including pH setpoint, bicarbonate concentration, cell density, and cellular lactate-production rate. Although several methods for controlling pCO2 are applied across the biopharmaceutical industry, the simplest and most frequently used technique is manual feedback control: Dissolved CO2 is measured during cell culture, and if pCO2 levels exceed a threshold value (the action limit), then overall gas-flow rates are increased by a certain amount.
To use manual feedback control, measured pCO2 values must be reliable, and false measurements must be detected before process changes are made to keep pCO2 levels within established limits. Herein, we provide an easy-to-adopt procedure to develop a tool for identifying false pCO2 measurements using Hotelling’s T2 statistic in Microsoft Excel software. For our purposes, we supply values from our company’s monitoring of cell-culture bioreactors (Figure 1).
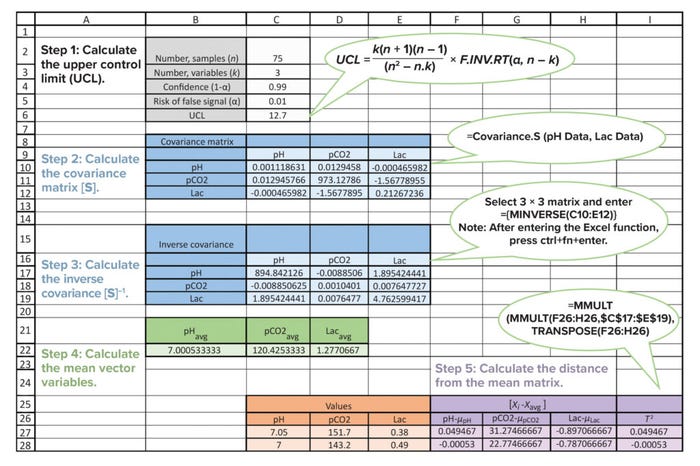
Figure 1: Sample Microsoft Excel sheet illustrating the use of Hotelling’s T2 statistic as a false-measurement identification tool for monitoring dissolved carbon dioxide (measured as pCO2, mmHg) in cell-culture bioreactors; Lac = lactate concentration.
In 1947, Harold Hotelling introduced the T2 statistic for multivariate analysis. Therein, the relationship between two or more interrelated variables is established by blending information from the mean and dispersion across variables from a large sample. The reliability of suspicious data is assessed based on differences from the historical relationship.
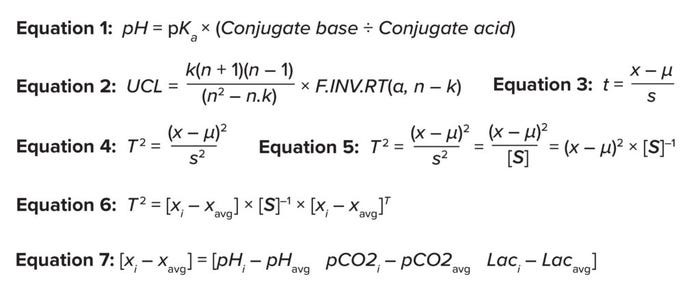
Equations 1–7:
Selecting Interrelated Variables
Assess Medium Chemistry: Based on the Henderson–Hasselbalch equation, in typical culture conditions near neutral pH, culture pH is related to conjugate acids (dissolved CO2 and lactate), conjugate bases (bicarbonate ions), and pKa, an acid-ionization constant for bicarbonate (4) (Equation 1). Therefore, relevant parameters for pCO2 measurement are culture pH, lactate concentration, and bicarbonate-ion concentration. However, because the process under investigation does not consume a variable amount of base titrant across multiple batches, and because the instruments applied (Flex2 gas analyzers from Nova Biomedical) do not measure bicarbonate ions, our selection of related measured variables is reduced to three: pH, lactate concentration, and pCO2.
Filter Outliers: All available sample points for pH, lactate concentration, and pCO2 are screened for outliers, and outliers with known causes are removed. Examples include those attributed to a replacement in sensor cards or reagents in the measuring instrument.
Performing Calculations
Calculate the Upper Control Limit (UCL): Equation 2 shows how to calculate the UCL in cases with three interrelated variables (k = 3) with sample size n. F.INV.RT can be used to return critical values from the F-distribution. The variable α represents the probability of an acceptable error in prediction; a default value of 0.01 is widely accepted.
Calculate the Mean Vector: The mean vector (xavg) of three selected variables is calculated as [pHavg, pCO2avg, and Lacavg], as shown in Figure 1.
Calculate T2: In statistics, when a single variable is under analysis, the
“t ratio” is used to detect any shifts outside the historic trend. The t ratio is that of signal to noise, as shown in Equation 3 (5, 6). The variable x represents the suspicious data point being analyzed to detect a shift from the historical performance, and µ is the historical mean. The expression (x – µ) represents the signal (the distance between the sample and historical mean). The variable s denotes the sample standard deviation. In univariable analysis, s measures data-set dispersion.
As a counterpart of the t ratio in univariate analysis, the T2 value also measures the signal:noise ratio. Here, the signal is measured as the difference between the mean vectors of two or more data sets, and the noise of the data is measured as the covariance.
T2 is obtained by squaring the t ratio, as shown in Equation 4 (5, 6). Therein, s2 represents the variance, and (x – µ)2 is the squared distance from the mean, corresponding to the signal. For multivariable analysis, s2 is replaced by a covariance matrix, [S]. The covariance measures the direction of dispersion of one variable with respect to another in a two-dimensional matric space, as shown in Equation 5. In other words, the covariance measures the signal noise.
Equation 3 can be rewritten by replacing the population mean (µ) with the sample mean (xavg) and applying matrix algebra:
(x – µ)2 = (x – µ) × (x – µ)T
That yields Equation 6, in which [xi – xavg] represents the distance from the mean matrix and [xi – xavg]T is the transpose of the distance from the mean matrix. Therein, matrix [xi] is the group of variables from individual observations [pHi, pCO2i, and Laci] that are being tested for shifts from historical performance.
Then, Equation 7 can be applied to calculate the distance from the mean vector in matrix format. The covariance matrix can be calculated using the Covariance.S Excel function for each combination of variables. The inverse of that matrix can be calculated by applying the MINVERSE function and selecting the covariance matrix.
Finally, the T2 value is calculated in Excel software using the matrix-function formula. Steps for those calculations are displayed in Figure 1.
Determination of False Results
The T2 value calculated for the variables from a suspicious individual observation is compared with the calculated UCL value. If T2 < UCL, then the group of related variables falls within the historical dispersion, and the measured data are confirmed as correct. But if T2 > UCL, then the group of variables falls outside the expected dispersion. Thus, the measured data may be false, and resampling and/or retesting is recommended (5, 6).
Effective Use of the T2 Statistic
Biologics manufacturing is a complex process that sometimes demands simultaneous monitoring of two or more related variables, both to improve process understanding and control and to ensure sufficiently high product quality. When using manual feedback control to manage cell-culture bioreactors, pCO2 is monitored as an IPC parameter, and pCO2 values exceeding a predefined action limit call for a change in bioreactor gassing strategy. The risk of frequent, false pCO2 measurements from a metabolite analyzer necessitates establishment of a detection system.
Our company has devised and verified a system for detecting false pCO2 in-process measurements using multivariate statistics based on Hotelling’s T2 method. This article demonstrates how to apply that method using Microsoft Excel software to determine the need for resampling or retesting. The same concepts can be used to confirm false out-of-expectation (OoE) or out-of-specification (OoS) results when interrelated parameters are identified, again, with the goal of justifying reevaluation of OoE or OoS results.
References
1 Schmelzer AE, Miller WM. Hyperosmotic Stress and Elevated pCO2 Alter Monoclonal Antibody Charge Distribution and Monosaccharide Content. Biotechnol. Prog. 18(2) 2002: 346–353; https://doi.org/10.1021/bp010187d.
2 Brunner M, et al. Elevated pCO2 Affects the Lactate Metabolic Shift in CHO Cell Culture Processes. Eng. Life Sci. 18(3) 2017: 204–214; https://doi.org/10.1002/elsc.201700131.
3 DeZengotita VM, Kimura R, Miller WM. Effects of CO2 and Osmolality on Hybridoma Cells: Growth, Metabolism and Monoclonal Antibody Production. Current Applications of Cell Culture Engineering (Sixth Volume). Betenbaugh MJ, et al., Eds. Springer Science: Dordrecht, the Netherlands, 1998: 213–227; https://doi.org/10.1007/978-94-011-4786-6_22.
4 Clark DS, Blanch HW. Biochemical Engineering (Second Edition). CRC Press: Boca Raton, FL, 1997.
5 Montgomery DC. Statistical Quality Control: A Modern Introduction. John Wiley & Sons: Hoboken, NJ, 2009.
6 NIST/SEMATECH. Engineering Statistics Handbook. US National Institute of Standards and Technology: Gaithersburg, MD, 2012; https://doi.org/10.18434/M32189.
Further Reading
Socolsky C, Whitford WG, Sourabié AM. Deciphering Nutritional Needs in Bioprocess Optimization: Targeted and Untargeted Metabolomics with Genome-Scale Modeling. BioProcess Int. 20(10) 2022: 36–43; https://bioprocessintl.com/analytical/upstream-development/deciphering-nutritional-needs-in-bioprocess-optimization-targeted-and-untargeted-metabolomics-with-genome-scale-modeling.
Wei H, Mason J, Spetsieris K. Continued Process Verification: A Multivariate, Data-Driven Modeling Application for Monitoring Raw Materials Used in Biopharmaceutical Manufacturing. BioProcess Int. 21(6) 2023: 22–27; https://bioprocessintl.com/upstream-processing/biochemicals-raw-materials/continued-process-verification-a-multivariate-data-driven-modeling-application-for-monitoring-raw-materials-used-in-biopharmaceutical-manufacturing.
Bower KM. Certain Approaches to Understanding Sources of Bioassay Variability. BioProcess Int. 18(10i) 2018: 6i–8i; https://bioprocessintl.com/upstream-processing/assays/certain-approaches-to-understanding-sources-of-bioassay-variability.
Corresponding author Naveenganesh Muralidharan ([email protected]) is senior manager, Thatsinee Johnson is a process engineer, and Mark Davis is director, all on the manufacturing science and technology (MSAT) team at AGC Biologics, 5550 Airport Boulevard, Boulder, CO 80301; https://www.agcbio.com.
You May Also Like

