- Sponsored Content
Validating Prefiltration Dirty-Hold Times for Upstream Media and Feed Solutions: Implications for Establishing In-Process Microbial Control
Biopharmaceutical manufacturing processes require that prepared raw materials and product intermediates be held at different stages. During hold times, however, process and product intermediates are susceptible to microbial risks from bioburden, endotoxins, and exotoxins. Such risks arise from multiple sources, including bioproduction facilities, equipment, operations, and raw materials. Even a prepared intermediate can help microbes to grow.
The US Food and Drug Administration’s (FDA’s) guidance on Sterile Drug Products Produced By Aseptic Processing states that “the time limits established for the various production phases should be supported by at-scale data. Bioburden and endotoxin load should be assessed when establishing time limits” (1). Furthermore, United States Pharmacopeia (USP) Chapter <1115> states that “manufacturers must properly establish processing hold times considering whether processing steps and hold times could result in changes to bioburden” (2, 3). Therefore, studies on presterilization filtration hold times must be performed at manufacturing scales to ensure that changes in microbial load are controlled before sterilization processes begin.
Preferably, such studies should be performed during engineering runs before — or at least during — process performance qualification (PPQ) runs. Upon establishing maximum prefiltration hold times, quality assurance/control (QA/QC) teams might not need to perform routine microbial monitoring on prefiltration upstream media and feed solutions for standard production batches. However, periodic nonroutine sampling and monitoring may be performed annually or after a prolonged shutdown. Furthermore, unprocessed bulk harvest (UB) samples are taken from production bioreactors and tested for bioburden and endotoxin for all manufacturing batches. A UB sample represents all materials used during an upstream process, including raw materials, culture media, and feed solutions. Hence, routine monitoring and sampling of prefiltration media and feed solutions serve as redundant checks that might not add value to the microbial control strategy for a given process. (Note that because cell-culture media and feed solutions often are sterilized using 0.22-µm filtration, we use presterilization and prefiltration interchangeably in this article.)
Cell-culture growth and production media are nutrient-rich and pH-neutral materials that are prepared at temperatures of 25–40 °C, a range that supports the growth of most microbes (3). Therefore, this article emphasizes quantifiable risk-assessment methodology for determining appropriate prefiltration hold times to ensure that microbial risks are suitably controlled during a manufacturing process. Our risk assessment is based on a conservative calculation that models the change in bioburden load, risk of filtration failure, and impurity safety factor for both exotoxins and endotoxins.

Table 1: Risk-assessment matrix for assigning postfiltration risk (Rpf); DS = drug substance, DP = drug product, IPC = in-process control, RPN = risk priority number.
Preliminary Considerations
Prefiltration Hold-Time Challenge for Assessment: At our company’s facility, cell-culture media for our 20,000-L production bioreactor require the longest preparation time. Although medium preparation and filtration typically are performed within three hours from the time of the first component’s addition (Tp), we often assess a fourfold longer preparation time (4Tp = 12 hours) as a challenge for microbial control, assuming that 4 the typical preparation period would be enough time for upstream teams to address unforeseen issues during operations.
Data-Based Microbial Load at Time Zero: In-house prefiltration microbial hold samples at t = 0 consistently show a bioburden of ≤1 colony-forming unit (CFU)/mL for a sample size of 12. However, cell-culture medium preparation is performed in a controlled ISO class 8 cleanroom rather than a sterile environment. Therefore, some microbial load should be present at the initial time point.
As with other assays, the bioburden test is prone to giving false-negative results. Such problems can come from heterogenous bioburden distribution in a test solution, sample-handling errors during pipetting of dilutions, and inefficient bioburden recovery. Errors stemming from heterogenous bioburden distribution and sample handling are inherent to the method. However, errors in microorganism recovery can be attributed to bioburden density in test solutions and to test volumes, both of which are process specific. Low test volumes and microbial loads can increase the chances of false-negative results. In such instances, when bioburden results from a nonsterile sample are reported as being below detectable limits, then the most probable bioburden concentration in the test solution can be calculated for an acceptable chance of false-negative results as detailed in steps 1 and 2 of the method we discuss below, based on that detailed by Yang, Li, and Chang (4).
Setting Prefiltration Bioburden Limits
False-Negative Errors from Bioburden Test Volume and Density: The European Medicines Agency (EMA) recommends a minimum of 100 mL as the test volume for a bioburden assay, with 10 CFU as an acceptable limit for bioburden of samples taken before sterile filtration. Yang, Li, and Chang identified a relationship between false-acceptance probability and either bioburden test volume or bioburden density in test solutions. The writers showed statistically that the sensitivity of a bioburden assay performed in the EMA-recommended 100-mL test volume to detect 10 CFU is 41.2%; in other words, the probability of falsely accepting a contaminated batch is (100% – 41.2% = 58.8%). Using that information, Field showed the minimum test-solution bioburden level for different test volumes <100 mL to have a detectability equivalent to 41.2% (5). Equation 1 is derived from Field’s data using a nonlinear exponential 5P decay model with JMP14 software.
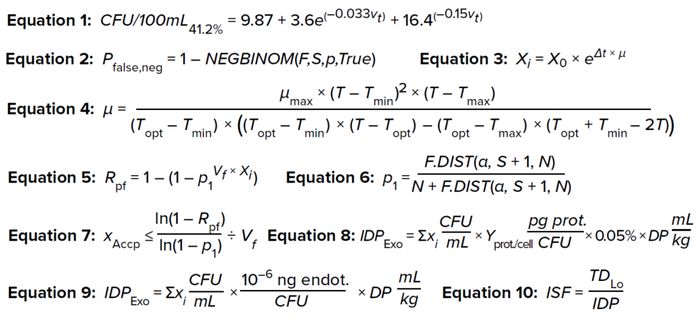
Equations 1–10:
Step 1: Using Equation 1, calculate the minimum bioburden limit for a specific test volume to have an assay sensitivity of 41.2%.
Here, CFU/100mL41.2% is the minimum bioburden load in a test solution at different test volumes (Vt) for an assay with 41.2% sensitivity, which suffices to detect 10 CFU in a 100-mL test solution.
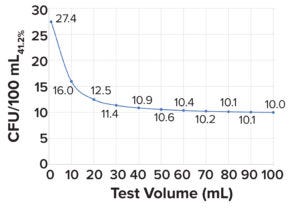
Figure 1: Minimum microbial load in a bioburden test with a sensitivity of 41.2%; a 100-mL test volume is needed to detect 10 colony-forming units (CFU/100mL41.2%).
Step 2: Using CFU/100mL41.2% values, as shown in Figure 1, the probability of false-negative results can be calculated for different bioburden concentrations at the respective test volumes by applying a negative binomial distribution model (Equation 2), wherein
Pfalse,neg is the probability of false negative results of bioburden test
NEGBINOM returns the negative binomial distribution (the probability that F failures will occur before S success, with PS probability of success)
F is the test-solution bioburden concentration
S is CFU/100mL41.2%, calculated from Equation 1
PS represents a 41.2% probability of success (4).
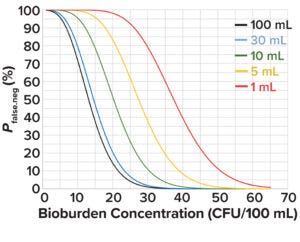
Figure 2: Probability of a false-negative bioburden test at different test volumes and in-solution bioburden concentrations.
Figure 2 depicts the probability of false-negative bioburden test results at different test volumes and bioburden concentrations based on values derived from Equation 2. At an acceptable false-negative risk of 0.05 for a 1-mL test volume, the bioburden concentration is 55 CFU/100 mL. That value can be used as the initial bioburden load at the start of culture-medium preparation, X0 in Equation 3, to calculate the change in bioburden load over a hold period.
For any medium preparation, microbial risks derive primarily from raw materials and improperly cleaned or contaminated equipment. Assuming that preparation is in a clean container, the major source of bioburden is from raw materials. In a typical chemically defined (CD) liquid cell-culture media, water for injection (WFI) constitutes >95% of the preparation’s mass; the remainder comes from dry-powdered growth supplements (6). Per USP <1231>, the maximum acceptable bioburden limit for WFI is 10 CFU/100 mL. Dry-powder cell-culture supplements are packed at humidity levels ≤1% to ensure stability (7). Such levels are lower than that needed to promote microbial growth. USP <1112> has reported no microbial growth below water activity (aw) of 0.6, which is equivalent to humidity of 60%. Considering that 95% of formulated media consists of WFI with a maximum bioburden limit of 10 CFU/100 mL and that dry-powder supplements are microstatic over short periods (from time of dispensing to use) when stored in low cleanroom relative humidity (RH, 30–40%), a bioburden load of 55 CFU/100 mL is a conservative estimate for time zero (t0).
Modeling Bioburden Proliferation During Prefiltration Hold Time: The increase in bioburden load for different hold times can be calculated using Equation 3 (8). Here, X0 is the microbial load at t0, calculated as 55 CFU/100 mL; Xi is the bioburden load at time t = i; and µ is the specific growth rate.
The value of µ is influenced significantly by media preparation temperature. Most cell-culture media are prepared at ambient room temperature (15–25 °C) to prevent nutrient degradation; therefore, a preparation temperature of 21 °C is a good approximation. Rosso, Lobry, and Flandrois devised a “cardinal growth model” to predict the influence of temperature on microbial specific growth rates (Equation 4) (9, 10).
Therein, µmax is the maximum specific growth rate. Taking a conservative approach, we use the µmax value assumed for Escherichia coli, one of the fastest-doubling bacterial species, with a doubling time (Td) of 20 minutes or 0.3 hours (11). From that, the value of µmax is calculated as 2.1 hours–1: µmax = ln(2)/Td, where ln(2) is the natural logarithm of 2.
Tmin and Tmax are minimum and maximum temperatures, respectively, at which microbial growth is observed. Topt refers to the optimum temperature for microbial growth. Rosson et al. have shown for E. coli that Tmin = 4.9 °C, Topt = 41.4 °C, and Tmax = 45.8 °C (12).
After applying all of the above assumptions and using a media preparation temperature of 21 °C, the calculated value for µ is 0.5 hours–1. That value can be substituted in Equation 2 to calculate the change in microbial load over hold time.
Postfiltration Risk: The postfiltration risk (Rpf) is defined as the probability of having at least 1 CFU pass through a filtration system. That risk can be calculated using Equation 5 (13).
For upstream media and feed solutions, microbial breach often can be identified early — before purification and well before batch release — by a reduction in pH and/or a decrease in a bioreactor’s dissolved oxygen trend. Therefore, based on the batch run rate, an Rpf value of 10–3 is well accepted in practice, indicating that only one out of 1,000 batches would have a microbial breakthrough during filtration. For a run rate of 10 batches per year in a 20,000-L production bioreactor, one errant batch per 100 years is an acceptable risk.
The term (Vf × Xi) gives the total microbial load in the test solution used to challenge the 0.22-µm filters (mL/cm2 × CFU/mL = CFU/cm2). Vf is the filtrate throughput in mL/cm2, and Xi is the bioburden load in CFU/mL. p1 is the probability that one bacterium passes through a filter membrane (per cm2), which follows a binomial distribution. Calculated as shown in Equation 6, p1 can be derived from the binomial confidence interval (13, 14).
F.DIST calculates the cumulative probability density function for the F distribution in a Microsoft Excel spreadsheet. Statistical confidence (1 – α) is assumed to be 0.95 by default; thus, α = 0.05 in Equation 6. S is the number of successful events. Here, the event is defined as a bacterium penetrating through the sterile filter area. Therefore, for that to happen, the event (S) = 1, and N is the number of trials required for achieving at least one successful event. N is equal to maximum retention capacity of the filter obtained from a filter manufacturer’s certificate of analysis (CoA). Most commercially available 0.22-µm sterile filters are rated for a microbial retention capacity of 107 CFU/cm2 based on tests involving the bacterial species Brevundimonas diminuta.
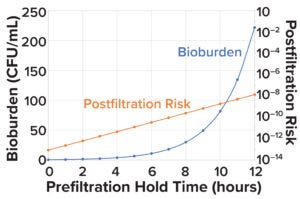
Figure 3: Change in microbial load and postfiltration risk across different prefiltration hold times.
In biologics manufacturing, prefiltration often is performed using membrane filters with 0.45-µm pores. Carter has determined a bacterial retention capacity of 104 CFU/cm2 using Pseudomonas diminuta for 0.45-µm membrane filters (15), and Parenteral Drug Association (PDA) Technical Article 26 has reported that microbial penetration is observed through 0.45-µm membrane filters when challenged with microbial loads above 10–4 to 10–6 per cm2 (16). Therefore, the maximum microbial retention capacity (N) for such filters is assumed conservatively to be 104 CFU/cm2. In such applications, postfiltration risk is calculated independently for 0.45-µm and 0.22-µm membrane filters using Equation 5. Then, the risks for both filter sizes are multiplied to yield the postfiltration risk for a combined pre- and postfiltration setup.
Bioburden Acceptance Criteria and Bioburden Challenge Before Filtration: Sandle has reported that a maximum presterilization bioburden limit of 1,000 CFU/mL is suitable for starting material or material from the first stage of a manufacturing process (17). Figure 1 shows that the calculated bioburden load after a prefiltration hold time of 4Tp (12 hours) is 221 CFU/mL, which is 4.5× below the limit of 1,000 CFU/mL.
Risk-Based Approach for Calculating Prefiltration Bioburden Acceptance Criteria: Yang, Li, and Chang have presented a risk-based approach for calculating prefiltration bioburden acceptance criteria. Therein, postfiltration risk is established and then prefiltration bioburden acceptance criteria are calculated as a function of filter-membrane area, filtrate volume, and maximum retention capacity of the sterile filter — all of which are process specific (4). Equation 7 is obtained by rearranging terms in Equation 5.
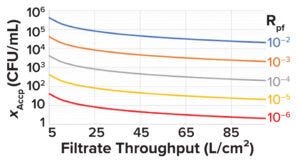
Figure 4: Minimum acceptable prefiltration bioburden limit (XAccp, CFU/mL) at different filtrate throughputs for different levels of postfiltration risk (Rpf).
See the “Sample Calculation 1” box for an example of how to set prefiltration bioburden limits based on Equations 1–7.The minimum acceptable prefiltration bioburden limit calculated using Equation 7 can be plotted against the filtrate throughput (L/cm2) for different postfiltration risks, as shown in Figure 4. Such plots can serve as handy tools.
Evaluating Exotoxin Loads and Their Downstream Clearance
Although bioburden can be removed easily by 0.22-µm filtration, residual microbial by-products can copurify with drug substances, posing risks for detrimental effects on patient safety and product quality. Microbial by-products of concern primarily include protein exotoxins (e.g., botulinum toxin A) and nonprotein exotoxins (e.g., aflatoxins, endotoxins, flagellins, microbial DNA, and cell-wall polysaccharides). Except for endotoxins, good manufacturing practice (GMP)–grade assays are unavailable for detection of such by-products. However, levels of exotoxin components can be estimated and compared with safety criteria using worst-case assumptions (18).
The dose of exotoxins in a given product can be calculated conservatively as shown in Equation 8. Compared with other such microbial by-products, botulinum toxin A presents safety concerns even at low doses. Therefore, it is used as the worst-case representation for all exotoxins (19, 20).
IDPExo is the in-product impurity dose for exotoxin (pg/kg), and ΣXi (CFU/mL) is the cumulative amount of microbial load produced until time i (see Figure 5 for calculation details). Protein yield per microbial cell (Yprot./cell) is assumed to be 0.165 pg/cell (19). Wintzingerode has calculated 0.05% of the bacterial protein mass to be protein exotoxins (20). To take a conservative approach, all calculated protein exotoxins can be treated as botulinum A.
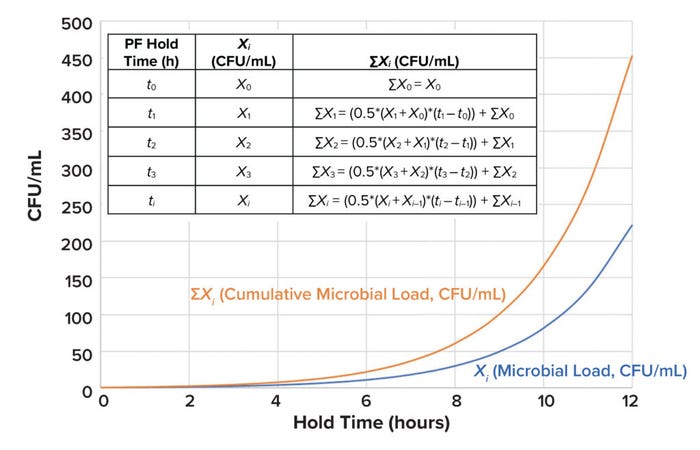
Figure 5: ΣXi represents the cumulative amount of microbial load (Xi) produced until time i (CFU = colony-forming unit, PF = prefiltration).
Protein concentrations in formulated monoclonal antibody (MAb) drug products typically range from 50 mg/mL to 150 mg/mL (21), with doses reaching up to <10 mg/kg of patient weight (22). DP represents the drug-product dose in mL/kg. For our purposes, DP is calculated conservatively as 10 mg/kg ÷ 50 mg/mL = 0.2 mL/kg.
Exotoxin Clearance During Protein A Chromatography: In biologics manufacturing processes, protein A affinity chromatography is typically the first step in purification. The interaction between immunoglobulin G (IgG) and protein A has been shown to be highly specific, and affinity chromatography enables removal of >99% of process impurities in a single step, starting directly from complex solutions such as cell-culture clarified-harvest media (23). Therefore, an affinity-based purification process should provide substantial clearance of both exotoxins and endotoxins. For instance, a spiking study using MabSelect SuRe chromatography resin resulted in a 1.9 log reduction value (LRV) for exotoxins, representing 98.7% clearance (24). As a conservative approach, an LRV of 1.0 may be used for exotoxin clearance calculations.
Exotoxin Clearance During Cation-Exchange (CEX) Chromatography: A protein’s net surface charge changes with buffer pH based on its isoelectric point (pI). When pH and pI are equal, a protein will carry no net charge. At a pH below its pI, a protein attains a net positive charge; similarly, at a pH above the pI, a protein attains a net negative charge.
CEX steps are performed in bind–elute mode. Typically, the buffer has a pH of 4–6, which is below the pI (>7) of most MAbs. In such conditions, a MAb attains a positive charge, enabling it to bind with negatively charged resins. The pI for exotoxins is ~2.5. Therefore, during CEX, exotoxin impurities attain a negative charge and flow through a column. Exotoxins should be cleared substantially by a CEX process. In an exotoxin spiking study by scientists at Cytiva, samples showed an LRV of 2.9 during CEX chromatography (25). Thus, an LRV of 3.0 may be used as a conservative assumption for exotoxin clearance calculations across such purification processes.
Change in Endotoxin Load: Endotoxin A is a pyrogenic product present in bacterial cell walls. It can generate adverse reactions in patients, from fever to death, even at a trace concentration of 0.1 ng/kg of patient body weight. Thus, endotoxins present another microbial risk that can arise when process intermediates are held. Liposaccharides and/or endotoxins are produced at 10–15 g per CFU of typical Gram-negative bacteria. Endotoxins are reported in endotoxin units (EU): 0.1 ng = 1 EU (26–28). Equation 9 shows how to calculate the in-product impurity dose for endotoxins generated during prefiltration medium hold time.
Endotoxin Clearance During Anion-Exchange (AEX) Chromatography: In AEX processes, a protein of interest is recovered in flowthrough mode. Under neutral or slightly basic pH conditions, endotoxins are negatively charged and bind tightly to positively charged resin, enabling target proteins to flow through a column. Additional information on endotoxin clearance is detailed in the “Sample Calculation 2” box.
Endotoxin Acceptance Criteria: Acceptable limits for endotoxins can be wider in upstream processes and tighter toward the end of downstream processes based on understanding of process risks and clearance capabilities. Endotoxin limits for in-process intermediates are determined based on the clearance factor, total potential for introduction of endotoxin to the product, and quantitation limits. Quantification limits and acceptable endotoxin limits are calculated based on results from a worst-case dilution assay and on protein concentrations in formulated drug substances, as shown in the “Sample Calculation 2” box.
Impurity Safety Factor (ISF) Assessment for Exotoxins and Endotoxins: Safety risk assessments can be carried out using ISF calculations. An ISF is a ratio of the impurity level present in a product to the toxic impurity level. ISFs can be calculated as shown in Equation 10, wherein TDLo represents the low toxic dose, or the lowest amount of a substance introduced by any route other than inhalation and over any period that has generated a toxic effect in humans or produced tumorigenic or reproductive effects in animals (36). A high ISF indicates a low safety risk.
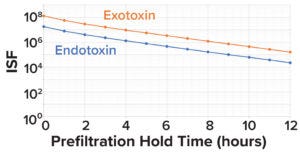
Figure 6: Impurity safety factors (ISFs) for endotoxins and exotoxins, by prefiltration hold time.
Here, we assume the TDLo for botulinum A to be 1.2 pg/kg of patient weight/hour (19). For endotoxins, the lowest FDA-recommended dose for intrathecally administered products is 0.2 EU/kg/hour. Assuming 1 EU = 0.1 ng, the TDLo value for endotoxins is 0.02 ng/kg/hour (23, 37). As Figure 6 shows, when considering 3.0 LRV clearance of exotoxin and 2.0 LRV clearance of endotoxin during downstream processes, the calculated exotoxin and endotoxin ISF values are 100,000× and 10,000× below the toxic dose, respectively.
Bioburden and Endotoxin Criteria for Routine and Other Process Validation Samples: The sample risk-assessment calculations shown in the bioburden and endotoxin boxes may be applied, respectively, to set bioburden and endotoxin acceptance criteria for other routine upstream-manufacturing and process-validation samples. Extending the scope from our focus on prefiltration microbial controls, Table 2 provides guidance and rationales for alert and action limits for samples used in routine manufacturing and process-validation testing for upstream processes.
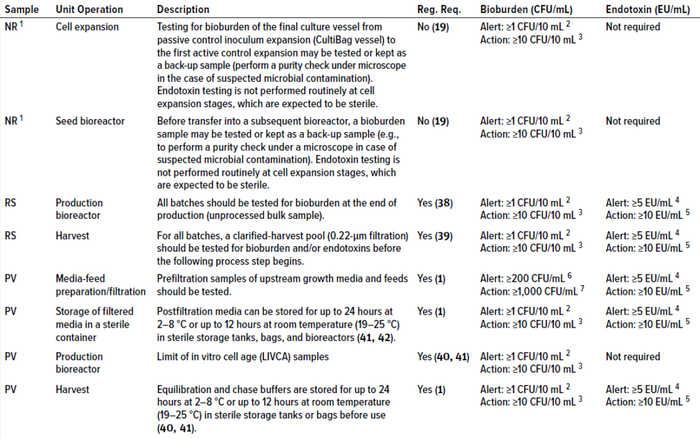
Table 2: Alert and action limits for upstream samples for routine-biomanufacturing and process-validation activities; NR = nonroutine sample, RS = routine sample, PV = process-validation sample, Reg. Req. = regulatory requirement.
1 Nonroutine samples are not regulatory requirements; however, such sampling is recommended for an appropriate number of batches at scale based on statistical analysis and/or risk assessment.
2 No microbial growth is expected in a sterile sample from a bioreactor.
3 Deutschmann and Thoelken studied bulk drug-substance samples taken aseptically from class D, C, and B cleanroom environments and analyzed in nonclassified microbiological laboratories. The writers noted that colonies can appear on such plates because of sampling and handling. Occasionally, such circumstances generate false-positive results (false rejection of a batch) (42). In such cases, setting a bioburden action limit of 10 CFU/10 mL in addition to an alert limit of 1 CFU/10 mL, as recommended by Krause (26) may be adopted to prevent false rejection of good batches.
4 US FDA has specified an in-process control limit of 5 EU/mL for anion-exchange product pools in downstream monoclonal antibody (MAb) production processes (43). Setting that value as a provisional alert limit early in the manufacturing process (for upstream media and feed solutions) should be a good acceptable approach.
5 Based on calculations in Sample Calculation 2 box.
6 Based on microbial load change data shown in Figure 1.
7 Based on calculations in Sample Calculation 1 box.
Knowing the Merits and Limits of Acceptance Criteria
We have shown herein that results from bioburden and endotoxin testing meet the acceptable criteria for an extended prefiltration hold time of 12 hours for media prepared for use in a 20,000-L production bioreactor. We applied conservative calculations to model changes in bioburden loads, risks of filtration failure, and ISFs for exotoxins and endotoxins. The results demonstrated that the risk associated with microbial control during the prefiltration hold time of 12 hours is well within acceptable risk limits.
The risk assessments and calculations for microbial limits shown in this article are for demonstration of procedures only. We encourage readers to assess the acceptability of risks in adherence to their companies’ respective quality policies. Furthermore, the bioburden and endotoxin limits cited or calculated in this article can be used as provisional limits when no or limited historical data are available — and recommended provisional limits should be reevaluated based on generated data.
Acknowledgments
We thank Mark Davis (senior director of MSAT), Leyla S. Rose (senior manager of process validation), and Anthony Montedonico (director of microbiology), all at AGC Biologcs, for their constructive feedback and valuable suggestions.
References
1 FDA-2003-D-0145. Sterile Drug Products Produced By Aseptic Processing: Current Good Manufacturing Practice — Guidance for Industry. US Food and Drug Administration: Silver Spring, MD, 2008; https://www.fda.gov/regulatory-information/search-fda-guidance-documents/sterile-drug-products-produced-aseptic-processing-current-good-manufacturing-practice.
2 USP <1115>. Bioburden Control for Non-Sterile Drug Substance and Products. United States Pharmacopeia: Rockville, MD, 2014; https://doi.org/10.31003/USPNF_M8105_01_01.
3 Sandle T. Assessing Process Hold Times for Microbial Risks: Bioburden and Endotoxin. J. GXP Compliance 19(3) 2015: 1–9; https://www.researchgate.net/publication/282661901_Assessing_Process_Hold_Times_for_Microbial_Risks_Bioburden_and_Endotoxin.
4 Yang H, Li N, Chang S. A Risk-Based Approach to Setting Sterile Filtration Bioburden Limits. PDA J. Pharm. Sci. Technol. 67(6) 2013: 601–609; https://doi.org/10.5731/pdajpst.2013.00942.
5 Field R. Bioburden Control at the Sterile Filtration Step: A Risk-Based Approach (presentation). European Biopharmaceutical Enterprises Workshop. CMC Strategy Forum Europe: Prague, Czech Republic, 6 May 2013.
6 Gibco CD CHO Media: User Guide. Thermo Fisher Scientific, 4 June 2018; https://assets.thermofisher.com/TFS-Assets/LSG/manuals/MAN0007311_CD_CHO_Medium_UG.pdf.
7 Langer ES, et al. Powder Culture Media Packaging, Preparation, and Market Trends: A Study of Manufacturing and Market Trends. BioPlan Associates, 2014; https://assets.thermofisher.com/TFS-Assets/LSG/brochures/PowderMediaWhitePaper_LifeTech_Jan2014.pdf.
8 Doran PM. Bioprocess Engineering Principles. 2nd edition. Academic Press: London, UK, 2012.
9 Rosso L, Lobry JR, Flandrois JP. An Unexpected Correlation Between Cardinal Temperatures of Microbial Growth Highlighted by a New Model. J. Theoret. Biol. 162, 1993: 447–463; https://doi.org/10.1006/jtbi.1993.1099.
10 Baka M, et al. Impact of pH on the Cardinal Temperatures of E. coli K12: Evaluation of the Gamma Hypothesis. Food Control 29(2) 2013: 328–335; https://doi.org/10.1016/j.foodcont.2012.04.022.
11 Tuttle AR, Trahan ND, Son MS. Updated Protocol: Growth and Maintenance of Escherichia coli Laboratory Strains. Curr. Protoc. 20 January 2021: e20; https://doi.org/10.1002/cpz1.20.
12 Membré JM, et al. Temperature Effect on Bacterial Growth Rate: Quantitative Microbiology Approach Including Cardinal Values and Variability Estimates To Perform Growth Simulations on/in Food. Int. J. Food Microbiol. 100(1–3) 2005: 179–186; https://doi.org/10.1016/j.ijfoodmicro.2004.10.015.
13 Coffey T, Yang H. Statistics for Biotechnology Process Development. CRC Press: Boca Raton, FL, 2018.
14 Muralidharan N. Statistical Method for Establishing Control Limits for Nonnormal Data Distribution: Focus on Continued Process Verification Monitoring. BioProcess Int. 20(10) 2022: 20–24; https://bioprocessintl.com/manufacturing/process-monitoring-and-controls/statistical-method-for-establishing-control-limits-for-nonnormal-data-distribution-focus-on-continued-process-verification-monitoring.
15 Carter J. Evaluation of Recovery Filters for Use in Bacterial Retention Testing of Sterilizing-Grade Filters. PDA J. Pharm. Sci. Technol. 50(3) 1996: 147–153; https://journal.pda.org/content/50/3/147.
16 PDA TR-26. Sterilizing Filtration of Liquids. Parenteral Drug Association: Bethesda, MD, 2008; pda.org/bookstore/product-detail/1184-tr-26-sterilizing-filtration-of-liquids.
17 Sandle T. What Counts? Establishing a Bioburden Strategy for a New Pharmaceutical Product. Amer. Pharm. Rev. 1 October 2022; https://www.americanpharmaceuticalreview.com/Featured-Articles/590786-What-Counts-Establishing-a-Bioburden-Strategy-for-a-New-Pharmaceutical-Product.
18 Sandle T. The Risk of Bacillus cereus to Pharmaceutical Manufacturing. Amer. Pharm. Rev. 28 November 2014; https://www.americanpharmaceuticalreview.com/Featured-Articles/169507-The-Risk-of-em-Bacillus-cereus-em-to-Pharmaceutical-Manufacturing.
19 Bain D, et al. Microbial Monitoring for Biological Drug Substance Manufacturing: An Industry Perspective. PDA J. Pharm. Sci. Technol. 69(3) 2015: 451-460; https://doi.org/10.5731/pdajpst.2015.01070.
20 Wintzingerode FV. Biologics Production: Impact of Bioburden Contaminations of Non-Sterile Process Intermediates on Patient Safety and Product Quality. Amer. Pharm. Rev. 30 April 2017; https://www.americanpharmaceuticalreview.com/Featured-Articles/337286-Biologics-Production-Impact-of-Bioburden-Contaminations-of-Non-Sterile-Process-Intermediates-on-Patient-Safety-and-Product-Quality.
21 Garidel P, et al. High-Concentration Protein Formulations: How High Is High? Eur. J. Pharm. Biopharm. 119, 2017: 353–360; https://doi.org/10.1016/j.ejpb.2017.06.029.
22 Sachs JR, et al. Optimal Dosing for Targeted Therapies in Oncology: Drug Development Cases Leading By Example. Clin. Cancer Res. 22(6) 2016: 1318–1324; https://doi.org/10.1158/1078-0432.CCR-15-1295.
23 Application Note: Endotoxin Removal — The Solution with Membrane Separation Technology. EMD Millipore: Darmstadt, Germany, 2012; https://www.sigmaaldrich.com/deepweb/assets/sigmaaldrich/product/documents/219/983/tb2999en-ms.pdf.
24 Mehta K, et al. Comparing Performance of New Protein A Resins for Monoclonal Antibody Purification. Amer. Pharm. Rev. 16 February 2018; https://www.americanpharmaceuticalreview.com/Featured-Articles/347357-Comparing-Performance-of-New-Protein-A-Resins-for-Monoclonal-Antibody-Purification.
25 Application Note: Exotoxin Clearance from mAb Samples in a Two-Step Chromatography Process. Cytiva: Upssala, Sweden, 2018; https://cdn.cytivalifesciences.com/api/public/content/digi-24162-pdf.
26 Krause S. Alert, Action, and Specification Limits for Bioburden and Endotoxin (presentation). Parenteral Drug Association Annual Meeting: Las Vegas, NV, 16–18 March 2015.
27 USP–NF <85>. Bacterial Endotoxins. US Pharmacopeia: Rockville, MD, 1 December 2012; https://www.usp.org/harmonization-standards/pdg/general-methods/bacterial-endotoxins.
28 Salema VF, Saxena L, Pattnaik P. Removing Endotoxin from Biopharmaceutical Solutions. Pharm. Technol. Eur. 21(10) 2009: 16–20; https://www.pharmtech.com/view/removing-endotoxin-biopharmaceutical-solutions.
29 Banerjee S, Somasundaram G. Endotoxin Control and Clearance in Biomanufacturing (webinar). MilliporeSigma: Burlington, MA, 2012; https://www.sigmaaldrich.com/US/en/collections/webinars/endotoxin-control-and-clearance-in-biomanufacturing.
30 Magalhães PO, et al. Methods of Endotoxin Removal from Biological Preparations: A Review. J. Pharm. Pharm. Sci. 10(3) 2007: 388–404.
31 Sandle T. Variability and Test Error with the LAL Assay. Amer. Pharm. Rev. 28 August 2014; https://www.americanpharmaceuticalreview.com/Featured-Articles/167404-Variability-and-Test-Error-with-the-LAL-Assay.
32 Wintzingerode F, Knight M. Setting Endotoxin In-Process Controls for Recombinant Therapeutic Proteins. Amer. Pharm. Rev. Endotoxin Suppl., 2017: 20–23.
33 Application Note: Endotoxins and Cell Culture. Corning: Tewksbury, MA, 2020; https://www.corning.com/catalog/cls/documents/application-notes/TC-305.pdf.
34 Epstein J, et al. Effect of E. Coli Endotoxin on Mammalian Cell Growth and Recombinant Protein Production. In Vit. Cell. Dev. Biol. 26(12) 1990: 1121–1122; https://doi.org/10.1007/bf02623686.
35 Sibley CH, Terry A, Raetz CR. Induction of Kappa Light Chain Synthesis in 70Z/3 B Lymphoma Cells By Chemically Defined Lipid A Precursors. J. Biol. Chem. 263(11) 1998: 5098–5103; https://doi.org/10.1016/s0021-9258(18)60684-2.
36 Luo H, et al. Safety Risk Management for Low Molecular Weight Process-Related Impurities in Monoclonal Antibody Therapeutics: Categorization, Risk Assessment, Testing Strategy, and Process Development with Leveraging Clearance Potential. Biotechnol. Prog. 37(3) 2021: e3119; https://doi.org/10.1002/btpr.3119.
37 Setting Endotoxin Limits During Development of Investigational Oncology Drugs and Biological Products: Guidance for Industry. US Food and Drug Administration: Silver Spring, MD, July 2020; https://www.fda.gov/media/140410/download.
38 ICH Q5A(R1). Quality of Biotechnological Products: Viral Safety Evaluation of Biotechnology Products Derived from Cell Lines of Human or Animal Origin. ICH: Geneva, Switzerland, 1997; https://www.ema.europa.eu/en/documents/scientific-guideline/ich-q-5-r1-viral-safety-evaluation-biotechnology-products-derived-cell-lines-human-animal-origin_en.pdf.
39 FDA Compliance Program. Chapter 56: Drug Quality Assurance. US Food and Drug Administration: Silver Spring, MD, 2021; https://www.fda.gov/media/75208/download.
40 ICH Q5B. Quality of Biotechnological Products: Analysis of the Expression Construct in Cell Lines Used for Production of r-DNA Derived Protein Products. ICH: Geneva, Switzerland, 1996; https://www.ema.europa.eu/en/documents/scientific-guideline/ich-q-5-b-analysis-expression-construct-cell-lines-used-production-r-dna-derived-protein-products_en.pdf.
41 Agalloco J, et al. Handbook of Validation in Pharmaceutical Processes. 4th edition. CRC Press: Boca Raton, FL, 2021.
42 Deutschmann S, Thoelken S. Bioburden: Regulatory Expectations and Practical Experiences. GMP J. https://www.gmp-journal.com/current-articles/details/q-a-from-european-gmp-conference-bioburden-regulatory-expectations-and-practical-experiences.html.
43 ICH Q12. Technical and Regulatory Considerations for Pharmaceutical Product Lifecycle Management: Annexes — Guidance for Industry. US Food and Drug Administration: Silver Spring, MD, May 2021; https://www.fda.gov/media/148477/download.
Thomas Wombaker, Thatsinee Johnson, and Emma Bolduc are process engineers; and corresponding author Naveenganesh Muralidharan ([email protected]) is senior manager, all part of the Manufacturing Science and Technology (MSAT) team at AGC Biologics, 5550 Airport Boulevard, Boulder, CO 80301; https://www.agcbio.com.
The views and opinions expressed in this article are those of the authors and do not necessarily reflect the official policy or position of AGC Biologics or any of its officers.
You May Also Like

