Biopharmaceuticals such as recombinant monoclonal antibodies (MAbs) account for a significant proportion of all new drugs (1,2,3). Although manufacturing site capacities have expanded and process efficiencies have improved greatly, there is still some concern the current biomanufacturing capacity worldwide might not meet increasing market demands (1, 2).
PRODUCT FOCUS: RECOMBINANT PROTEINS
PROCESS FOCUS: PRODUCTION PROCESS DEVELOPMENT
WHO SHOULD READ: QA/QC, PROCESS DEVELOPMENT, AND ANALYTICAL PERSONNEL
KEYWORDS: CELL LINE DEVELOPMENT, SCREENING ASSAY, MONOCLONAL ANTIBODIES, FC PROTEINS, CHO, IGG, HTRF, ANTIBODY TITER, CELL LINE PRODUCTIVITY, ELISA
LEVEL: INTERMEDIATE
One aspect of bioprocessing that significantly affects production capacity requirements is cell line productivity (3). A high-producing cell line requires less capacity and reduces overall cost of goods than a lower-producing one (3, 4). Thus, efforts to reduce capacity requirements usually begin with cell line selection. Identifying a high-producing cell line can be time consuming and resource intensive. Large numbers of transfectants are screened to increase the odds of finding high producers (4). Limited dilution cloning (LDC) combined with productivity assessment by enzyme-linked immunosorbent assay (ELISA) is the most commonly used method (1, 4). But it takes over six months, and the number of clones that can be screened by ELISA is limited even in an automated format. High-throughput and cost-effective methods are needed to optimize this process.

Figure 1:
PHOTO COURTESY OF THE AUTHORS
Automated systems and new methods such as flow cytometry and cell sorting have emerged over the years to increase throughput and identify high-producing cell lines (1, 5, 6). However, some of these methods are expensive or need to be tailored for individual cell lines, which limits their use. A cost-effective, high-throughput alternative to traditional ELISA in limited-dilution cloning would be a step toward enhancing the process. Homogeneous time-resolved fluorescence (HTRF) technology, a combination of fluorescence resonance energy transfer (FRET) and time-resolved fluorescence (TRF), presents an opportunity for developing cost-effective high-throughput antibody screening assays.
HTRF technology is a versatile TR-FRET (time-resolved fluorescence resonance energy transfer) method used to probe molecular interactions (7). It involves two fluorophores, a lanthanide donor and an acceptor, which when brought into close proximity can transfer energy, leading to light emission from both. This energy-transfer phenomenon creates a homogeneous assay for assessment of biomolecular interactions when molecules are either directly or indirectly coupled with the fluorescent labels.
Some challenges encountered in FRET have been addressed in HTRF assays. For example, the fluorophores have short half-lives, so measured fluorescence intensities must be corrected for autofluorescence from sample matrices such as buffer, media, and cell culture fluid. That background correction negatively affects sensitivity of the assay. But the europium-cryptate donor used in HTRF technology is a long-lived fluorophore combined with time-resolved detection to minimize background interference and enhance sensitivity. A modified allophycocyanin (XL665 or d2) is used as the acceptor (7). When those two fluorophores are brought together by a biomolecular interaction, some europium emission energy is released as light at 620 nm while energy is transferred to XL665, causing fluorescence emission at 665 nm. Results are reported as a ratio of the 665 nm (or 668 nm) and 620 nm signals (7, 8), which corrects for sample interference. Like FRET, HTRF technology has been used in a variety of applications including cell-based bioassays (8, 9), high-throughput screening (10), receptor–ligand interactions (11,12,13), DNA hybridization experiments (14, 15), and many others.
In this study, we describe a new competitive-binding HTRF assay that can be applied to improve and overcome some challenges currently encountered in cell line selection. This HTRF binding assay is used to assess productivity of transfectant clones that express proteins such as immunoglobulin G (IgG) or IgG Fc fusion proteins, which bind to Staphyloccocal Protein A. Being HTRF-based, our method is homogenous, simple, and fast.
In this assay, Protein A labeled with XL665 (PAXL665) acts as an acceptor fluorophore and binds to polyclonal rabbit IgG (PAMK), the donor fluorophore. FRET is observed by the interaction of PAXL665 and PAMK indicated by fluorescence emission at 668 nm. IgG or Fc present in samples displaces the binding of PAMK to PAXL665 decreasing the FRET response (Figure 1). Thus, the fluorescence signal is inversely proportional to the concentration of Fc in a sample.
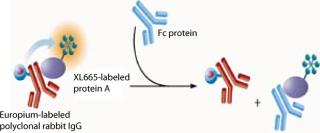
Figure 1: ()
Materials and Methods
The assay standards, whether IgG or Fc fusion proteins, were produced at our company by recombinant DNA techniques. We purchased the donor fluorophore (polyclonal rabbit IgG Europium Cryptate, PAMK) and the acceptor fluorophore (Protein A XL665, PAXL665) from CisBio of Bedford MA (www.htrf.com). Polysorbate 20 (Tween-20) was purchased from J.T. Baker of Phillipsburg, NJ (www.mallbaker.com). From VWR of West Chester, PA (www.vwr.com), we purchased potassium fluoride (KF) solution (50% w/w), Nalge Nunc International (www.nalgenunc.com) high-binding 96–half-well Maxisorp Immuno plates, a F(ab)′2 fragment of antihuman IgG, and an Fc fragment. Goat F(ab)′2 antihuman IgG F(ab)′2 HRP conjugate was purchased from Jackson ImmunoResearch of West Grove, PA (www.jacksonimmuno.com). We bought 1-Step Ultra TMB ELISA substrate from Pierce of Rockford, IL (www.piercenet.com). BSA (30%) and gelatin (2%) solutions were purchased from Sigma-Aldrich of Saint Louis, MO (www.sigmaaldrich.com). Phosphaste-buffered saline (PBS, 10×) and Dulbecco’s
Phosphaste-buffered saline (DPBS, 1×) were purchased from Mediatech, Inc. of Herndon, VA (www.cellgro.com). We bought flat-bottom, half-area, white 96-well plates (assay plates) from Corning Life Sciences of Lowell, MA (www.corning.com/lifesciences). And sulfuric acid was purchased from EMD Biosciences, Inc. of San Diego, CA (www.emdbiosciences.com).
HTRF Competitive Binding Assay: Cell culture fluid (10–50 µL) from transfectants was transferred into white 96–half-well assay plates. We tested samples either neat or diluted 1:5 with binding buffer (1× PBS, 0.002% gelatin, 0.1% Tween-20, and 400-mM KF at pH 7.4) to a final sample volume of 50 µL. To generate a standard curve for interpolating sample values, we also tested IgG of Fc protein standards at varying concentrations (0–100 µg/mL), on either the same or a different plate.
To each well on 96–half-well assay plates containing samples or standards, we added 50 µL of HTRF reagent (4.2 ng/well of PAMK donor molecule and 10 ng/well of PAXL665 acceptor molecule) in binding buffer. These plates were incubated at room temperature on a plate shaker for two hours to overnight. After incubation, they were read using a SpectraMax M5e reader from Molecular Devices Inc. of Sunnyvale, CA (www.moleculardevices.com) at two different wavelengths, 620 nm and 668 nm, using the recommended HTRF settings for the instrument with slight modifications as listed in the “HTRF Settings” box (8). Results are reported as the ratio of emissions (668nm/620nm) and in some cases that ratio multiplied by 10,000. Sample titer was determined from the HTRF ratio by interpolation off the linear range of the fitted (four-parameter) standard curve. Figure 2 shows a schematic diagram of this procedure.
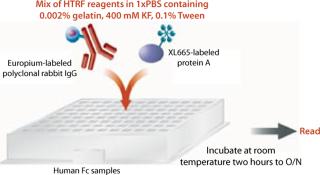
Figure 2: ()
ELISA: We developed this method to quantify IgG. High-binding 96–half-well plates were coated at 2–8 °C overnight with 2 µg/mL F(ab)′2 fragment of Fc-specific antihuman IgG in 1× DPBS. The plates were washed three to six times after each incubation step with 300 µL of 1× PBS and 0.05% Tween-20 at pH 7.2–7.4. After coating, the plates were blocked with a blocking buffer (1× PBS, 0.05% Tween-20, and 0.002% gelatin) for at least an hour at room temperature. Then they were incubated with 100 µL of IgG samples and/or standards for two hours at room temperature.
To detect IgG, we added 100 µL of goat F(ab)′2 antihuman IgG F(ab)′2 HRP conjugate to each well and incubated the plates for one hour at room temperature. They were developed with the 1 STEP Ultra TMB ELISA for 5–10 minutes at room temperature, and the reaction was stopped by 2M H2SO4. We measured absorbance at 450 nm and 650 nm (450–650 nm) using a microplate reader. IgG titer was determined by interpolation of absorbance values off the linear range of the fitted (four-parameter) standard curve.
Results and Discussion
Assay Development: In the development and optimization of this assay, we addressed certain factors presumed to have a significant impact on its range, precision, and accuracy. We evaluated probe concentrations, analyte concentrations, binding buffer composition, and instrument settings (e.g., reads per well).
Appropriate PAMK donor and PAXL665 acceptor concentrations were determined in a single experiment. We evaluated various combinations of PAMK and PAXL665 amounts in a 96–half-well plate without IgG or Fc analyte. The lower concentrations (PAMK at 2.1 ng/well and PAXL665 at 10 ng/well) giving an HTRF ratio above 1 were selected for future testing (Figure 3). In the same experiment, the manufacturer’s recommendations (PAMK at 10.5 ng/well and PAXL665 at 50 ng/well), gave a HTRF ratios between 1 and 1.5.
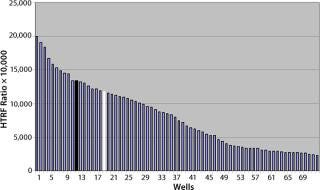
Figure 3: ()
A competitive binding experiment was then performed using various concentrations of IgG as the analyte to generate a four-parameter, curve-fit, dose-response curve (Figure 4). The concentration of PAXL665 was 10 ng/well, with PAMK being tested at various concentrations (2.1–40 ng/well) for optimization purposes (Figure 4). Increased PAMK concentrations only minimally affected observed responses. PAMK at 4.2 ng/well was slightly better than it was at 2.1 ng/well (decrease in response). Taking into account the observed response and cost of reagents, we selected PAMK at 4.2 ng/well and PAXL665 at 10 ng/well as our probe concentrations.
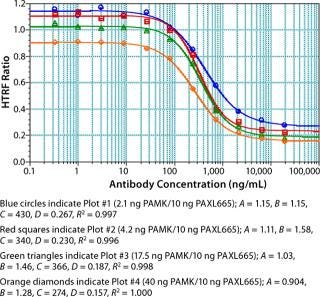
Figure 4: ()
We used concentrations of Fc protein that gave an adequate number of points in the linear range as well as the lower and upper asymptotes to generate a standard curve. The linear range of our assay varied with each Fc protein. Notably, proteins having the same Fc backbone and similar molecular weight showed significant differences in response. Figure 5 shows the results of testing different Fc proteins: two recombinant Fc fusion proteins, Ag21-Fc and Ag13-Fc, and two different recombinant human IgG2 antibodies, AB13 and AB21, of similar molecular weight. Under the same conditions, the observed response was different for each Fc protein (Figure 5). The greatest disparity was observed between the two IgG2 antibodies. AB13 and AB21 gave significantly different dynamic range and slopes. By our visual assessment, the dynamic range appeared to be 0.1 to 2 µg/mL (100–2,000 ng/mL) for AB13 and 0.2 to 20 µg/mL (200–20,000 ng/mL) for AB21 (Figure 5).
HTRF SETTINGS FOR THE SPECTRAMAX M5E READER (8)
Read Type: Endpoint
Read Mode: Time-resolved fl
uorescence (50 ms integration delay, 400 ms integration: 400 ms); top read
Wavelengths: Excitation 314, 314; Emission 668, 620; Cutoff 630, 570
Sensitivity: 25–100 reads/well; automatic PMT
Automix: Five seconds before first read
Autocalibrate: On
Assay Plate Type: 96-well Corning half-area flat-bottom plates
Wells to Read: Entire plate or other
Carriage Speed: Normal
Settling Time: Off
Column Wavelength Priority: Column priority
Auto Read: Off
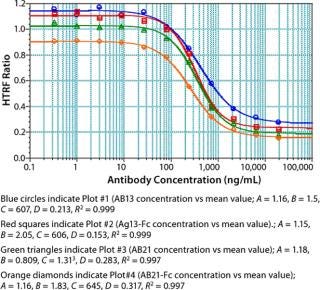
Figure 5: ()
Unlike ELISA systems in which proteins are immobilized, this assay is homogenous, so AB13 and AB21 may exist in different conformations. Therefore, their apparent differences in binding to the Protein A fluorophore could be attributable to differences in their conformation and resulting accessibility of binding sites. When screening or ranking clones, it is not crucial to use a standard that’s identical to the product in question; as demonstrated, that becomes important when using this HTRF assay to quantify proteins. If a suitable Fc standard is not used, the results could be skewed. Thus, using a generic Fc standard approach may not always be appropriate for this assay.
Both gelatin and bovine serum albumin (BSA) used as blocking agents in the binding buffer seemed to give comparable results at concentrations of 0.002% and 0.5% respectively. Also, the results indicate that Tween-20 concentrations from 0.05 to 0.1% are acceptable (Figure 6). Potassium fluoride is added to the binding buffer to minimize fluorescence quenching in HTRF assays (16).
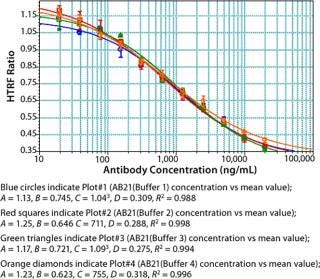
Figure 6: ()
As part of assay optimization, we evaluated the number of reads per well defined by the M5e plate reader because the time it takes to read a plate is directly proportional to the number of reads that can be done. As shown in Figure 7, experiments performed with 25–100 reads/well gave comparable results. No significant impact on interwell precision and linearity of fitted curves was observed by performing the assay at 25 reads/well (Figure 7). Thus, to increase throughput, we performed our experiments with the M5e instrument setting at 25 reads/well.
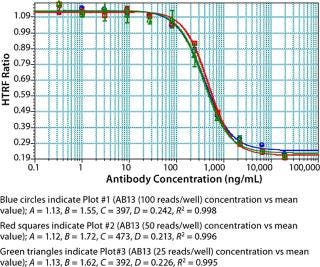
Figure 7: ()
Location effects are a potential problem in plate-based systems that can lead to confounding results (17, 18). To look for inherent location effects in our HTRF assay, we tested AB13 on separate plates, with each plate at a different antibody concentration (0.156 µg/mL, 0.312 µg/mL, and 0.625 µg/mL) representing low, middle, and high points of the assay’s dynamic range. Based on the results in Figure 8, no bias or trends were observed at any of the antibody concentrations. The signal pattern was different for each plate, indicating no location bias. In addition, fluorescence signal variation for each plate was less than 5% RSD. So location effects do not seem to be a problem with this assay.
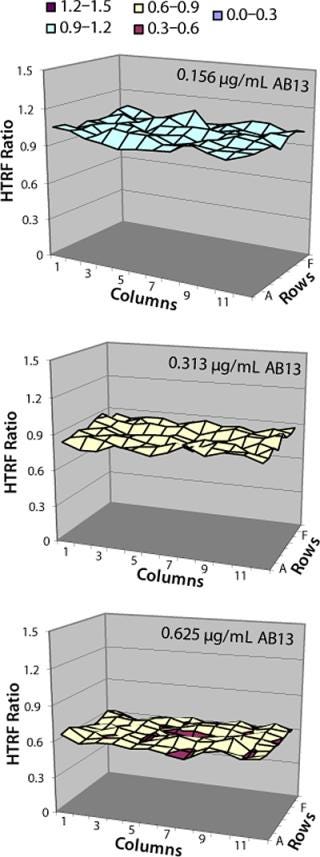
Figure 8: ()
Assay Performance: We found our assay to be specific for Fc proteins or proteins that bind to Staphylococcal Protein A. No competitive binding response was observed for BSA or cell culture fluid (CCF) from parent Chinese hamster ovary (CHO) cells (Figure 9). Repeatability and intermediate precision of the assay were assessed using AB13. As shown in Figure 10, samples tested in four replicates gave similar four-parameter curves. When we compared all four curves, we found the A (maximum HTRF ratio), B (slope), C (effective concentration at half the maximum response, EC50) and D (minimum HTRF ratio), values all within 15%, demonstrating acceptable repeatability.
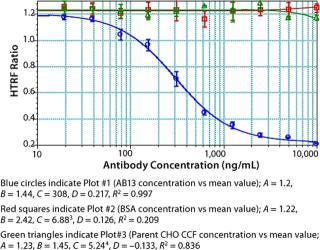
Figure 9: ()
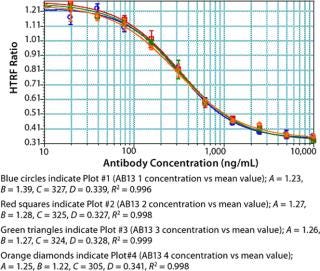
Figure 10: ()
To evaluate the accuracy and intermediate precision, we spiked AB13 at concentrations ranging 1.25–10 µg/mL into CCF from a parent CHO cell line to mimic transfectant samples. We tested those samples in three independent experiments after diluting 1/5 with binding buffer, targeting the dynamic range of the AB13 curve. As shown in Table 1, the assay has acceptable intermediate precision and accuracy. For most samples, the % RSD was ≤15%, and recovery was within 85 to 115%. Although they remained acceptable, recovery and precision slightly decreased at lower AB13 concentrations, with RSD values of 19% and recovery at 76%. Samples tested neat gave comparable results. Together, the results demonstrate that this assay consistently and accurately determines the productivity of transfectant clones from cell culture fluid.
Table 1: Intermediate precision and accuracy results from spiked samples; cell culture fluid (CCF) spiked with human IgG (AB13) at concentrations ranging 1.25–10 mg/mL tested in three independent experiments; spiked samples were tested neat or at 1:5 dilution.

Table 1: In termediate precision and accuracy results from spiked samples; cell culture fluid (CCF) spiked with human IgG (AB13) at concentrations ranging 1.25–10 mg/mL tested in three independent experiments; spiked samples were tested neat or at 1:5 dilution. ()
In addition, a side-by-side comparison of the HTRF and ELISA assays showed the two methods to be comparable. We tested eight cell line development samples for IgG productivity using both assays with the same antibody standard for both. That standard was a purified form of the samples being analyzed. As Table 2 shows, comparable results were obtained from both methods, with a percent difference between the two data sets of ≤20%.
Table 2: Side-by-side comparison of the HTRF assay and ELISA; results shown from 10 cell-line development samples tested in both assays.
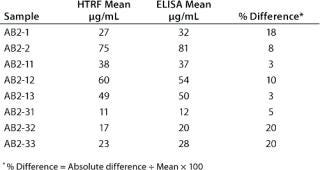
Table 2: Si de-by-side comparison of the HTRF assay and ELISA; results shown from 10 cell-line development samples tested in both assays. ()
Assuming no significant differences in cell viability and growth patterns, we assessed the ability of this assay to predict top-producing clones. The top 48 Fc-producing clones identified from an HTRF binding assay screen were expanded in culture. We then assessed productivity of transfectants after several days of culture with feed medium (single-feed experiment) by a standard method: Protein A affinity high-performance liquid chromatography (ProA HPLC). Table 3 presents results of that evaluation, with clones ranked in order from the highest producing at the top. For the most part, the top 16 clones identified by the HTRF assay remained at the top in the single-feed/Pro A HPLC experiment. Overall the disparity between those two data sets was minor. This result qualifies the HTRF assay as a useful tool in identifying top Fc-producing clones.
Table 3: Capability assessment compares results obtained from an HTRF screen and a single-feed ProA HPLC assay; top 48 IgG-producing clones from an HTRF screen are ranked with the highest-producing at the top and color-coded to track their position in the single-feed Pro A HPLC experiment (top 16 clones are in green, the next in gray, and the last in purple).

Table 3: Ca
Assay Throughput: As depicted in Figure 2, this assay is relatively simple, with fewer steps than heterogeneous immunoassays. Essentially, reagents and cell culture samples are added to 96–half-well plates, which are incubated for two hours to overnight and then read. Because there are so few steps, the assay can be completed in a short period and chances of introducing error are lower. In addition, this assay is performed as a homogenous mixture, so there is no washing or cell clarification.
Notably, no significant difference was observed between samples incubated for two hours and those held overnight (Figure 11). The resulting flexibility of timing is an added benefit that allows for a large number of plates to be processed at a time without compromising assay performance. We have found that read time is a potentially rate-limiting step that depends on the HTRF plate reader used. Some readers take <10 seconds per plate, whereas others can take more than a minute per plate. Even so, compared with an ELISA format, this assay is rapid and far less complicated to automate.
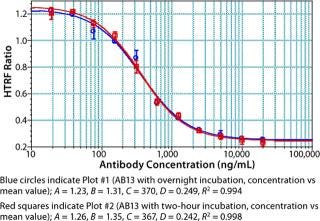
Figure 11: ()
A standard curve is typically generated with each experiment to determine sample titer. In an automated platform, generating that standard curve could hinder throughput. Building the standard curve into the system may counteract this issue. To assess the possibility of using a built-in standard curve, we assessed standard curves generated over several weeks using these parameters: A (maximum HTRF ratio), B (slope), C (effective concentration at half the maximum response, EC50), and D (minimum HTRF ratio) of the fitted curves. As Figure 12 shows, the results obtained for a standard curve are for the most part consistent. Minor variations were observed for the slope, but the EC50 and both the minimum and maximum HTRF ratio values remained consistent. This indicates that a built-in standard curve is feasible for quantification purposes. Howeve
r, routine monitoring on the system is advised, bearing in mind a standard curve is not needed to rank clones.

Figure 12: ()
The experiments described herein were performed using 96–half-well plates. Comparable results were obtained when the assay was performed using 384-well plates, indicating that it is scalable (data not shown). Use of 384-well or perhaps 1,536-well plates could further enhance throughput. With the use of 384-plates, it would be possible to determine productivity of a high number (50,000 or more) of transfectant clones in a short period. This would significantly improve cell line development by increasing the odds of finding a high-producing clone.
A cost analysis revealed that the overall cost of this HTRF binding assay is comparable to that of ELISAs. The cost of consumables, including HTRF reagents, was less than $15/plate (for 96–half-well plates).
A Powerful Alternative
Taking advantage of a TR-FRET based technology, we developed an assay that can be used instead of ELISAs to determine cell line productivity. This HTRF assay is rapid and robust, with acceptable precision and accuracy. A large number of transfectants can be titered with relative ease in a short period. Because many transfectants can be screened, the probability of finding a high-producing cell line is increased when using this method. In addition, the assay is relatively inexpensive, its costs being comparable to an ELISA’s. Furthermore, the new assay is a valuable tool for predicting high-producing clones. Thus, using it to determine productivity in cell line selection is a step toward process efficiency.
REFERENCES
1.) Browne, S, and M. Al-Rubeai. 2007. Selection Methods for High-Producing Mammalian Cell Lines. Trends Biotechnol. 25:425-431.
2.) Butler, M. 2005. Animal Cell Culture: Recent Achievements and Perspectives in the Production of Biopharmaceuticals. Appl. Microbiol. Biotechnol. 68:283-291.
3.) Farid, S. 2007. Process Economics of Industrial Monoclonal Antibody Manufacture. J. Chromatogr. B 848:8-18.
4.) Birch, JR, and AJ. Racher. 2006. Antibody Production. Adv. Drug Del. Rev. 58:671-685.
5.) Brezinsky, SCG. 2003. A Simple Method for Enriching Populations of Transfected CHO Cells for Cells of Higher Specific Productivity. J. Immunol. Meth. 277:141-155.
6.) Hanania, EG. 2005. Automated In Situ Measurement of Cell Specific Antibody Secretion and Laer-Mediated Purification for Rapid Cloning of Highly-Secreting Producers. Biotechnol. Bioeng. 91:872-876.
7.) Mathis, G. 1999. HTRF Technology. J. Biomol. Screen. 4:309-313.
8.) Olsen, C. 2006. HTRF Assays on the New SpectraMax M5e Multi-Detection Microplate Reader. Mol. Messenger:6-7.
9.) Mathis, G. 2001. Bioassays: Luminescent Materials in Encyclopedia of Materials. Sci. Technol.:538-542.
10.) Sittampalan, GS, SD Kahi, and WP. Janzen. 1997. High-Throughput Screening: Advances in Assay Technologies. Curr. Opinion Chem. Biol. 1:384-391.
11.) Mathis, G. 1995. Probing Molecular Interactions with Homogeneous Techniques Based on Rare Earth Cryptates and Fluorescence Energy Transfer. Clin. Chem. 41:1391-1397.
12.) Maurel, D. 2004. Cell Surface Detection of Membrane Protein Interaction with Homogenous Time-Resolved Fluorescence Resonance Energy Transfer Technology. Anal. Biochem. 329:253-262.
13.) Leblanc, V. 2002. Homogeneous Time-Resolved Fluorescence Assay for Identifying p53 Interactions with Its Protein Partners, Directly in a Cellular Extract. Anal. Biochem. 308:247-254.
14.) Lopez-Crapes, E. 2005. A Separation-Free Assay for the Detection of Mutations: Combination of Homogeneous Time-Resolved Fluorescence and Minisequencing. Methods 25:468-475.
15.) Lopez-Crapes, E. 2007. A Homogeneous Europium Cryptate-Based Assay for the Diagnosis of Mutations by Time-Resolved Fluorescence Resonance Energy Transfer. Nucl. Acids Res. 29:E70.
16.) Mathis, G..
17.) Harrison, RO, and BD. Hammock. 1988. Location-Dependent Biases in Automatic 96-Well Microplate Readers. J. Assoc. Off. Anal. Chem. 71:981-987.
18.) Lansky, D. 1999. Validation of Bioassays for Quality Control. Dev. Biol. Stand. 97:157-168.
You May Also Like

