Customized Yeast HCP Quantification with Biolayer Interferometry Using a Horseradish Peroxidase Substrate
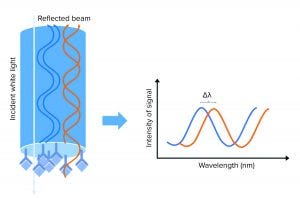
Figure 1: A biolayer interferometry (BLI) biosensor and its optical properties; left side shows the tip of the BLI biosensor, with a molecular binding event on the tip. White light is sent to the sensor tip, where it is reflected on an internal reference layer and on the molecular surface. Protein interaction causes a wavelength shift (∆λ) between the reflected beams. The ∆λ will be the output of the assay and reflect the change in mass on the sensor surface, allowing detection, quantification, and kinetic evaluation of protein interactions.
Biopharmaceuticals are the largest group of drugs under development (1), and the demand for new and safe drug products is high. The most common bacterial and mammalian cell lines for production are Escherichia coli, Chinese hamster ovary (CHO) cells, and yeast.
During a production bioprocess, a cell line expresses not only the molecule of interest, but also host-cell proteins (HCPs). They are considered to be impurities in a final drug product because they can affect the efficacy and safety of the drug. To ensure that a final drug product is pure, HCP concentration should be minimized by removal through a downstream purification process. A suitable analysis method must be used for monitoring HCP concentration throughout the purification steps. (Editorʼs Note: See the article by Scott and Krawitz in this monthʼs featured report for more information about HCP assay development).
Enzyme-linked immunosorbent assay (ELISA) has been the best-practice method, exceeding other methods with its high sensitivity. It is relatively inexpensive, has high throughput, and is easy to perform, but an ELISA requires long incubation times and several manual handling steps. Another immunoassay platform is biolayer interferometry assay (BLI). It is an optical method that can be performed almost completely automatically, enabling a two-hour HCP detection time from dilution to results instead of the one to two days needed for conducting an ELISA. The study below evaluates whether current ELISA methods can be set up on a BLI platform using process-specific antibodies and reagents.
BLI Optical Platform
The BLI platform is based on small, optical biosensors that are dipped into wells of a microtiter plate containing assay reagents (e.g., HCPs). Molecular assay setup is similar to that of ELISA, but molecular binding takes place on the tip of a biosensor (2). Working with BLI is straightforward because the only tasks required are to set up and run the software, select the desired number of sensors, and dilute reagents in a microtiter plate. The assay takes place in a BLI in about an hour. Dilution steps also can be set up in a liquid handler, leaving only the step of moving sensors and reagents into the BLI as a manual step.
When molecules bind the biosensor tip surface, white light is sent toward the tip of the sensor and is reflected on two surfaces: an internal reference layer and the surface where the molecular assay meets the surrounding solution. That creates a signal measured as a wavelength shift, which can be correlated to HCP concentration on a standard curve (Figure 1). That signal is a measurement of the optical thickness of the assay: The thicker the molecular layer is on the sensor tip, the higher will be the signals obtained. So as more molecules enhance the substrates in the molecular assay, the signal increases. Because measurement is taken inside a sensor and is not a measurement of refractive index, the signal is not affected by the surrounding media, making the method suitable for working in crude matrices.
One automated BLI platform that complies with 21 CFR part 11 is the Octet HTX device (from Sartorius Stedim Biotech). The company also provides kits for CHO HCP quantitation. Typically, such kits are used during early phases of drug development. To gain optimal coverage and sensitivity, however, HCP assays with custom-made polyclonal antibody reagents are needed. So, the study below focused on developing a fully customized BLI assay for quantification of yeast HCP. To investigate the performance of the assay, researchers compared yeast HCP ELISA and yeast HCP BLI (Figure 2).
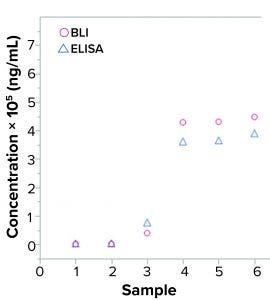
Figure 2: Quantification of yeast host-cell protein (HCP) samples in enzyme-linked immunosorbent assay (ELISA) and biolayer interferometry (BLI); six samples were analyzed for HCP with two assays, (yeast HCP ELISA and yeast HCP quantification by BLI) using the same interaction buffers. Measurements show results in the same order of magnitude.
ELISA Sandwich Assay Setup on the BLI Platform
The kit for CHO HCP quantification is based on a molecular sandwich assay with polyclonal anti-HCP antibodies. Biotinylated polyclonal anti-CHO HCP antibodies can be loaded onto a streptavidin coated sensor surface. The sandwich assay has several layers of binding molecules because as more mass binds to a sensor tip, the higher the signals become. An antibody labeled with horseradish peroxidase (HRP) is used in the final step. The antibody catalyzes a precipitating reaction of the signal- enhancing substrate 3,3′-diaminobenzidine (DAB).
From the BLI kit, researchers exchanged and optimized each reagent with the same reagents used in the corresponding ELISA. That included all reagents such as interaction buffers and labeling molecules — except for the signal-enhancing HRP substrate because 3,3′,5,5′-tetramethylbenzidine (TMB) used in ELISA is not applicable for the BLI platform (no precipitation). Sensor type and software settings and alternative signal-enhancing substrates also were evaluated. Researchers also developed a BLI assay such that all steps were exchanged for process-specific reagents (referred to below as a customized assay).
First, researchers investigated the standard curve according to its four-parameter logistic regression (4PL) fit and signal dimensions. High signals are desirable because they provide a broad analytical range and high signal-to-noise ratio (thus better sensitivity than can be obtained with lower signals). Figure 3 shows that signals obtained with the kit reached about 80 nm for an HCP concentration of 10,000 ng/mL, which is a high signal. For comparison, researchers quantified six samples with different yeast HCP concentrations using both customized yeast BLI assay and yeast ELISA (Figure 2).
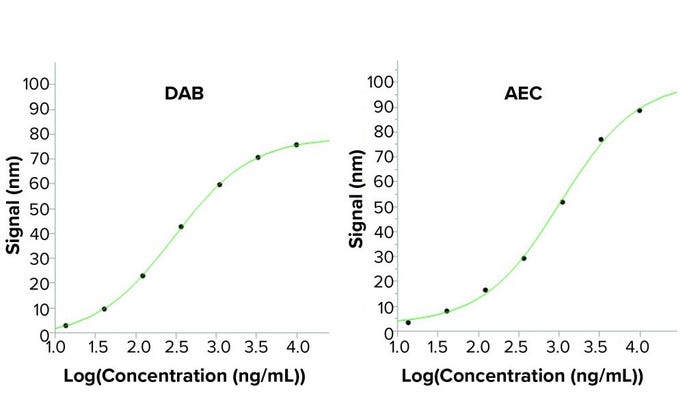
Figure 3: Standard curves from a BLI assay when using two different horseradish peroxidase (HRP) substrates; the enhanced sandwich assay used in the BLI assay uses a secondary antibody labeled with HRP. Two precipitating HRP substrates have been tested: the 3,3′-diaminobenzidine (DAB) used in the BLI kit and 3-amino-9-ethylcarbazole (AEC). Higher output signals are seen using AEC in the BLI assay, creating a higher sensitivity. Reading time was 100 seconds for the signal-enhancing step.
Customized Yeast HCP Quantification Assay
The standard curve produced with the yeast HCP quantification BLI method showed data with a good fit to a full 4PL plot and reproducible results. Results showed a high raw-data signals (up to 55 nm) for HCP concentration of 900 ng/mL, yielding a high sensitivity.
Figure 2 shows comparable levels of HCP detection between samples evaluated by BLI HCP quantification assay and those evaluated with traditional ELISA. Using those results, researchers made a preliminary evaluation of precision and lower limit of quantitation (LLoQ). That showed comparable values between the BLI HCP quantification assay and the currently used ELISA. The LLoQ reached down to only a few nanograms per milliliter for both yeast ELISA and BLI.
That assay is based on polyclonal antibodies using different platforms. Typically, high variation in bioanalytical methods is observed, and variations 20% are expected within bioassays (3). In this HCP quantification BLI assay, variation around 20% is expected, which might be reduced with further optimizations. The kit is directed at HCPs from CHO cells, and the customized assay was developed for yeast HCP quantification. Thus, fully customized assays can be developed for different production cell lines on the BLI platform with promising analytical parameters. That implies that the platform should be possible to use for HCP quantification from other cell lines (e.g., bacterial cells such as E. coli).
Use of HRP Substrate Provides High Assay Signals
HRP was used to amplify the signal in both the ELISA and the BLI assay for HCP quantification. The BLI assay needs a precipitating, insoluble product from the HRP-substrate reaction, and DAB is used often as an amplification substrate. Nevertheless, DAB is a hazardous, acutely toxic substance that must be handled in a fume hood.
To eliminate that safety risk, other precipitating HRP substrates were tested, including 3-amino-9-ethylcarbazole (AEC), a less hazardous substrate. AEC is used mainly for precipitating HRP reactions in immunohistochemistry. However, study researchers discovered that AEC also could increase BLI assay signals considerably. AEC not only improved the signal-to-noise ratio, but it also enhanced assay safety because it is less hazardous than DAB. Thus, no fume hood was required, facilitating automation of the assay. Figure 3 shows that the 4PL fits to the standard curves of the two substrates are similar, but the AEC shows a broader analytical range because of higher signals.
A small design of experiments (DoE) was set up to improve AEC conditions by investigating dilution buffer, AEC concentration, shake speed, and reading time. Researchers selected the middle-range HCP concentration and varied the four parameters in 12 experiments, using the commercial kit and varying only the signal-enhancing step. Results gave clear implications that using a low concentration such as 10% v/v AEC in a phosphate-buffered saline (PBS) or similar buffer provided the highest assay signals, rather than using a peroxide buffer (as is used for DAB). A reading time of 60 seconds gave consistent assay signals. A reading time of 600 seconds increased the signals significantly but risked sensor saturation. Shake speed did not seem to have an influence.
An ELISA Alternative
Use of optical sensors in bioanalysis is an evolving field. Increasingly, they are being implemented for sample analysis and characterization (e.g., BLI and surface plasmon resonance). BLI has different applications, including for drug purity evaluations (e.g., protein A bindings). Simpler assay setups also can be used with even more reduced time consumption than in the HCP quantification BLI assay.
BLI offers several advantages over ELISA such as reduced hands-on time and shorter overall time from days to hours. The Octet system can be fully automated with laboratory robots. Several steps of an ELISA also can be automized with liquid handlers, but long incubation times still are required. ELISA needs scheduled watching, but BLI is a “walk-away” assay that can run overnight. BLI provide real-time analysis data, and incubation times can be shortened to a minimum without compromising data quality. A generous amount of data is generated for each sample point, thus reducing the need for numerous control samples and replicates.
A considerable drawback of BLI is the high cost for both introducing and maintaining the system. The one-time cost and sensor prices are high compared with those for ELISA equipment. However, the BLI sensors can be regenerated and reused (3, 4), which has not been shown in this study. Reagents also can be reused because the sensors dip into the wells and do not consume reagents completely. The machinery has no tubing, eliminating the need for tubing maintenance required for other automated platforms. An automated and quick BLI assay also could be used for at-line analysis. That would create a fast feedback loop and could increase the possibility for earlier adjustments of a purification process. Today, sending samples back and forth and setting up an ELISA can take days or weeks.
Customized BLI HCP Quantification Assays
In summary, BLI works well for HCP rapid and sensitive quantifications. Fully customized assays with HCP host-specific antibodies and interaction buffers can be developed, improving hands-on and analysis times without compromising assay sensitivity, accuracy, and precision.
References
1 Tripathi NK, Shrivastava A. Recent Developments in Bioprocessing of Recombinant Proteins: Expression Hosts and Process Development. Front. Bioengin. Biotechnol. 7, 2019: 420; https://doi.org/10.3389/fbioe.2019.00420.
2 Concepcion J, et al. Label-Free Detection of Biomolecular Interactions Using Biolayer Interferometry for Kinetic Characterization. Comb. Chem. High Throughput Screen. 12(8) 2009: 791–800; https://doi.org/10.2174/138620709789104915.
3 Li J, et al. Detection of Low-Affinity Antidrug Antibodies and Improved Drug Tolerance in Immunogenicity Testing by Octet Biolayer Interferometry. J. Pharm. Biomed. Anal. 54(2) 2011: 286–294; https://doi.org/10.1016/j.jpba.2010.08.022.
4 Stefan K, et al. Development of a VHH-Based Erythropoietin Quantification Assay. Molec. Biotechnol. 57(8) 2015: 692–700; https://doi.org/10.1007/s12033-015-9860-7.
Eva Sjöblom is an intern in CMC bioanalysis, corresponding author Karen Duus is a senior scientist, and Jan Amstrup is principal scientist at Novo Nordisk A/S; [email protected].
You May Also Like
