Increasing MAb Capture Productivity
May 1, 2009
Continually increasing bioreactor titers is placing pressure on downstream processing, especially chromatography steps, to process the greater mass of protein produced. Whereas an order of magnitude increase has been seen in titers over the last few years, no similar increase has yet been achieved in the capacity of chromatography resins. Meanwhile, the industry is coming under rising pressure to reduce manufacturing costs and the resulting cost per gram of monoclonal antibodies (MAbs) produced.
Because of the specificity it offers, protein A affinity chromatography is well established and continues to be the predominant initial capture and purification step for commercial MAb purification. Although it is possible to address the increasing productivity needs through a combination of higher affinity capacity and running multiple cycles at short residence times, both attributes seldom can be maximized simultaneously.
PRODUCT FOCUS: Antibodies
PROCESS FOCUS: DOWNSTREAM Processing
WHO SHOULD READ: PROCESS ENGINEERS AND PLANT/PROJECT Managers
KEYWORDS: PROTEIN A, BINDING CAPA#CITY, AFFINITY, modeling
LEVEL: INTERMEDIATE
Here we explore the use of models to aid in developing a new higher capacity protein A resin (ProSep Ultra Plus chromatography media) by assisting in the selection of optimum resin characteristics. Such models also help in determination of optimum operating conditions to maximize productivity and/or reduce manufacturing costs.
Case Study
Millipore’s ProSep A affinity media are well established in the market and used in the manufacture of a number of licensed therapeutics. These resins are based on a controlled pore glass (CPG) matrix, which is a totally rigid base matrix with an open and uniform pore structure that readily allows modification of both particle and pore size. Previous development of a higher capacity variant (ProSep-vA Ultra media) focused on optimization of pore size. By decreasing that from 1,000 Å to 700 Å, internal surface area was increased by ~50% over that of the original product (ProSep-vA High Capacity media). The increase enabled greater protein A immobilization per unit bed volume, which provided for increased dynamic capacity at typical flow rates and residence times. With fermentation titers continuing to increase, however, the challenge was how to further increase the working capacity of this resin.
Having previously optimized pore size, we looked to see what other media characteristics might be manipulated to further increase capacity. Using transport models based on protein pore diffusion (Figure 1), we showed theoretically that using a smaller particle size should increase dynamic binding capacity, especially at shorter residence times (1,2). The validity of those model predictions was confirmed by production of prototypes and comparison with experimental results for dynamic binding capacity (Qd) (Figure 2).
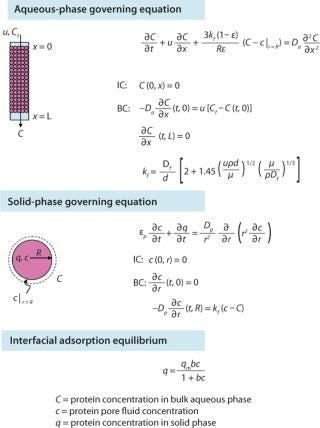
Figure 1: ()
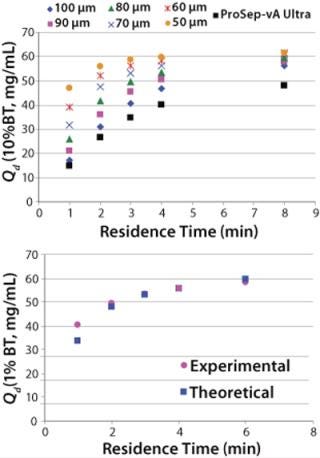
Figure 2: ()
The downside of using smaller particles is a corresponding higher column pressure drop. However, the advantage of the controlled pore glass base matrix of ProSep media is its rigidity and thus inherently low and predictable pressure drop. With the existing 100-µm particle used for ProSep-vA media, a flow rate of 2,000 cm/hr is achievable at a 20-cm bed height, which is greatly in excess of typically used flow rates (300–700 cm/hr). Modeling column pressure drop (Figure 3) showed that a 60-µm particle should still enable flow rates of 750 cm/hr at the 20-cm bed height, indicating that the unused flow capability of the 100-µm particle could be usefully traded for higher capacity. So we selected 60 µm as the base particle size for the new resin.
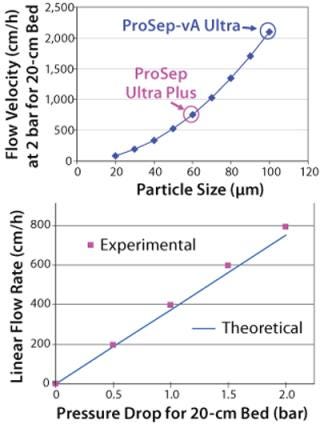
Figure 3: ()
Comparing breakthrough curves and dynamic capacity with residence time plots confirmed that the smaller-particle resin achieved significantly higher capacities than did the earlier ProSep-A media variants as well as other available protein A affinity media (Figure 4). At the same time, large-scale (1.6-m diameter) column trials confirmed that actual packed-bed pressure drop was similar to that predicted from the theoretical model (Figure 3).
Figure 1:
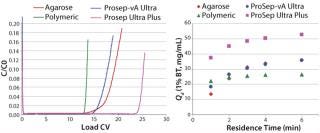
Figure 4: ()
Process models were subsequently used to explore feasible operating windows for the protein A capture step, which may be constrained by various factors (for example resin, column, or system pressure limits; process times; pump capacities; and the number of process cycles). We aimed to determine the optimum conditions for maximizing productivity and reducing the cost of antibody manufacture.
First, as seen in Equation 1and Table 1, we used a two-parameter equation (3) relating measured dynamic capacity (Qd) to residence time (tr), which could then be fed into the more expansive process model in Figure 5. For illustration, we show here a case study of a 10,000-L bioreactor with a titer of 5 g/L (as listed in the “Case Study” box).
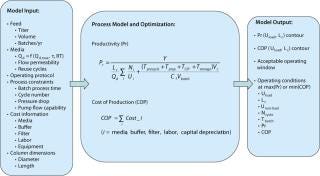
Figure 5: ()
Table 1: Model-fitted parameter values; a low value for t means that dynamic capacity is maintained at shorter residence time, and a high value for t means that capacity drops off more rapidly at shorter residence times.
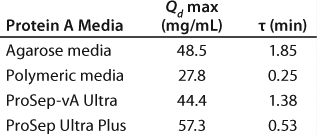
Table 1: Mo
The model can be used to explore a range of conditions within set process constraints. For example, the effect can be determined for column size and loading flow rate on either productivity (grams of MAb per hour per unit resin volume) or cost of production (US dollars per gram of MAb). Contour plots illustrating the model output (Figure 6) show that the operating conditions for maximum productivity and minimum cost of production differ somewhat. In both cases, however, a broader window is observed for the CPG-based ProSep resins than for alternative media, which translates into a greater process flexibility for choosing column size and flow rate.
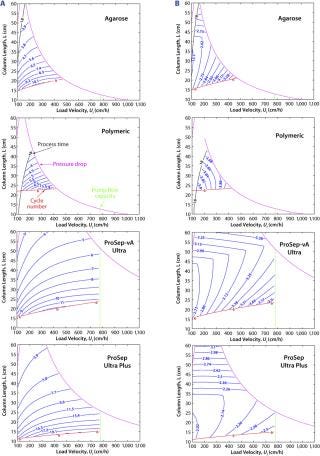
Figure 6: ()
In all cases, the model indicates that productivity is maximized by using shorter columns and higher linear velocities, whereas production cost is minimized by using slower linear velocities and somewhat longer columns. This necessitates a compromise whereby the cost of production needs to be balanced against productivity or processing time.
Table 2 shows the optimum productivity or cost of production expressed either as a global optimum, in which both the loading velocity and bed height for a given column diameter are varied, or as an optimum for a fixed 20-cm bed height, in which only the loading

velocity is varied. In both cases, the smaller-particle ProSep Ultra Plus media provides higher productivity and lower operating costs than both the existing ProSep-vA resin and other protein A media. A range of column diameter scenarios (1.0–1.8 m) was also modeled (data not shown). In all cases, the higher-capacity ProSep Ultra Plus resin provided both higher productivities and lower production costs.
Table 2: Optimal operations for processing a 10,000-L, 5-g/L titer batch using a 1.4-m diameter column; “X” indicates cannot meet process requirement.

Table 2: Op timal operations for processing a 10,000-L, 5-g/L titer batch using a 1.4-m diameter column; “X” indicates cannot meet process requirement. ()
We also used the model to explore the effects of varying titers on both productivity and production cost (Figure 7). Here it is interesting to see that at low titers performance of all resins are very similar, but as titers increase then the differences become more apparent. The higher-capacity ProSep Ultra Plus resin provides both improved productivity and lower production costs.
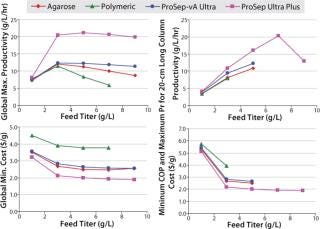
Figure 7: ()
Clearly the model shows that the key driver to the improved performance of the new resin is predominantly its higher capacity, which allows for using not only less resin volume but also less buffer consumption. This may be particularly beneficial in biopharmaceutical plants that are constrained by either the volumes of their buffer tanks or their water-for-injection (WFI) supply.
CASE STUDY INFORMATION
Feed
Titer: 1–10 g/L
Batch Volume: 10,000 L
Batches/Year: 50
Resin
Loading Capacity: 90% of Qd (1% BT)
Flow Rate: 100–1,100 cm/h (resin dependent)
Reuse Lifetime: 200 cycles
Column
Diameter: 1–1.8 m
Length: 10–60 cm
Process Constraints
Pump Fow Capability: 200 L/min
Maximum Cycles/Batch: 6
Batch Processing Time: 24 h (including six hours to start/finish)
Process Operations Precycle: Strip 3 column volumes (CV), elute 3 CV, and equilibrate 5 CV at umax (maximum operable velocity)
Bind–Elute Cycle: 0.9 Qd (1%) CV at uload; wash 9 CV at umax; elute 5 CV at uload; clean 5 CV at umax; reequilibrate 5 CV at umax; sanitize 5 CV (every batch)
Cost of Key Materials
Resin: US$10,000/L
Buffer: US$1.00–2.00/L
A Free Planning Tool
Modeling is a useful tool in the design and development of new chromatography media and in defining the optimal process conditions for efficient purification and hence therapeutic drug manufacture. Millipore’s new CPG-based ProSep Ultra Plus resin was developed based on modeling analyses to provide improved performance over both earlier product variants and other available media. This should offer users the opportunity to alleviate processing bottlenecks, increase their operational flexibility, and improve their plant economics.
Of course, this case study provides only an illustration of the model’s capability and the help it can provide to those exploring the benefits of alternative resins and/or optimizing operating regimes. The results of such models always depend on specific input variables, which change from case to case. We are pleased to make the model freely available to users and welcome feedback on how it may be further improved.
REFERENCES
1.) LeVan, Carta Yon. 1997.Adsorption and Ion ExchangePerry’s Chemical Engineers HandbookSeventh Edition, Sect. 16., McGraw-Hill, Columbus.
2.) McCue, JT. 2003. Evaluation of Protein-A Chromatography Media. J. Chromatogr. A 989:139-153.
3.) Iyer, H. 2002. Considerations During Development of a Protein A-Based Antibody Purification Process. BioPharm.
You May Also Like

