Scaling up biological processes from laboratory bench to process scale is complex and requires considering a number of factors to ensure process robustness. Due to variability among raw materials and processes, most process developers use generous safety factors to ensure that their systems are not undersized. Although that method can be reduce process risk, it is inefficient.
To improve process efficiency and reduce risk, we conducted a study to identify and quantify key factors that contribute to variability in filtration scale-up. The results from this investigation revealed that successful scale-up and improved process efficiency could be realized by
selecting small-scale process development tools that maximize performance consistency
modeling filter scale-up device performance differences
instituting controls to minimize manufacturing variability
accounting for process hydraulic effects associated with fittings and elevation.
PRODUCT FOCUS: ALL BIOLOGICS
PROCESS FOCUS: DOWNSTREAM
WHO SHOULD READ: PROCESS DEVELOPMENT AND MANUFACTURING
KEYWORDS: MICROFILTRATION, SCALE-UP, VARIABILITY, MEMBRANE FOULING
LEVEL: INTERMEDIATE
PROCESS DEVELOPMENT SCALE-UP CHALLENGES
Process developers favor small-scale sizing tools for initial evaluations of filter performance in process streams and for estimating membrane area requirements for a full-scale process. Ideally, test-volume requirements are minimized and small-scale process development devices scale linearly to corresponding larger-sized devices. However, in practice, linear scale-up of small to large devices is sometimes not achieved. Clean water flux in pleated cartridge devices has been documented to be as much as 50% lower than in the same membrane in 47-mm disk format (1).
Researchers have observed even greater gaps between disk and cartridge performance in cases where challenge stream conditions created significant fouling (2,3). Such differences add risk and uncertainty to scaling estimations, necessitating the use of large safety factors that increase costs.
FACTORS AFFECTING SCALING PREDICTIONS
A number of factors can complicate scaling predictions, including differences in flow geometries between small- and large-scale devices, differences between expected and effective (fluid accessible) filtration areas, pressure losses associated with plumbing and elevation, and variability in fluid properties and membranes. Proper accounting of these factors can decrease scaling discrepancies.
For example, experimental results indicate that modeling the hydraulic properties of pleated filtration devices (4) — accounting for pressure losses due to fittings — and modeling filtration performance on the basis of deduced membrane fouling mechanisms can significantly improve the reliability of scaling calculations (5). However, even taking into consideration those issues, large safety factors (typically between about 1.3 and 2) are commonly used to allow for variability in membrane performance and process conditions (5,6,7).
RESEARCH ON IMPROVING SCALING ACCURACY
To address process developers’ need for reliable and consistent scale-up, EMD Millipore conducted a study of filter-device factors affecting scaling between small- and large-scale devices. The study examined the effects of device design on scaling predictions and developed a strategy to maximize scale-up reliability.
Results revealed several important recommendations for achieving successful scale-up without introducing very large safety factors. Findings are as follows:
Scale-up uncertainties can be minimized using a small-scale device design that ensures negligible nonmembrane flow resistances an allowed operating range.
Discrepancies between reported and actual (effective) device filtration area should be identified and quantified for use in scale up calculations.
Variability in membrane performance can contribute significantly to large scale-up safety factors.
Thus, a small-scale device that is free of nonmembrane flow resistances and that represents the center of membrane performance provides greater reliability in scale-up and can help reduce the scale-up safety factor. Accounting for such factors will result in more consistent and reliable scaling and translates directly into reduced risk and greater operational efficiency.
For this study, we evaluated EMD Millipore Express SHR 0.1-µm filters, Express SHR with prefilter 0.5/0.1-µm filters, Express SHF 0.2-µm filters, and Express SHC 0.5/0.2-µm filters. For the small-scale tests, we used OptiScale-25 devices (EMD Millipore), which contain 3.5 cm2 of effective filtration area. We performed large-scale tests on commercially available 10-inch pleated cartridges. Table 1 lists the filter types and relevant attributes.
Table 1. Properties of 10-inch filters evaluated in this study
We ran water permeability tests on small- and large-scale devices using reverse osmosis (RO) purified water. Throughput testing involved three challenge streams (Table 2). We prepared all solutions in 200–500 L quantities using RO water. The media were not pretreated before the filtration studies and were used within two hours of preparation.
Table 2. List of challenge streams for throughput tests
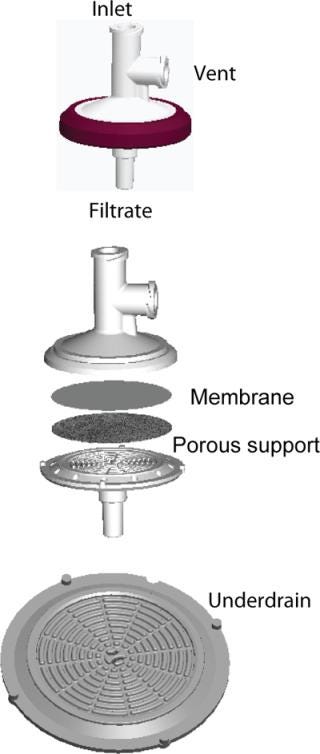
Figure 1 shows the OptiScale-25 device configuration. The device contains a 25-mm membrane disk and a nonwoven porous support that allows for unimpeded flow of filtrate to the underdrain and outlet. The underdrain structure provides mechanical support for the membrane without restricting liquid flow.
Figure 1. ()
Test Method: We tested both OptiScale-25 devices and 10-inch filters for clean water permeability at 10 psid and 21–25 °C in a normal-flow (dead end) configuration. Following the water permeability test, we ran throughput tests using one of the challenge streams at 10 psid. That continued until the membrane permeability reduced by at le
ast 95% compared with the clean-water permeability.
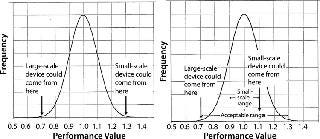
Minimizing Membrane Variability Effects: Estimates of process-scale filter sizing that are extrapolated from small-scale data should account for the possible range of membrane performance. Small-scale (25-mm) filter devices made with membrane from a well-defined portion of the known manufactured membrane distribution can significantly reduce scaling uncertainties associated with membrane variability (Figure 2).
Figure 2. ()
The left graph shows that if a random small-scale device contains membrane from the upper end of the performance distribution and a random large-scale device contains membrane from the low end of the distribution, then the large-scale device will exhibit a performance of 0.7/1.3 of the small-scale device. To ensure against undersizing the large-scale system, a safety factor of 1.3/0.7 must be applied. However, if the performance range of membrane designated for small-scale devices is narrowed (Figure 2, right graph), a smaller safety factor can be applied without risking undersizing the large-scale system. By design, all OptiScale-25 devices contain membrane that represents only the center of the membrane performance distribution, which provides greater consistency and reliability in scale-up and can allow for the scale-up safety factor to be substantially reduced.
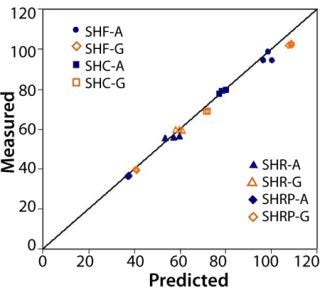
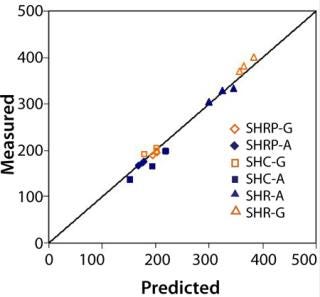
To demonstrate scaling accuracy, we tested OptiScale-25 devices and three 10-inch devices of each type listed in Table 1 for water permeability. The OptiScale-25 devices and the corresponding 10-inch devices contained membrane originating from the same membrane lot. Figure 3 shows that within-lot permeabilities of the OptiScale-25 devices closely tracked their corresponding 10-inch filter devices.
Figure 3. ()
Water Permeability:Figure 3 shows good agreement between the predicted and measured permeate water flow rates for each of the membrane–filter types tested. Predicted values were based on the ratio of effective filtration areas of 10-inch cartridges to OptiScale-25 devices — corrected for housing hydraulic pressure losses and accounting for pleating effects (per the method described in reference 4).
Throughput: We evaluated bioprocess fluids representing high fouling applications for the majority of filter types listed in Table 1. Figure 4 shows measured versus predicted throughput after ~30 minutes of filtration and a minimum 95% flux decay. Results showed excellent agreement between predicted and measured values.
Figure 4. ()
TEST, DON’T GUESS
Scaling predictions of large-scale membrane filtration devices performance from that of small-scale devices must account for a number of factors, including differences in flow geometries between small- and large-scale devices, extra-membrane flow resistances, and nonidealities in fluid-accessible membrane area. Variability in membrane and fluid properties can also add uncertainty in scaling estimations.
Our results indicated that successful scale-up could be realized by proper small-scale device design; using models that simulate the effect of device design characteristics on filter performance; defining a narrow performance range for small-scale devices; and proper accounting of hydraulic effects associated with fittings and elevation. Results showed excellent agreement between measured and predicted 10-inch filter performance using OptiScale-25 devices. OptiScale-25 devices consume about four times less fluid than 47-mm discs and enable lower scale-up safety factors that translate directly into system size and cost savings.
About the Author
Author Details
Corresponding author Sal Giglia is principal applications engineer at EMD Millipore, 80 Ashby Road, Bedford, MA 01730, 781-533-2564, [email protected][email protected]. Laurelle Sciola is senior product manager of aseptic processing at EMD Millipore.
REFERENCES
1.) Brown, AI. 2009. Membrane Pleating Effects in 0.2-µm Rated Microfiltration Cartridges. J. Membr. Sci. 341:76-83.
2.) Jornitz, MW. 2004. Testing for the Optimal Filter Membrane. Gen. Eng. News 24:50-51.
3.) 2009. Evaluating the Scalability of 0.1-µm Rated Membrane Filters. BioPharm Int:36.
4.) Giglia, S, and D. Yavorsky. 2007. Scaling from Discs to Pleated Device. PDA J. Pharm. Sci. Tech. 61:314-323.
5.) Rajniak, P. 2008. Sterilizing Filtration: Principles and Practices for Successful Scale-Up to Manufacturing. J. Membr. Sci. 325:223-237.
6.) Jornitz, MW, TH Meltzer, and W. Garafola. 2009. The Proper Use of 47-mm Flat Disc Filters in Filter Sizing Studies. BioPharm Int. 22:28-34.
7.) Lutz, H. 2009. Rationally Defined Safety Factors for Filter Sizing. J. Membr. Sci. 341:268-278.
