How Geography Affects the Cost of Biomanufacturing
June 1, 2010
As the biopharmaceutical industry undergoes restructuring, its focus shifts to the efficiency of drug development and overall costs of delivering affordable medicines. A question often raised concerns the manufacture of drug substances overseas to tap into a cheaper manufacturing base (1). There are many issues to consider when looking at overseas locations, such as intellectual property (IP), the availability of skilled labor, and the emergence of new markets. The situation is more complex with biopharmaceuticals because the products themselves are difficult to characterize, which means close scrutiny of all systems manufacturing, quality, and supply chain. However there are successful overseas manufacturing companies supplying vaccines through World Health Organization (WHO) programs, and blood fractionation facilities and established biopharmaceutical manufacturing operations are already operating in Cuba, China, Japan, Singapore, and India.
I’m focusing on the economic aspects of biopharmaceutical manufacturing and looking at the influence of geography on them. At my consultancy, 90% of the biomanufacturing models we have built over the past 11 years have been geared to costs in Western nations. But we have been asked to look at the impact of geography on particular biopharmaceutical manufacturing operations in Japan and the purification of blood fractions in various locations around the world. Recently we were asked to present at a conference in South Korea on the financial implications of disposable technologies and the influence of location.

Using the BioSolve process modeling and cost-of-goods (CoG) platform, we were able to take a “typical” monoclonal antibody process and very rapidly analyze the impact of geographical location on its CoG. The process-driven BioSolve system methodology remains the same no matter the process being configured. It has a large user base, and we know from the feedback we’ve received that users are confident with this approach and the methods used to calculate CoG. So we can derive a high degree of confidence that outcomes of our assessment are realistic subject to the correct assumptions and data sets being used for analysis.
Case Study
I’ve used the BioSolve tool to evaluate the individual cost contributions of specific single-use technologies on manufacturing costs, comparing them with stainless steel systems and taking into account regional differences in India, China, the United States, and the European Union. By accounting for scale, we can identify the cost and savings of single-use technologies such as hold bags, mixers, and bioreactors as a function of scale and region. The process is based on a sequence published by Morrow (2).
Assumptions used for this exercise are
three 2,000-L reactors, 2-g/L titers, and 80% capacity use
one purification train
mode of solution make-up (media per batch and buffer per operation)
basis of costs (materials, consumables, equipment, and so on) for vendors and suppliers, benchmarking information from >10 biotech operations.
To understand the impact of geography, it is necessary to review how we build up the CoG and then evaluate the impact of geography. The cost model is configured as modules in the BioSolve program (from BioPharm Software Solutions, a business unit of Biopharm Services) as in Figure 1 (3). This methodology has the advantage of being scalable, flexible, user-friendly, and transparent. The key modules that directly affect cost are capital, materials, consumables, and labor. When considering each in turn, we can assess the impact of geography on cost and define the assumptions used in the model.
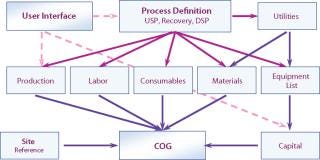
Figure 1: ()
Capital estimation is based on total equipment purchase costs and total cost factored from that. Based on experience gained from building pharmaceutical facilities in different locations, it is fair to assume that key manufacturing equipment is sourced from the West, so related costs do not vary significantly from country to country. Capital engineering costs (installation, pipework, HVAC, control, electrical, construction, and fit-out) are factored in using benchmarked percentages of total equipment purchase costs. The key variable is construction costs for the building. Some published benchmarks look at the costs of building in different countries (Table 1), and I applied these in my analysis (3).
Table 1: Construction costs for industrial buildings
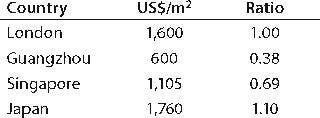
Table 1: Construction costs for industrial buildings ()
Materials and Consumables: The bulk of materials and consumables costs are driven by components such as protein A resin, media for cell culture, and filters (Table 2). These are specialized items from specific suppliers that are not easily substituted, so I used the standard Western costs in all cases.
Table 2: CoG cost breakdown for stainless steel option (UK costs)
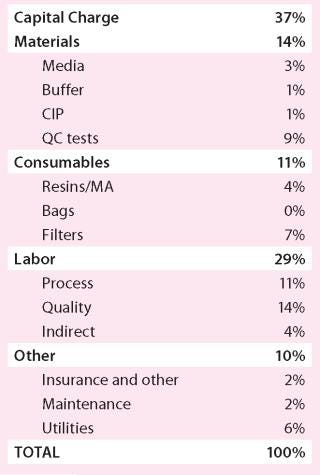
Table 2: CoG cost breakdown for stainless steel option (UK costs) ()
Labor costs vary according to country. Table 3 lists the actual values I used, based on a number of sources (4,5,6).
Table 3: Salary costs in different countries

Table 3: Salary costs in different countries ()
CoG Analysis
Using the bases described above, consider the potential impact of building a stainless-steel–based facility in the United Kingdom, China, Japan, and Singapore. Table 4 compares the capital required for a new build and the CoG for products manufactured in each location. As expected, purely on an economic basis China is the cheapest place to put a facility, closely followed by Singapore, with little real difference seen between Japan and the United Kingdom. On reviewing the cost breakdown, it is clear that the largest reduction in both the Chinese and Singaporean cases is associated with reduced labor charges (Table 5).
Table 4: Capital and cost of goods for a stainless steel facility
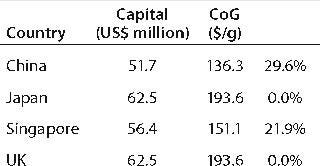
Table 4: Capital and cost of goods for a stainless steel facility ()
Table 5: CoG breakdown
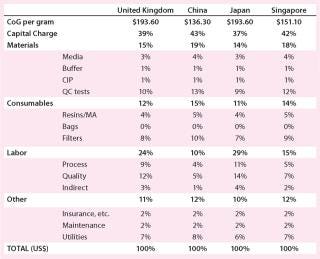
Table 5: CoG breakdown ()
Currently it appears that Asian companies are still predominately using stainless steel for their facilities. Having set up the BioSolve program for these different geographical regions, we were able to assess the impact of disposable technologies on manufacturing costs and determine whether it was an impediment to their use. This study has purposely ignored the impact of importation taxes on consumables as well as other taxes and grants, but they would have to be factored into a more in-depth study. Currently import taxes are not thought to be significant in the countries evaluated.
Table 6 summarizes the data generated, showing that savings are possible in each region as the move is made from stainless steel to using disposables. The pattern of savings appears to be similar, with disposable bioreactors and hold bags for buffers and media offering the greatest savings. Interestingly, the extent of savings is reduced in line with the lowered cost of manufacturing.
Table 6: Costs by country and technology
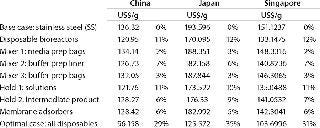
Table 6: Costs by country and technology ()
It was the objective of my analysis to understand the impact on biomanufacturing cost of a facility’s location. As expected, there are differences among different countries, with cheaper labor and building costs the key factors for savings. Those savings are significant for stainless steel facilities, amounting to a ≤29% reduction when comparing China with the United Kingdom. Further savings are achievable in the Asian countries through the use of the appropriate disposable technologies, although the overall savings are reduced there when compared with those achieved in the West. The implication here is that when comparing like-for-like disposable facilities in the United Kingdom and China, the overall reduction will drop from the 29% figure.
This approach can readily be applied to any other country in the world, and it allows us to rapidly assess the cost to manufacture biopharmaceuticals in any given country. Finally, a word of caution: We have used one specific example for this analysis. The actual numbers will vary depending on the scale of operation, the nature of a facility, and the products it makes.
About the Author
Author Details
Andrew Sinclair is president of Biopharm Services, Lancer House, East Street, Chesham HPS 1RD, United Kingdom; 44-14947-932-43, [email protected]. He founded BioPharm Services in December 1998 to develop a technology-based service focused on all aspects of biopharmaceutical manufacturing. Sinclair has >25 years experience working for manufacturing operations (Lonza, Eli Lilly, and GlaxoSmithKline) and contractors (Kvaerner and Jacobs engineering).
REFERENCES
1.) Sinclair, PA, and MR. Monge. 2010. Delivering Affordable Biologics from Gene to Vial. BioProcess Int. 8:16-19.
2.) Morrow, KJ. 2002. Industrial-Scale Antibody Production Strategies. Genet. Eng News 22:8-71.
3.).
4.) 2009.Section 5: Wages and Labour Costs Databook of International Labour Statistics 2009, Japan Institute for Labour Policy and Training, Tokyo.
5.) Ceglowski, J, and S. Golub. 2007. Just How Low Are China’s Labour Costs?. The World Economy 30:597-617.
6.) Singapore Salary Handbook 2008/2009, Kelly Services, Singapore.
You May Also Like

