https://www.istockphoto.com
Injectable-drug formulations for both subcutaneous and intravenous administration are designed to be consistent with the number of solutes present in human tissue. Such consistency with physiological conditions is achieved by adding an appropriate amount of salt and/or sugar to attain the desired tonicity. Care must be taken to prevent exposure of cells to either hypotonic or hypertonic formulations that could cause lysis or shrinking, respectively (1).
Injection of formulations that deviate from human-plasma osmolality (295 mOsm) can cause pain upon injection (2–4). Thus, a reliable way to measure osmolality is crucial to parenteral drug-product development. Osmolality is a valuable in-process parameter that can pinpoint deviations during formulation compounding and can indicate excipient coconcentration or exclusion during ultrafiltration/diafiltration (UF/DF) preparation steps (5). Consistent osmolality measurements of drug products provide some reassurance that their solute levels do not change.
Degradation of relatively unstable excipients can result in drug formulations with increased osmolality. For example, sucrose can experience inversion at elevated temperatures and degrade to glucose and fructose, which increase osmolality by a factor of two (6). Such inversion occurs at the relatively high temperatures used to assess stability of protein drugs, thus complicating predications of degradation rates at refrigerated temperatures. In one study, glycation after storage at 37 °C increased aggregation (7). Thus, monitoring osmolality is an important part of stability testing as well.
Osmolality is measured routinely by either freezing-point depression (FPD) or vapor-pressure depression (VPD) (3). With FPD, osmolality is determined based on the lower freezing point of a solution compared with that of pure solvent (usually water). The phenomenon is directly related to the number of solute molecules dissolved. Thermodynamically, adding solutes reduces the solvent’s chemical potential, which in turn reduces the solution’s freezing point. FPD osmometer measurements are best suited to dilute, nonviscous, particulate-free solutions — assuming that the cryoscopic constant of water does not change upon solute addition.
By contrast, VPD osmometry is based on the principle that adding solutes reduces the solvent vapor pressure with a corresponding increase in solution osmotic pressure. The vapor-pressure reduction is correlated to the amount of solute dissolved in a solution. VPD methodology is better suited to measurement of viscous samples that are more problematic with FPD instruments (8).
In general, both FPD and VPD instruments are reliable for solution conditions that contain lower concentrations of solute (9). As concentrations increase — or as large macromolecules such as polymers and proteins interact nonideally with water — osmolality measurements can become less reliable as complications arise (10, 11). Nonideal solute–solvent interactions can lead to inaccurate measurements with both FPD and VPD instruments (9).
Antibody drug products requiring high protein concentrations for efficacy have become ubiquitous in the pharmaceutical industry (5, 9, 12). Proteins are known to exhibit nonideal behavior at such concentrations, including elevated viscosities and tendencies to aggregate (9). Nonideal protein–protein interactions related to excluded volume effects, electrostatic and colloidal interactions, and combinations thereof usually are cited as reasons for that behavior. Published studies have reported that the measured osmolality of highly concentrated proteins deviates from expected values (12, 13). Likewise, an inability of highly concentrated protein solutions to freeze for FPD measurements has been observed (14).
We compared osmolality measurements of four high-concentration monoclonal antibodies (MAbs) using both FPD and VPD osmometers. At high protein concentrations (~150 mg/mL and above) both instruments’ measurements showed substantial deviations from calculated osmolalities, and solutions failed to freeze for the FPD measurements. Polymers and sugars exhibited similar nonideal behavior at high concentrations. We found that viscosity was better for predicting reliability of FPD measurements than protein concentration was. Neither the onset of melting in FPD nor decreased water activity was identified as the root cause of those osmolality-measurement deviations. Instead, we propose that samples were not given enough time to freeze in the FPD sample chamber.
Methods and Materials
Reagents and Materials: MAb samples (100 mg/mL) diafiltered with 10 mM acetate and 9% sucrose at pH 5 were concentrated to ~225 mg/mL and then diluted to concentrations of 120–225 mg/mL. Protein concentrations were determined by UV absorbance at 280 nm. Medium-viscosity sodium carboxymethyl cellulose (NaCMC), D-sorbitol, and sucrose were purchased from MilliporeSigma; polyvinylpyrrolidone (10K-PVP) came from Ashland; and Carbopol 971P NF polymer came from Lubrizol Advanced Materials.
Protein Concentration: We measured 40-µL aliquots using a SoloVPE instrument from C Technologies interfaced with a Varian Cary 50 Bio UV–visible spectrometer. Protein concentrations >150 mg/mL were diluted before measurement; otherwise, no sample dilution was necessary with this instrumental method, which gave results in mg/mL.
Osmolality Measurement: We used an Advanced Instruments 3250 single-sample osmometer for FPD measurements after all samples were sterile filtered with 0.2-µm cellulose filters to remove extraneous particles. During measurement, a 250-µL sample is supercooled, then a freeze-pulse shock is introduced to crystallize the sample partially. When the temperature reaches a plateau, it is measured as the true freezing point. We performed an average of three measurements for each sample point. Instrument operation was verified with 100-, 200- and 290-mOsm standards before sample data collection.
We used a Wesco Vapro model 5600 osmometer for VPD measurements. The instrument measures 10-µL samples at room temperature, detecting a vapor-pressure decrease from solutes relative to that of pure solvent. Again, we performed an average of three measurements for each sample point and verified the instrument operation using 100-, 200-, and 290-mOsm standards before sample data collection.
Osmolality Calculations: We determined the theoretical osmolality of each solution using Equation 1 (11):
ξi = 1,000 × Σi (mi × vi × φi).
That relates osmolality of the solute (ξi, mOsm/kg) to the molality of the solute (mi, moles solute/kg solution) and number of ions resulting from solute dissociation (vi) to the ith solute in the solution. The molal osmotic coefficient, φi, is a constant under ideal conditions, assuming noninteraction of water with the solute.
Viscosity Measurement: We used a RheoSense m-VROC viscometer with a B-chip flow cell to measure sample viscosity. The microsample viscometer measures absolute viscosity using an array of pressure sensors mounted on the base of a small, rectangular flow channel. The pressure drop from inlet to outlet correlates to viscosity by the Hagen–Poiseuille Law, as determined with RheoSense m-VROC software, version 3.2. Temperature in the flow cell was maintained by a 40-L ThermoCube liquid-cooled recirculating chiller set at 25 °C.
A 500-µL glass syringe was loaded with ~450-µL of sample and then locked into place on a B-chip for extrusion at a shear rate of 1,000 inverse seconds (s–1). The software processed the resulting viscosity reading. Before sample collection, validation measurements were taken for water. The samples exhibited Newtonian properties, with no observable shear thinning. Measurements shown in centipoise (cP) are each an average of three true replicate readings.
Differential Scanning Calorimetry (DSC): We measured DSC thermograms using a PerkinElmer Pyris Diamond differential scanning calorimeter. The instrument was calibrated by extrapolating the onset melting temperature (Tm) for dodecane (–10 °C to –9.3 °C) before the sample runs. Aluminum pans were filled with 35 µL of sample, then crimped and compared with an empty reference pan. The pans were cooled from 25 °C to –70 °C at a rate of 10 °C/min, then held at –70°C for 30 minutes, and scanned from –70 °C to 25 °C at 10 °C/min. We used Origin software to extrapolate the Tm of water for each sample.
Water-Activity Measurements: We measured water activity (aw) using an AquaLab Model 3B water-activity meter from Decagon Devices. The instrument applies a chilled-mirror method to determine the dew-point temperature of the gas phase in equilibrium with a sample, and infrared thermometry indicates the sample temperature. This instrument provides aw measurements in the range of 15–40 °C for bulk samples. The manufacturer specifies experimental errors for the nonvolatile sample block at ±0.005 aw. We calibrated the sample block frequently and corrected for drifts and offsets using saturated salt solutions and distilled-water samples covering the relevant range.
Oil Bath: We used a 4-L temperature-controlled oil bath from FTE Systems to determine the length of time necessary to observe a freezing-onset temperature for both proteinaceous and nonproteinaceous samples. For each solution listed in Table 2, 25 µL of sample was pipetted into a microcentrifuge tube and submerged in the oil bath at –6.5 °C. Samples were inspected visually at 2-, 5-, 10-, and 15-minute time points for indications of water-crystal formation.
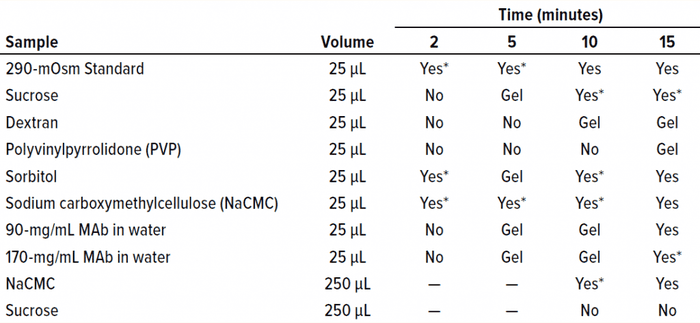
Table 2: Oil-immersion bath results show the time at which freezing began in each sample. A visual change was interpreted as indicating the approximate freezing onset time.
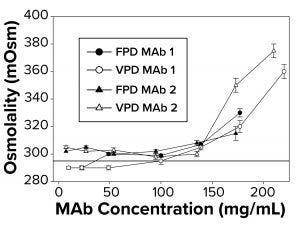
Figure 1: To measure osmolality as a function of increasing antibody concentration, samples were run in triplicate using both freezing-point and vapor-point depression (FPD, VPD) osmometers. The reference line at 290 mOsm signifies theoretical osmolality of the two antibodies. Samples failed to freeze above 145–175 mg/mL, depending on the antibody, for which no FPD readings are reported.
Results
Osmolality Deviations Correlated with High Viscosity: We have found that osmolality measurements of high-concentration MAbs tend to be higher than theoretical values or are not measurable by typical FPD osmometers because those formulations fail to freeze. Thus, further investigation was warranted to determine what factors might contribute to the osmolality deviations. So we compared calculated osmolalities of MAb 1 and MAb 2 samples (290 mOsm/kg) with experimental measurements by FPD and VPD osmometers. To a degree, the experimental values agreed with the theoretical values up to a protein concentration threshold (Figure 1). But measurements began to deviate from theoretical values at ~140–150 mg/mL for both MAbs (Figure 1), with the measured osmolality higher than the theoretically determined values. The FPD measurements appeared to underestimate osmolality to a greater extent than did the VPD instrument.
Additionally, the FPD osmometer generated a “failure-to-freeze” error for MAb 1 samples >140 mg/mL and for MAb 2 samples >175 mg/mL. We also noted a failure to freeze with smaller sample volumes but at higher protein concentration thresholds for both MAbs tested. Further work focused on FPD results and correlations with solution viscosity.
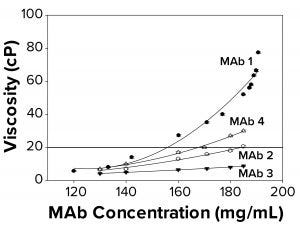
Figure 2a: To elucidate changes in MAb solution viscosity at 25 °C with 10 mM acetate and 9% sucrose at pH 5, as a function of increasing protein concentration, viscosity measurements were taken for MAbs 1, 2, 3, and 4. Each data point represents an average of three independent readings. The reference line signifies an observational threshold of 20 cP, above which samples failed to freeze for FPD measurement.
Protein–protein interactions are related directly to viscosity. As the degree of reversible protein self-association increases, so does solution viscosity (15, 16). We hypothesized that high viscosity and associated MAb self-association could be correlated with the failure-to-freeze observation in FPD samples. The four MAbs examined displayed different viscosity profiles ranging from ~12 cP to ~80 cP at the highest concentration measured. We found that FPD osmolality measurements were achieved easily for all samples at viscosities <20 cP, and a failure-to-freeze error was displayed for samples at or above 20 cP (Figure 2a). The buildup in viscosity with concentration for MAbs 1–4 followed a trend — MAb 1 > MAb 4 > MAb 2 > MAb 3 — suggesting that MAb 1 was most prone to self associate, resulting in a more viscous solution. The failure-to-freeze trend was consistent with that observation, suggesting that the more viscous MAbs were also the least likely to freeze in the osmometer.
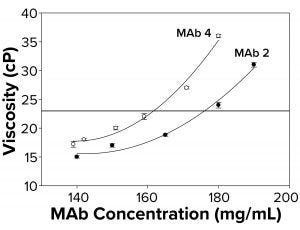
Figure 2b: To elucidate changes in MAb viscosity formulated in water at 25 °C as a function of increasing protein concentration, viscosity measurements were taken for MAbs 2 and 4. Each data point represents an average of three independent readings. The reference line signifies an observational threshold of 23 cP, above which samples failed to freeze for FPD measurement.
Because the presence of excipients can affect protein self-association dynamics, we measured osmolality for a subset of antibodies formulated in water alone. With those, we also observed a failure to freeze above ~23 cP (Figure 2b) similar to that for protein solutions with excipients. Samples with viscosity <23 cP gave osmolality readings of 50–60 mOsm in the FPD osmometer. The fact that MAbs 2 and 4 failed to freeze both in buffered solutions and in water suggested the presence of a general failure-to-freeze trend for high-protein concentration solutions irrespective of the presence of other solutes.
Failure to Freeze Dictated By High Solute Concentration, Not High Viscosity: To determine whether proteins were unique in the failure-to-freeze observation at high concentrations, we examined several cryoprotectants and polymeric excipients in solutions of similar viscosity (~20 cP) to that at which protein solutions failed to freeze. Note that high solution molarity appeared to be a factor in the inability of sucrose and sorbitol to freeze in the FPD osmometer at viscosities of ~20 cP (Table 1). Although that was a factor for sucrose and sorbitol, the trend did not hold for the polymeric excipients we tested. For example, dextran and PVP solutions both failed to freeze at molarities <0.1 M. NaCMC and Carbopol solutions did freeze. Both are effective thickeners that do not require high molarity to generate ~20-cP solution viscosities; smaller molecular-weight solutes (e.g., sucrose and sorbitol) do require molarities of 1.5–3.5 M in solution to reach similar viscosity.
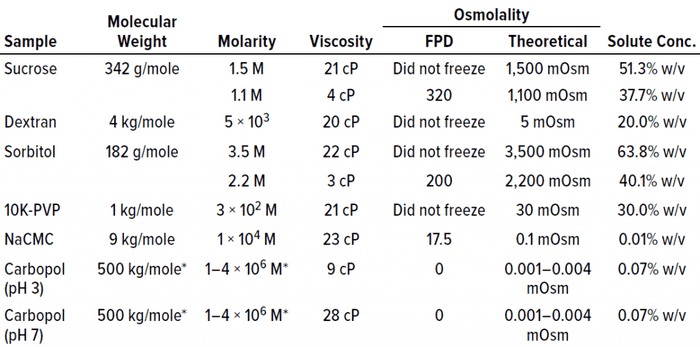
Table 1: Placebo solutions composed solely of polymer or polyol excipients are listed with their associated viscosity and osmolality measurements by freezing-point depression (FPD) osmometry. With the exception of NaCMC and Carbopol polymers, the placebo solutions failed to freeze above a threshold of about 20–25 cP.
The Carbopol example is interesting. It shows the lack of correlation between viscosity and freezing. Both lower viscosity (9 cP at pH 3) and higher viscosity (28 cP at pH 7) solutions of similar osmolality successfully froze in the osmometer (Table 1). The fact that Carbopol polymer and NaCMC both froze in the FPD osmometer despite their high viscosities indicated that increasing viscosity does not necessarily result in an inability to freeze under conditions tested for these polymers.
Additionally, high molarity is not a prerequisite for a failure to freeze in the FPD osmometer. The major factor that appeared to correlate most with the failure to freeze was the solute concentration percentage (% w/v in Table 1). Solutions with high solute concentrations tended not to freeze in the osmometer. The solute concentration also was excipient dependent, with higher solute concentrations needed for excipients such as sorbitol and sucrose than for polymeric excipients such as PVP and dextran before a failure-to-freeze error arose.
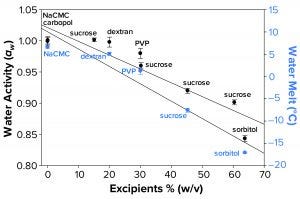
Figure 3a: Water activity (left axis, λ in black) and water-melt onset temperature determined by differential scanning calorimetry (right axis, λ in blue) were measured as a function of increasing solution molarity. Each data point represents an average of three independent readings with an error of one standard deviation.
Water Activity and FPD Not Correlated Fully with Failure-to-Freeze Observations: We hypothesized that FPD and water activity could be correlated with a given sample’s failure to freeze in the osmometer sample chamber. Figure 3a illustrates that increasing solute concentration caused an increase in FPD for sucrose and sorbitol, with the onset of melt by subambient DSC as a surrogate measurement. Analogously, increasing w/v of sucrose and sorbitol in solution gave lower water-activity measurements.
The failure-to-freeze phenomenon we observed occurred with excipient sugar solutions that displayed the greatest FPD and lowest water-activity values. However, not all solutions we tested followed this trend. Dextran and PVP solutions (both at low molar concentrations but with high solute levels) failed to freeze in the FPD osmometer despite only small changes in water activity and Tm. The FPD instrument uses a temperature of –6.5 °C to freeze samples, so we would expect solutions displaying Tm < –6.5 °C would fail to freeze.
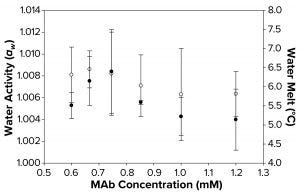
Figure 3b: Water activity (left axis, ο) and melt-onset temperature determined by differential scanning calorimetry (right axis, ●) were measured as a function of increasing MAb concentration. Each data point represents an average of three independent readings, with an error margin of one standard deviation.
Although a correlation between decreased aw, increased FPD, and failure to freeze can be linked with higher concentrations of sucrose and sorbitol, we found that no such correlation could be seen with MAb and polymeric solutions of different concentrations. The water-melt onset temperature for the MAb 1 solution was ~6 °C (Figure 3b), unaffected by MAb concentration within the tested range. Analogously, these MAb solutions demonstrated no trend in water-activity measurements. Although the freezing-onset temperature remained at ~6 °C with increasing MAb molarity, samples >1.0 mM (150 mg/mL) failed to freeze in the osmometer chamber. Thus, we believe that within the concentration range of the MAbs we tested, the disruption of water structure was not enough to decrease water activity measurably. Neither that nor FPD melt-onset temperature was a primary cause of the failure-to-freeze phenomenon in highly concentrated MAb solutions.
Kinetic Aspects of Freezing-Point Osmometry: The FPD osmometer used in this study holds samples in a cooling chamber for 5–10 seconds at –6.5 °C after a pulse shock to initiate freezing. We wanted to address a kinetic aspect of the FPD measurement by asking whether samples held for a longer period at –6.5 °C would also fail to freeze. So we simulated the conditions of the FPD osmometer in a temperature-controlled oil bath.
We submerged a subset of sample solutions from Table 1 in the oil bath and held them at –6.5 °C for 2–15 minutes. As Table 2 shows, we assessed visually the times of freezing onset for solutions of sucrose, sorbitol, and several polymeric excipients. In addition, we observed the onset of freezing for two highly concentrated MAb solutions. The same solutions that yielded failure-to-freeze errors (1.5 M sucrose, 0.5 mM dextran, 3 mM PVP, and 1.2 mM MAb 1) also failed to freeze in the oil bath after initial exposure and incubation of up to two minutes. Solutions that did freeze in the osmometer chamber (290 mOsm standard, 0.4 mM NaCMC, and 0.4 mM MAb 1) also froze in the oil bath with the initial temperature exposure. After extended incubation times of up to 15 minutes, all solutions froze even without freeze-pulse shocks. Thus, we believe that a kinetic aspect of the freezing event was important for the solutions examined herein.
Discussion
We have found that many MAbs fail to freeze in FPD osmometers when formulated at high concentrations and viscosities. In addition, a deviation from the expected osmolality is observed and most apparent in VPD osmometry. Our findings agree with those of Sahin, who reported measured deviations from the theoretical that were more notable with FPD than VPD osmometers (12).
Although we had an increasing deviation from theoretical in the VPD osmometer, we cannot state that a more pronounced trend was seen with FPD osmometry because of our failure-to-freeze errors. Those were not reported by Sahin, probably because of the lower volume requirements of the instrument used in that study (12). Note that we observed the failure-to-freeze phenomenon when using an FPD osmometer that requires a smaller sample volume; however, the phenomenon occurred at higher protein-concentration thresholds for both MAbs tested. The reason for that is unclear at present but could be related to instrument differences (e.g., during the measurement of freezing-point depression). Regardless, a general trend seems to be that MAb solutions at high concentration fail to freeze in FPD osmometers.
We thought that the failure to freeze and increases in viscosity of MAb formulations at high concentration might be correlated. As protein self-association increases, so too does the extent to which the molecules form transient networks, which in turn increases viscosity. Thus, viscosity appears to correlate with greater self-association of proteins (17). In our study, a viscosity threshold of ~20 cP was needed before the MAb solutions failed to freeze in the FPD osmometer. We believe this is the first time that viscosity of MAb solutions has been linked with an inability to freeze in FPD osmometers. Because protein–protein interactions are more prevalent at higher concentrations, as reflected by higher viscosities, we believed that a higher self-associated rate was a major factor in the failure to obtain osmolality readings.
Protein self-association accompanying high viscosities might not be the only factor leading to inaccurate osmolality measurement, however. In a crowded environment at high protein concentration, short-range forces (e.g., the Van der Waals force, dipole interactions, and the effect of protein-excluded volume) become more prevalent because the molecules are crowded (18–20). In addition, proteins are known to bind to counterions in highly concentrated solutions, as shown by the Donnan effect in UF/DF operations that creates uncertainties in determining the charge state of a protein (21). It is unclear whether an altered charge state would reduce the tendency of proteins to freeze at high concentrations, but that cannot be ruled out. Further work would be needed to investigate the possibility. Thus, through either electrostatic contributions or a combination of short-range forces and self-association, higher osmolality measurements than theoretical led to the failure-to-freeze errors in our study.
Osmometers are designed to obtain measurements based on an assumption that the molal osmotic coefficient (Equation 1) remains constant. In more dilute aqueous solutions of protein and/or other solutes, that is a reasonably good assumption providing measurements that are close enough to theoretical expectations. However, as solution nonideality increases — whether from disruption of water activity caused by protein–water or other solute–water interactions or from hydrogen-bonding changes in water molecules in the presence of solutes — the molal osmotic coefficient might increase, leading to osmolality readings that are higher than expected. In highly concentrated protein solutions, or when the percentage of solids increases in small-molecule or some polymer solutions, a failure-to-freeze event can occur. It appears to coincide with structural changes of solutes.
For example, fructose is known to change from a self-associated state and associated clusters to a percolated cluster state at ~53% w/v (22), which is close to the observed amount of sucrose present in a failure-to-freeze effect in our study (51% w/v in Table 1). Sucrose, some polymers, and proteins at high concentrations might self-associate and thus have less water surrounding each molecule. That may also coincide with known antifreeze-type properties of proteins and solutes such as sugars in affecting the activity of water and its structure in the frozen state, as reported by Sahin (12).
Viscosity appeared to be a factor both when osmolality seems higher than anticipated and when protein solutions will not freeze at high concentration in FPD osmometers. So we proposed that excipients that increase solution viscosity also would fail to freeze at high concentration in the osmometers we used. Furthermore, we speculated that water activity and the DSC-measured melting onset of water ice in solutions might correlate with that inability to freeze. However, we found that the percentage of solute solids content (% w/v) was more relevant than molarity in influencing a given solution’s failure to freeze in FPD osmometers. Because some excipient-only solutions (e.g., with Carbopol polymer and NaCMC) froze in the FPD osmometer despite viscosities ≥20 cP, increasing viscosity did not seem to dictate an inability to freeze under the conditions tested. Instead, our data suggest that for excipient-only solutions, high solute % w/v led to the failure-to-freeze observation.
At high enough % w/v solute concentrations, it is possible that the combination of disrupted water structure (by competing hydrogen bonds) and the antifreeze-like properties of solutes such as sorbitol dramatically lowers the freezing point of the solution (23). That could in turn generate a failure-to-freeze error in the FPD instrument we used. Note that the greatest disruption of water structure as indicated by water activity and the DSC-measured melt temperature occurred in highly concentrated sorbitol and sucrose solutions. To further illustrate that point, 2.2 M (40.1% w/v) sorbitol was able to freeze under the conditions tested, whereas sorbitol solutions at 3.5 M (63.8% w/v) failed to freeze. Presumably, the higher viscosity of 3.5 M sorbitol solution compared with the 2.2 M sorbitol solution indicated a greater disruption of bulk water structure. Contrary to that trend, however, dextran and PVP (polymers that are not as efficient thickeners as carbopol or NaCMC but have only small effects on water activity and DSC water melt) did not freeze in the FPD osmometer. Consistent with the correlation of the percent solids content and inability to freeze, dextran and PVP solutions at a viscosity of ~20 cP had high % w/v (20% and 30%, respectively). Thus, simply comparing water activity and DSC melt temperatures for excipients does not explain fully why some polymeric solutions freeze and others do not.
Polymeric Behavior: Another question to be addressed was how proteins behave under similar test conditions. We observed no increase in FPD as measured by DSC water melt or decrease in water-activity measurements within the MAb concentration range we tested, which is consistent with our results for polymers such as PVP and dextran at similar viscosities of ≥20 cP. Previous studies also reported no trends in water-activity measurements with increasing MAb concentration (12). Our observations suggest that within the concentration range of the MAbs we tested (and perhaps all MAbs) there is not enough disruption of water structure to decrease the water activity measurably. High–molecular-weight polymers (NaCMC and Carbopol samples) that showed large viscosity increases at low % w/v solids concentration also showed no effect on water activity but froze in the osmometer. The lower solids content with the most effective thickeners might disrupt the structure of water to a lesser degree. Thus, it appears that water activity alone failed to explain the deviations of FPD measurements sufficiently.
A possible explanation is that some amino-acid side chains on proteins might have antifreeze properties consistent with osmolytes such as sorbitol or polyethylene glycol (PEG) (24). As mentioned above, binding with solutes can alter the charge states of proteins at high concentrations and affect the activity of the water around them. That activity could be difficult to measure when short-range forces are involved. In our study, water-activity measurements proved to be less sensitive than viscosity to the changes in protein solutions that contribute to nonideality in osmolality measurement — whether resulting from self-association, electrostatic interactions, or short range forces.
We wanted to know whether this nonideality involved proteins alone or would be obtained in excipient or polymeric solutions as well. Is a kinetic aspect to freezing not accounted for in FPD osmometry? We determined that the failure-to-freeze phenomenon is not simply protein related. The nonideality is apparent with solutes ranging from sucrose to polymers to proteins, as reflected in their inability to freeze with high % w/v solids contents.
We also believe that the inability of highly concentrated solutions to freeze is influenced strongly by kinetics (the time allowed for the onset of freezing). As Table 2 shows, the time it took for a given sample to freeze varied. One question we did not address was the effect of solute molecular weights on viscosity. Do solute % w/v and freeze-onset time correlate? According to the Mark–Houwink equation, the intrinsic viscosity of a polymer solution is related to the molecular weight of the polymer as follows (Equation 2): [υ] = K × MWα.
In that equation, υ is the intrinsic viscosity, and K and α are parameters that depend on the polymer–solvent system, with α value of ~0.8 typical of a good solvent for the polymer. The important point here is that polymer molecular weight is tied closely to the ability of a given polymer’s effectiveness in contributing to solution viscosity. The higher its molecular weight, therefore, the more effective a given polymer will be as a thickener.
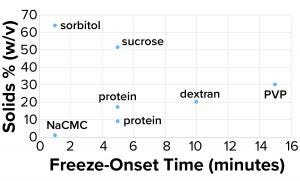
Figure 4a: Freeze-onset times were
measured for samples in an oil-immersion
bath at –6.5 °C and compared with the
percentage of solids (weight/volume).
Considering the results in Table 1, it is clear that only those polymers with very high molecular weights and corresponding low % w/v solute concentrations (NaCMC and carbopol) could freeze when prepared at concentrations with viscosities of ~20 cP. Those most effective thickeners seemed to have minimal apparent effects on the properties of bulk water, in large part due to the size of the polymer. The % solute w/v (and molecular weight) of the polymer also affected the kinetics of freezing (Figure 4a).
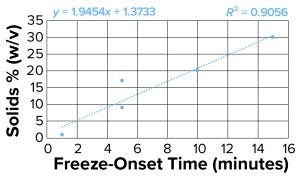
Figure 4b: Freeze-onset times were
measured for samples in an oil-immersion
bath at –6.5 °C and compared with
percentage of solids (weight/volume) for
all samples except sucrose and sorbitol.
Linear regression was fitted with an R2
value of 0.91.
Clearly the onset of freezing — simply related to observations from the oil-bath samples — correlates well with the % w/v of polymer solutions such as dextran, PVP, and NaCMC. On the other hand, sucrose and sorbitol (both nonpolymeric), do not have the same effect. When they are removed from the results, an apparent linear correlation exists among the polymer solutions.
The protein solutions we measured correspond with the polymer series we tested. The onset of freezing of proteins tested in this study (based on % w/v of solids originating from them), behave more like polymers at high concentrations. The implication is that the proteins we tested (and perhaps all proteins) act more like polymers at high concentrations because of their propensity to self-associate. That polymer-like property could account for the kinetic aspect of freezing.
Along with higher than expected values obtained by VPD instruments the phenomenon of highly concentrated MAb solutions failing to freeze in FPD instruments, even with the application of a freeze-pulse shock, has clear implications in the practical use of these instruments. Potential solutions to the FPD osmometer’s inability to measure highly viscous protein solutions include lowering the osmometer chamber’s freezing temperature and extending the time at which samples are held after application of the freeze-pulse shock to induce partial crystallization.
Practical Implications
Our work highlights deviations in osmolality measurements from theoretical values and a failure-to-freeze phenomenon in measuring highly concentrated protein solutions using an FPD osmometer. That correlates with viscosity of protein solutions in the range of 20–25 cP (or higher). We found that high–molecular-weight polymeric excipients with low % w/v solutes failed to freeze at viscosities of ≥20 cP or greater. We found no correlation between a protein solution’s FPD or water-activity measurements and the sample’s failure to freeze. Highly concentrated proteins failed to freeze in the osmotic chamber but were frozen successfully in an oil-immersion bath set to the same temperature if the freezing time was extended.
Proteins behave like polymers at high concentrations in that the % w/v solute content of a protein solution is relevant to the time it will take to freeze. We propose that lowering the freezing temperature in an osmometer sample chamber or extending the freezing time in the instrument may be required for high-concentration MAb solutions. Care must be taken in measuring the osmolality of proteins at high concentrations using either FPD or VP osmometry.
References
1 Strange K. Cellular Volume Homeostasis. Adv. Physiol. Ed. 28(4) 2004: 155–159; https://doi.org/10.1152/advan.00034.2004.
2 Weisberg HF. Osmolality. Lab. Med. 12(2) 1981: 81–85; https://doi.org/10.1093/labmed/12.2.81.
3 Wang W. Tolerability of Hypertonic Injectables. Int. J. Pharm. 490(1–2) 2015: 308–315; https://doi.org/10.1016/j.ijpharm.2015.05.069.
4 Brazeau GA, et al. Current Perspectives on Pain Upon Injection of Drugs. J. Pharm. Sci. 87(6) 1997: 667–677; https://doi.org/10.1021/js970315l.
5 Shire S, Shahrokh Z, Liu J. Challenges in the Development of High Protein Concentration Formulations. J. Pharm. Sci. 93(6) 2004: 1390–1402; https://doi.org/10.1002/jps.20079.
6 Hull P. Glucose Syrups: Technology and Applications. John Wiley and Sons: Chichester, UK, 2010; p. 201.
7 Banks DD, et al. The Effect of Sucrose Hydrolysis on the Stability of Protein Therapeutics During Accelerated Formulation Studies. J. Pharm. Sci. 98(12) 2009: 4501–4510; https://doi.org/10.1002/jps.21749.
8 Sweeney TE, Beuchat AB. Limitations of Methods of Osmometry: Measuring the Osmolality of Biological Fluids. Am. J. Physiol. 264(3) 1993: R469–R480; https://doi.org/10.1152/ajpregu.1993.264.3.r469.
9 Harn N, et al. Highly Concentrated Monoclonal Antibody Solutions: Direct Analysis of Physical Structure and Thermal Stability. J. Pharm. Sci. 96(3) 2007: 532–546; https://doi.org/10.1002/jps.20753.
10 Schiller LR, et al. Osmotic Effects of Polyethylene Glycol. Gastroenterology 94(4) 1988: 933–941; https://doi.org/10.1016/0016-5085(88)90550-1.
11 Saluja A, Kalonia DS. Nature and Consequences of Protein-Protein Interactions in High Protein Concentration Solutions. Int. J. Pharm. 358(1–2) 2008: 1–15; https://doi.org/10.1016/j.ijpharm.2008.03.041.
12 Sahin E, et al. Osmolality Measurements for High-Concentration Protein–Polymer Solutions: Variation Based on Working Principles of Osmometers. BioProcess Int. 14(6) 2016; https://bioprocessintl.com/manufacturing/formulation/osmolality-measurements-for-high-concentration-protein-polymer-solutions-variation-based-on-working-principles-of-osmometers.
13 Winzor DJ. Reappraisal of Disparities Between Osmolality Estimates By Freezing Point Depression and Vapor Pressure Deficit Methods. Biophys. Chem. 107(3) 2004: 317–323; http://dx.doi.org/10.1016/j.bpc.2003.11.010.
14 McFarland W, Wimsatt W. Renal Function and Its Relationship to the Ecology of the Vampire Bat, Desmodus rotundus. Comp. Biochem. Phys. 28(3) 1969: 985–1006.
15 Zhang Z, Liu Y. Recent Progresses of Understanding the Viscosity of Concentrated Protein Solutions. Curr. Opin. Chem. Eng. 16 2017: 48–55; http://dx.doi.org/10.1016/j.coche.2017.04.001.
16 Galush WJ, Le LN, Moore JMR. Viscosity Behavior of High-Concentration Protein Mixtures. J. Pharm. Sci. 101(3) 2012: 1012–1020; https://doi.org/10.1002/jps.23002.
17 Raut AS, Kalonia DS. Pharmaceutical Perspective on Opalescence and Liquid–Liquid Phase Separation in Protein Solutions. Mol. Pharm. 13(5) 2016: 1431–1444; https://doi.org/10.1021/acs.molpharmaceut.5b00937.
18 Chari R, et al. Long- and Short-Range Electrostatic Interactions Affect the Rheology of Highly Concentrated Antibody Solutions. Pharm. Res. 26(12) 2009: 2607–2618; https://doi.org/10.1007/s11095-009-9975-2.
19 Yadav S, Shire S J, Kalonia DS. Viscosity Analysis of High Concentration Bovine Serum Albumin Aqueous Solutions. Pharm. Res. 28(8) 2011: 1973–1983; http://dx.doi.org/10.1007/s11095-011-0424-7.
20 Yadav S, Shire S J, Kalonia DS. Factors Affecting the Viscosity in High Concentration Solutions of Different Monoclonal Antibodies. J. Pharm. Sci. 99(12) 2010: 4812–4829; https://doi.org/10.1002/jps.22190.
21 Stoner MR, et al. Protein–Solute Interactions Affect the Outcome of Ultrafiltration/Diafiltration Operations. J. Pharm. Sci. 93(9) 2004: 2332–2342; https://doi.org/10.1002/jps.20145.
22 Loftsson T, Saokham P, Sá Couto AR. Self-Association of Cyclodextrins and Cyclodextrin Complexes in Aqueous Solutions. Int. J. Pharm. 560, 5 April 2019: 228–234; https://doi.org/10.1016/j.ijpharm.2019.02.004.
23 DeVries AL. The role of Antifreeze Glycopeptides and Peptides in the Freezing Avoidance of Antarctic Fishes. Comp. Biochem. Physiol. 90B(3) 1988: 611–621; https://doi.org/10.1016/0305-0491(88)90302-1.
24 Panuszko A, et al. General Mechanism of Osmolytes’ Influence on Protein Stability Irrespective of the Type of Osmolyte Cosolvent. J. Phys. Chem. 120(43) 2016: 11159–11169; https://doi.org/10.1021/acs.jpcb.6b10119.
Alona Teran is a scientist, and corresponding author William Callahan is a senior scientist in drug-product process development at Amgen Inc., One Amgen Center Drive, Thousand Oaks, CA 91320; [email protected]. Sabaha Khakoo was an associate scientist at Eurofins Advantar Laboratories (San Diego, CA) and is now a senior associate scientist II at Gilead Sciences (Oceanside, CA). Rahul Rajan Kaushik is vice president of protein/antibody development and manufacturing at Fibrogen, Inc. (San Francisco, CA).


