HTTPS://ALAMY.COM
According to the US Food and Drug Administration’s (FDA’s) process validation guidance, critical quality attributes (CQAs) and critical process parameters (CPPs) are used to assess the statistical stability of a bioprocess and its ability to meet acceptable criteria as a part of a continued process verification (CPV) program using control charts (1). For those control charts, control limits are used to assess the statistical stability of process parameters and attributes. When data are normally distributed, control limits are established straightforwardly by placing control limits three standard deviations away from an average (mean) value (2).
However, bioprocess data often are not normally distributed, so a regular I-chart with control limits placed three standard deviations from a mean value cannot be used. Such data include
• censored data, which are partially known and often are reported as being below the limit of quantification (LoQ)
• trending mutually exclusive events (e.g., fraction of defective items), for which the data follow a binomial distribution
• zero-inflated data, which often are reported as zeros that follow a negative binomial distribution.
Below, I describe a detailed procedure using Excel spreadsheet formulas to establish alert limits and statistical control limits for nonnormally distributed censored data, binomially distributed data, and negative binomially distributed data. The statistical alert-limit method for nonnormally distributed data shows that a minimum of 25–30 samples are required to estimate the mean and standard deviation at acceptable levels of confidence. The data set also should have a minimum of four to five discrete values. If not, unrounded data can be used to estimate parameters using the methods discussed below (3).
Censored Data
In bioprocessing, safety-related contaminants (e.g., endotoxins) and product- and process-related trace contaminants can be reported as being below an LoQ because of the limitations of some analytical methods. Restricted maximum likelihood (RML) methods, originally proposed by Persson and Rootzen in 1977, have been suggested as appropriate methods for estimating unbiased process averages and standard deviations for censored data (4).

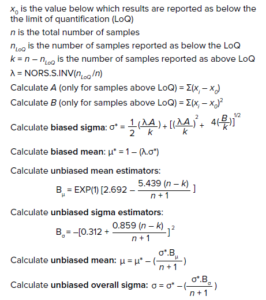
Calculations 1: Unbiased mean and unbiased standard deviation for censored data.
Alert limits can be placed three unbiased standard deviations away from an unbiased process average. The RML method is used when the percentage of samples reported as LoQ is ≤50% of the total sample size. If the percentage of LoQ samples is >50%, then a researcher should trend the data using a run chart or frequency table (5). The unbiased mean and unbiased standard deviation for censored data can be estimated as shown in the “Calculations 1” box (4, 5).

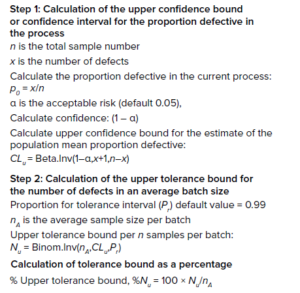
Calculations 2: Alert limits for binomially distributed data and equation for tolerance bound as a percentage.
Binomially Distributed Data
In the biopharmaceutical industry, the proportion or fraction of defective items in a population often is trended at the drug-product stage. Typically, vials filled with drug product (such as cell and gene therapies) are inspected for compliance with quality attributes (e.g., fill volume, proper vial closure, and proper labeling). If only one attribute does not meet a predefined acceptable standard, the item is classified as defective. The fraction or proportion of defective items can be expressed as a percentage for trending the batch performance, because typically the sample size differs among batches. Furthermore, the proportion of defective items in successive batches is independent of the previous defective rate. Thus, the probability of the proportion of nonconforming events follows a binomial distribution. As the “Calculations 2” box shows, calculation of alert limits for binomially distributed data is a two-step process: The confidence interval is calculated with the Clopper–Pearson exact binomial method, and then the tolerance bound at a tolerance interval of 99% is calculated using the method of Hahn and Chandra (6–9).
Negative Binomially Distributed Data
Data for environmental monitoring in biomanufacturing cleanrooms (e.g., particle counts or bioburden) often are reported as zeros. Those data follow a negative binomial distribution, and the data distribution is modeled on the basis of both the chance of occurrence of an event and the intensity of that event.

Calculations 3: Alert limits for negatively distributed data.
The negative binomial distribution is characterized by two parameters: µ and k, in which k is termed the negative binomial dispersion parameter, and µ is the mean. Different methods are available for estimating µ and k. In the “Calculations 3” box, both parameters are estimated with the simplest method, called method of moments. Furthermore, because a negative binomial distribution is not a symmetric distribution, using a quantile limit is more appropriate than using limits three standard deviations above and below the mean (9).
Working the Methods
The key objective of control limits in control charts is to ensure process performance is stable and capable of meeting expected performance. Calculation of control limits is straightforward for normally distributed data. However, the biopharmaceutical industry often faces reporting non-normally distributed data. Herein, I detail the methods to calculate control limits for non-normally distributed data. Such data include censored, binomially distributed, and negative binomially distributed data. While working toward the methods discussed herein, you should ensure that the outliers in the data set with assignable cause or extreme outliers with no assignable root cause are excluded in the calculations to obtain more reliable control limits. That is because extreme outliers can inflate the calculated mean and standard deviation.
References
1 Guidance for Industry: Process Validation — General Principles and Practices. US Food and Drug Administration: Silver Spring, MD, 2011; https://www.fda.gov/files/drugs/published/Process-Validation–General-Principles-and-Practices.pdf.
2 PDA Technical Report 59: Utilization of Statistical Methods for Production Monitoring. Parenteral Drug Association, Bethesda, MD, 2012; https://www.pda.org/bookstore/product-detail/1842-tr-59-utilization-of-statistical-methods.
3 Heigl N, et al. Statistical Quality and Process Control in Biopharmaceutical Manufacturing: Practical Issues and Remedies. PDA J. Sci. Technol. 75(5) 2021: 425–444; https://doi.org/10.5731/pdajpst.2020.011676.
4 Gibbons RD. Statistical Methods for Groundwater Monitoring. John Wiley & Sons, New York, 1994.
5 Hahn GJ, Chandra, R. Tolerance Intervals for Poisson and Binomial Variables. J. Qual. Technol. 13(2) 1981: 100–110; https://doi.org/10.1080/00224065.1981.11980998.
6 Agresti A, Coull BA. Approximate Is Better Than “Exact” for Interval Estimation of Binomial Proportions. Am. Stat. 52(2) 1998: 119–126; https://doi.org/10.2307/2685469.
7 Binomial Parameter, Clopper–Pearson Interval Estimation. Wiley StatsRef: Statistics Reference Online 2014; https://doi.org/10.1002/9781118445112.stat01453.
8 Meeker WQ, Hahn GJ, Escobar LA. Statistical Intervals: A Guide for Practitioners and Researchers. John Wiley & Sons, New York, 2017.
9 Hoffman D. Negative Binomial Control Limits for Count Data with Extra-Poisson Variation. Pharm. Stat. 2(2) 2003: 127–132; https://doi.org/10.1002/pst.51.
Further Reading
Bower KM. Using Prior Knowledge to Estimate Long-Term Variation. BioProcess Int. March 2021; https://bioprocessintl.com/manufacturing/process-monitoring-and-controls/using-prior-knowledge-and-a-mixed-effects-model-to-estimate-long-term-variation.
Mire-Sluis A, et al. Next-Generation Biotechnology Product Development, Manufacturing, and Control Strategies, Part 1: Upstream and Downstream Strategies. BioProcess Int. October 2020; https://bioprocessintl.com/business/cmc-forums/cmc-forum-next-generation-biotechnology-product-development-manufacturing-and-control-strategies-part-1-upstream-and-downstream-strategies.
Bower KM. Practical Considerations for Statistical Analyses in Continued Process Verification. BioProcess Int. December 2020; https://bioprocessintl.com/manufacturing/process-monitoring-and-controls/practical-considerations-for-statistical-analyses-in-continued-process-verification.
Bower KM. Run Rules with Autocorrelated Data for Continued Process Verification. BioProcess Int. October 2020; https://bioprocessintl.com/manufacturing/continuous-bioprocessing/run-rules-with-autocorrelated-data-for-continued-process-verification.
Rios M, et al. Developing Process Control Strategies for Continuous Bioprocesses. BioProcess Int. May 2020; https://bioprocessintl.com/manufacturing/continuous-bioprocessing/developing-process-control-strategies-for-continuous-bioprocesses.
Bower KM. Biopharmaceutical Product Specification Limits and Autocorrelated Data. BioProcess Int. February 2020; https://bioprocessintl.com/analytical/product-characterization/autocorrelated-data-and-setting-specification-acceptance-criteria-for-drug-products.
Bower KM. Determining Control Chart Limits for Continued Process Verification with Autocorrelated Data. BioProcess Int. April 2019; https://bioprocessintl.com/manufacturing/process-monitoring-and-controls/determining-shewhart-control-chart-limits-for-continued-process-verification-with-autocorrelated-data.
Bower KM. Certain Approaches to Understanding Sources of Bioassay Variability. BioProcess Int. October 2018; https://bioprocessintl.com/upstream-processing/assays/certain-approaches-to-understanding-sources-of-bioassay-variability.
Bower KM. Statistical Assessments of Bioassay Validation Acceptance Criteria. BioProcess Int. June 2018; https://bioprocessintl.com/upstream-processing/assays/statistical-assessments-of-bioassay-validation-acceptance-criteria.
McCready C. Model Predictive Control for Bioprocess Forecasting and Optimization. BioProcess Int. November 2017; https://bioprocessintl.com/manufacturing/process-monitoring-and-controls/model-predictive-control-for-bioprocess-forecasting-and-optimization.
Naveenganesh Muralidharan is senior engineer, manufacturing science and technology, at Novartis Gene Therapies, 1940 USG Drive, Libertyville, IL 60048; 1-314-496-8483; [email protected] or [email protected]. The views and opinions expressed in this article are those of the author and do not necessarily reflect the official policy or position of Novartis or any of its officers.


