Fucosylation of a Therapeutic Antibody: Effects on Antibody-Dependent, Cell-Mediated Cytotoxicity (ADCC) Potency and Efficacy
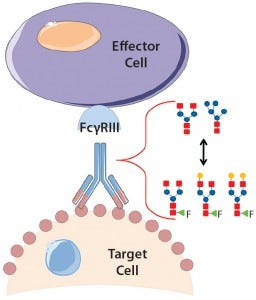 Product quality attributes are critical for the functionality and manufacturability of therapeutic antibodies. They can be significantly influenced by a number of production process parameters, such as cell culture media. The composition of growth and feed media can influence antibody glycosylation, including the concentration of ammonia, glutamine, glucose, and metal ions (1, 2). Thus, it is critical during media development and optimization to monitor and consider a culture medium’s impact on glycosylation. For therapeutic antibodies whose mechanism of action includes antibody-dependent, cell-mediated cytotoxicity (ADCC), it is particularly important to measure N-glycan fucosylation at Asn 297 in the Fc domain, which is well known to influence ADCC activity strongly (3, 4).
In ADCC, an antibody first binds to a cell-surface target antigen, then recruits immune effector cells that lyse the target cell. A decrease in fucosylation at Asn 297 has been shown to increase the antibodies’ binding affinity to CD16 (Fc gamma receptor IIIa) on natural killer cells and ultimately increase ADCC potency (4, 5). So researchers have shown significant interest in lowering fucosylation to increase therapeutic antibody efficacy with multiple glycoengineered antibodies in the clinic (6).
We produced a relevant therapeutic antibody (trastuzumab) with different levels of fucosylation by using a glycotransferase inhibitor to study their resulting effects on ADCC activity. Using a reporter gene ADCC assay, we monitored changes to antibody fucosylation and subsequently the antibody’s ADCC activity. As we anticipated, the decrease in fucosylation resulted in higher ADCC potency (lower EC50). However, the difference in fucosylation also significantly changed the maximal-fold induction, a phenomenon that has been observed by others using a humanized CD20 antibody with cell-based ADCC cytotoxicity assays (4, 7). Here, we show that such an increase in ADCC maximal-fold induction is specifically mediated through binding of the Fc domain to CD16.
Materials and Methods
Antibody Production in Fed-Batch Culture: For production of the antihuman HER2 antibody trastuzumab, we used a proprietary CHO-M cell line (a Chinese hamster ovary cell line derived from CHO-K1 cells) from Selexis. Fed-batch cultures in 125-mL shake flasks (30-mL working volume) took 14 days using Irvine Scientific’s BalanCD CHO Growth A medium.
For inhibition of fucosylation, we added 100 μM of 2F-peracetyl-fucose (catalog #344827) from EMD Millipore to the growth medium before inoculation. After maintenance at 37°C, 5% CO2, with 120-rpm agitation on an orbital shaker, cultures were shifted to a lower temperature (32°C) on day 7 to maintain high viability. We fed with BalanCD CHO feed 4 to each fed-batch culture a total of 20% of the initial working volume (4% five times from days 5–9 consecutively), maintaining glucose at 6–8 g/L through the culture’s end. A Vi-Cell XR cell viability analyzer from Beckman Coulter monitored cell density and viability. A BioProfile FLEX system from Nova Biomedical monitored glucose and lactate levels. We quantified antibody titers using a FortéBio QKe Octet system with protein A sensors.
Antibody Purification: Using centrifugation and then 0.2-μm filtration, we separated cells from harvested supernatant before purifying the antibodies using protein A affinity chromatography with a GE Healthcare Predictor MabSelect SuRe LX 96-well filter plate (#28-9258-25). Resin was first equilibrated using 0.02 M sodium phosphate buffer at pH 7. After clarified supernatant was loaded to capture the antibody, the plate was washed using 0.02 M sodium phosphate (pH 7) with 0.15 M NaCl. Antibody was eluted using 0.1 M glycine-HCl buffer at pH 3. Immediately, the elution fraction was neutralized using 1M Tris-HCl buffer at pH 9 and exchanged into phosphate-buffered saline (PBS) with a Millipore 10-kDa MWCO polyethersulfone (PES) membrane 96-well filter plate (#MAU0101).
Sodium-Dodecyl Sulfate Polyacrylamide Gel Electrophoresis (SDS-PAGE): To confirm molecular weight and assess protein purity, we analyzed purified antibody samples by SDS-PAGE. Electrophoresis under nonreducing and reducing conditions separated samples through NuPAGE Bis-Tris gels (4–12%) from Life Technologies. The gel was Coomassie stained by SimplyBlue SafeStain (Life Technologies) based on the manufacturer’s instructions and imaged using a Syngene G:Box gel imager. Images were analyzed using GeneTools software from Syngene.
Size-Exclusion Chromatography (SEC): To determine the size homogeneity of purified antibody samples, we used SEC on an Agilent 1100 liquid chromatograph equipped with a quaternary pump delivery system, robotic autosampler, column thermostat, and variable-wavelength detector. On a 300-Å, 3-μm, 7.8-mm × 300-mm Bio-SEC-3 column from Agilent Technologies, 20 μg of antibody was injected at 25°C, with detection at λ = 220 nm. Mobile-phase A consisted of 150 mM phosphate buffer at pH 7, with separation at a flow rate of 1 mL/min for a total analysis time of 17 min/sample.
Charge Variant Analysis: Using an HT protein charge variant kit from PerkinElmer (#CLS760670) on a LabChip GXII system (PerkinElmer), we analyzed charge variants. According to the manufacturer’s recommendation, we purified antibody samples using reagents from the kit at pH 6.9 following optimization of the running-buffer pH. Relative percentages of major molecular species and charge variants were quantified with LabChip GX software.
Antibody N-Glycan Analysis: We determined the relative percentage of N-glycan species for the purified antibody samples using the LabChip GXII system from PerkinElmer. For glycan digestion and labeling, we used a PerkinElmer glycan release and labeling kit (#760523) according to the manufacturer’s instructions. We used a PerkinElmer HT glycan LabChip reagent kit (#760525) to prepare an HT high-resolution laboratory chip (#760524) for separation by capillary electrophoresis. We analyzed electropherograms generated for each sample using LabChip GX software to obtain the relative abundance of five major N-glycans and calculated the percentage of fucosylation as follows: (G0F + G1F + G2F) ÷ (Man5 + G0 + G0F + G1F + G2F).
Flow Cytometry: We determined binding affinity of trastuzumab to cell-surface HER2 using flow cytometry. SK-BR-3 cells in culture from the American Type Culture Collection (ATCC) were detached and harvested using TrypLE from Life Technologies. After counting cells with a ViCELL counter from Beckman Coulter, we seeded them into 96-well plates at 50,000 cells/well in flow buffer: PBS with 1% bovine serum albumin (BSA) and 0.1% sodium azide. Those cells were incubated with different concentrations of purified trastuzumab for an hour at 4°C. Then we washed the cells with flow buffer before incubating them with antihuman IgG Fc conjugated with Alexa 488 from Biolegend (#409322) for another hour at 4°C. Next, we washed and fixed the cells with 2% paraformaldehyde in PBS before analyzing them using a FACSverse flow cytometer from BD Biosciences. BD FACSuite software provided mean fluorescent intensity values, and we plotted the averages against the log antibody concentration (μg/mL) using GraphPad Prism 6 software to provide EC50 values.
ADCC Assay: We performed our ADCC assay using a flat, white, 96-well clear-bottom plate from Corning (#3610) and an ADCC Reporter Bioassay Core kit from Promega (#G7018) according to the manufacturer’s instructions. Briefly, we harvested SK-BR-3 target cells from culture using TrpLE celldissociation enzyme from Life Technologies and plated them in culture medium (McCoy’s Medium 5A from Irvine Scientific with 10% FBS) at 5,000 cells per well to incubate overnight in a CO2 incubator at 37°C. Afterward, we replaced the culture medium with assay buffer (RPMI 1640 from Irvine Scientific with 10% low IgG FBS). Then we added the following components:
serial dilutions of target antibodies
Jurkat effector cells (Promega)
serial dilutions of 3G8 antibody (antihuman CD16, clone 3G8, from BioLegend).

Figure 1: Fed-batch production of trastuzumab shows (A) viable cell density over time and (B) percent viability over time. A CHO cell line producing trastuzumab was cultured under fed-batch conditions with and without the fucosyltransferase inhibitor 2F-peracetyle-fucose. Feeding events were performed on days 5 through 9, and a batch culture was included as a control.
After the plate incubated for six hours at 37°C, we added Bio-Glo luciferase assay reagent according to the kit manufacturer’s instructions and measured luminescence using a Tecan plate reader. Frozen Jurkat effector cells were thawed, resuspended in assay buffer, and immediately plated at 75,000 cells/well with the target cells and antibodies. For data analysis, we calculated specific ADCC activity by subtracting background activity (target and effector cells only) and then normalizing to maximal ADCC activity without 3G8 antibody (no inhibition). The dose–response curve was fitted using GraphPad Prism 6 software.
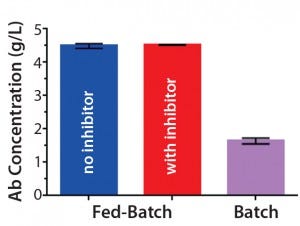
Figure 1C: Antibody titers from clarified harvest supernatants on day 14 (mean ± STD; n = 2
Results and Discussion
Antibody Production: To produce trastuzumab with different relative abundance of fucosylation, we used fed-batch production of a trastuzumab-expressing CHO cell line with and without the fucosyltransferase inhibitor 2F-peracetyl-fucose. Introduction of the inhibitor to the fed batch did not change cell growth in terms of viable cell density or viability over time (Figures 1A and 1B). Neither were antibody titers from clarified harvest supernatants affected (Figure 1C).
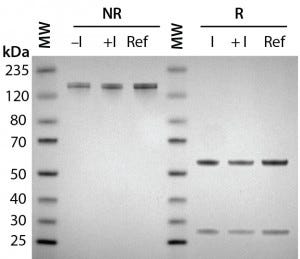
Figure 2A: Antibody protein characterization — SDS-PAGE analysis performed on 4–12% BisTris gels under reducing (R) and nonreducing (NR) conditions with a reference trastuzumab antibody; antibodies were purified from clarified harvest supernatant and analyzed for protein quality.
To prepare for product quality assessment, we purified trastuzumab antibodies from clarified harvest supernatant using affinity chromatography. Under nonreducing conditions, both purified antibodies migrated at the expected molecular weight (~150 kDa) and showed >90% purity by SDS-PAGE analysis. Under reducing conditions, the heavy and light chains separated and migrated at their respective expected sizes (Figure 2A). SEC showed both purified antibodies with >97% size homogeneity and <3% high–molecular-weight aggregates (Figure 2B). Collectively, these results helped to assure us that subsequent product quality analysis would be based on highly pure antibody proteins free of interference from variants, aggregates, and impurities.
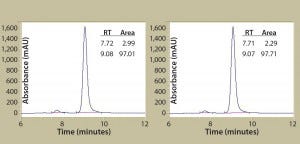
Figure 2B: Antibody protein characterization — SEC measuring absorbance at 220 nm over time in minutes; antibodies were purified from clarified harvest supernatant and analyzed for protein quality. Tables summarize retention time (RT) and percent area for the peaks.
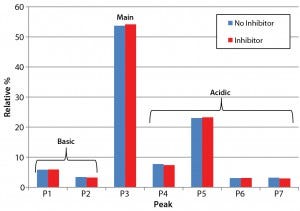
Figure 3: Analysis of charge heterogeneity for antibodies produced with and without the glycotransferase inhibitor is based on LabChip capillary isoelectric focusing with a separation buffer at pH 6.9. This graph compares the relative percentage of basic and acidic variants with those of the main species.
Product Quality Assessment: We further characterized the purified trastuzumab antibodies to confirm that treatment with the inhibitor did not affect protein quality through posttranslational modifications. Influences of cell culture media on the abundance of antibody charge variants have been well documented in other cases (8, 9). Thus, we performed a charge-variant analysis for both the inhibitor-treated and untreated antibodies (Figure 3) using capillary isoelectric focusing (cIEF). Our analysis showed no significant differences in the relative abundance of major peak and charge variants (Figure 3), confirming that the inhibitor did not alter the chargevariant distribution.
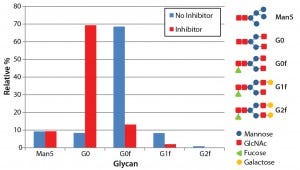
Figure 4: N-glycosylation profile of antibodies produced both with and without the glycotransferase inhibitor; antibodies were denatured and digested using PNGase F, and detached N-glycans were labeled with fluorescence. The labeled glycans were separated with LabChip capillary electrophoresis to show the relative abundance of five major glycans.
To measure changes to glycosylation from the inhibitor treatment, we assayed N-glycosylation profiles for both inhibitor-treated and untreated antibodies using capillary electrophoresis with the LabChip system. This assay determines the relative abundance of five major N-glycans found on Asn 297 of antibodies: Mannose 5, G0, G0f, G1f, and G2f. As expected, antibodies produced using the fucosyltransferase inhibitor showed a significant decrease in the fucosylated glycan species (G0f, G1f, and G2f) (Figure 4). The percentage of fucosylation decreased from 86% without the inhibitor to 19% with it.
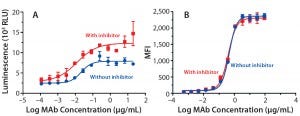
Figure 5: ADCC activity was measured (A) using a reporter gene assay with SK-BR-3 target cells; mean ± SD; n = 3. Relative luminescence units (RLU) are plotted against the log MAb concentration (μg/mL) to calculate EC50 values (no inhibitor = 0.02 μg/mL; with inhibitor = 0.01 μg/mL). Flow cytometry was used (B) to measure antibody binding to SK-BR-3 cells. Average mean fluorescent intensity (MFI) is plotted against the log concentration (µg/mL) to calculate EC50 values (no inhibitor = 0.45 μg/mL, with inhibitor = 0.39 μg/mL).
ADCC Activity: To study the influence on ADCC activity of the fucosylation change, we evaluated the antibodies in a reporter-gene ADCC assay. As expected, antibodies produced with inhibitor treatment (lowered fucosylation) showed stronger ADCC potency (Figure 5A): EC50 = 0.02 μg/mL without inhibitor, EC50 = 0.01 μg/mL with it). We found it interesting that the dose-response curve also showed a nearly twofold increase in the upper asymptote or maximal ADCC response (Figure 5A). That phenomenon suggests that an increased ADCC efficacy has also been observed by others using cellbased ADCC cytotoxicity assays, confirming that it is not strictly related to the nature of the reporter gene assay (5, 7).
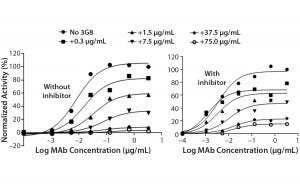
Figure 5C: ADCC activity was competitively inhibited with increasing concentrations of the antihuman CD16 antibody 3G8. ADCC activity is normalized to the maximum value obtained without 3G8.
To further understand the mechanism behind that increase in maximal response, we measured binding affinities of the trastuzumab antibodies to HER2 on the surface of SKBR3 cells using flow cytometry (Figure 5B). As anticipated, the EC50 values were comparable (0.45 μg/mL without inhibitor, 0.39 μg/mL with it) for all antibodies, confirming their similar binding affinities to the target antigen (HER2).
After confirming equivalent binding affinity to HER2, we next evaluated binding interactions between trastuzumab and CD16 on the Jurkat reporter cells. For competitive inhibition of the ADCC activity, we used an antihuman CD16 antibody called 3G8, which has been shown to compete with the human IgG1 Fc domain for binding to CD16 (10). Here, we introduced increasing concentrations of 3G8 relative to trastuzumab and measured its effect on the ADCC dose-response curve (Figure 5C). The 3G8 antibody was able to decrease ADCC activity for the lower- and higher-fucosylated trastuzumab both in terms of maximal response and EC50. In particular, the 3G8 competitor significantly inhibited the maximal response of the higherfucosylated antibody more than it did the lower-fucosylated antibody (Figure 5D). That result supports the idea that the lower-fucosylated antibody has a stronger binding affinity to CD16. The result from this competitive analysis specifically implicates CD16 binding as the primary reason for the higher maximal response observed for the lower-fucosylated trastuzumab.
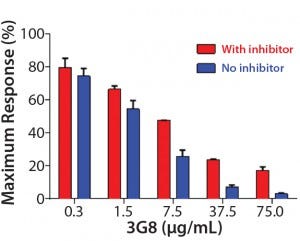
Figure 5D: Summarizing the percentage of maximal ADCC response obtained upon introduction of 3G8 antihuman CD16 antibody; mean ± SD; n = 3
Our results suggest that lower-fucosylated trastuzumab has a higher copy number at the cell-surface of CD16-Jurkat cells, which corroborates with previous results of flow-cytometry binding analysis for a human IgG1 with different levels of fucosylation to cell-surface CD16 (11). The lower-fucosylated antibody may be more eligible to bind CD16: Others have shown through structural analysis that the presence of a fucose residue at Asn 297 sterically hinders interaction with CD16 (12). Glycosylation of CD16 appears to be important for such interaction and could be another variable influencing the copy number of trastuzumab on CD16-Jurkat cells.
Effects Worth Considering
Here we have shown that changes to antibody fucosylation mediated by a glycotransferase inhibitor changed not only ADCC potency (EC50), but also ADCC efficacy (maximal response). Furthermore, using competitive analysis, we have shown that such effects on ADCC efficacy are specifically mediated through binding interactions between the Fc domain and CD16. Studying this relationship between fucosylation and ADCC activity is especially important because the exact nature of the structure–function relationship may prove to be antibody-specific. That further emphasizes the importance of monitoring fucosylation during development and manufacturing of relevant therapeutic antibodies, including during culture media development and optimization.
References
1 Hmiel LK, et al. Post-Translational Structural Modifications of Immunoglobulin G and Their Effect on Biological Activity. Anal. Bioanal. Chem. 407 (1), 2015: 79–94; doi:10.1007/s00216-014-8108-x.
2 Hossler, et al. Optimal and Consistent Protein Glycosylation in Mammalian Cell Culture. Glycobiology 19(9) 2009: 936–949; doi:10.1093/glycob/cwp079.
3 Abes R, et al. Impact of Glycosylation on Effector Functions of Therapeutic IgG. Pharmaceuticals 3(1) 2010: 146–157; doi:10.3390/ph3010146.
4 Shields RL, et al. Lack of Fucose on Human IgG1 N-Linked Oligosaccharide Improves Binding to Human Fc Gamma RIII and Antibody-Dependent Cellular Toxicity. J. Biol. Chem. 277(30) 2002: 26733–26740.
5 Chung S, et al. Quantitative Evaluation of Fucose Reducing Effects in a Humanized Antibody on Fcγ Receptor Binding and Antibody Dependent Cell-Mediated Cytotoxicity Activities. MAbs 4(3) 2012: 326– 340; doi:10.4161/mabs.19941.
6 Beck A, et al. Marketing Approval of Mogamulizumab: A Triumph for GlycolEngineering. MAbs 4(4) 2012: 419–425; doi:10.4161/mabs.20996.
7 Chung S, et al. Characterization of In Vitro Antibody-Dependent Cell-Mediated Cytotoxicity Activity of Therapeutic Antibodies: Impact of Effector Cells. J. Immunol. Meth. 407(5) 2014: 63–75; doi:10.1016/j.jim.2014.03.021.
8 Kaschak T, et al. Characterization of the Basic Charge Variants of a Human IgG1: Effect of Copper Concentration in Cell Culture Media. MAbs 3(6) 2011: 577–583’ doi:10.4161/mabs.3.6.17959.
9 Hazeltine LB, et al. Chemically Defined Media Modifications to Lower Tryptophan Oxidation of Biopharmaceuticals. Biotechnol. Prog. 11 Nov 2015: epub.
10 Hober D, et al. Circulating and CellBound Antibodies Increase Coxsackievirus B4-Induced Production of IFN-Alpha By Peripheral Blood Mononuclear Cells from Patients with Type 1 Diabetes. J. Gen. Virol. 83(9) 2002: 2169–2176; doi:10.1099/00221317-83-9-2169.
11 Harrison A, et al. Methods to Measure the Binding of Therapeutic Monoclonal Antibodies to the Human Fc Receptor FcγRIII (CD16) Using Real Time Kinetic Analysis and Flow Cytometry. J. Pharmaceut. Biomed. Anal. 63, 2012: 23–28; doi:10.1016/j.jpba.2012.01.029.
12 Mizushima T, et al. Structural Basis for Improved Efficacy of Therapeutic Antibodies on Defucosylation of Their Fc Glycans. Genes to Cells 16(11) 2011: 1071–1080; doi:10.1111/j.1365-2443.2011.01552.x.
Corresponding author David T. Ho, PhD, is a senior scientist II; John F. Park, PhD, is a senior scientist I; David E. Ho and Brandy Nunez are scientist II; Jenny Bang is R&D manager, and Jessie H.-T. Ni, MOT, PhD, is chief scientific officer at Irvine Scientific, 1830 East Warner Street, Santa Ana, CA 92705; 1-949-261-7800 x158; [email protected], www.irvinesci.com. BalanCD is a registered trademark of Irvine Scientific.
You May Also Like

