Scaling Up a CHO-Produced Hormone–Protein Fusion Product
Many biotechnology companies recognize the powerful benefits of increasing product titer early in product development as a strategy to minimize manufacturing costs, scale, and the duration necessary to produce clinical supplies and achieve product commercialization. Additional benefits include minimizing or completely avoiding significant regulatory delays to market that can be caused by major process technology changes (such as cell line and product quality changes).
Recently, another significant benefit has been realized too: Smaller, more productive and efficient 2,000-L single-use bioreactors and purification systems can meet market demands if enough improvement is achieved in manufacturing productivity early on. These systems eliminate the enormous expense, duration, and risk of building large-scale stainless steel manufacturing plants.
Improvements achieved in scaled-down robotic high-throughput screening technologies can at best simulate large-scale performance but not guarantee it. However, successful scale-up can be achieved through careful controls of culture media source/quality, cell culture parameters, and bioreactor performance modeling. Here we describe small-scale optimization of a CHO cell line followed by successful scale-up using single-use, large-scale, stirred-tank bioreactors.
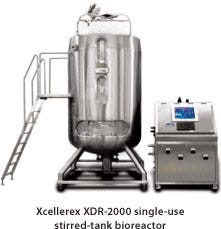
Figure 1:
Materials and Methods
Growth Conditions: A dihydrofolate reductase (DHFR) deficient CHO-DG44 transfected cell line that had been preadapted to serum-free and suspension growth was provided by our client. The growth medium for the parent Chinese hamster ovary (CHO) cell line was a CD-DG44 medium (custom formulated by the client and supplied by Invitrogen, www.invitrogen.com, and no medium optimization was performed) without hypoxanthine or thymidine. This medium was supplemented with a final concentration of 4-mM L-glutamine and 0.09% Pluronic F-68 copolymer from BASF (www.basf.com) to make a CD-DG44 complete medium that we used to grow both amplified and unamplified DHFR-transfected cells. Media were filtered through a 0.22-µm polyethersulfone (PES) filter and used within a month of manufacture, having been stored at 4 °C and then warmed to 37 °C just before use.
Methotrexate (MTX) Amplification: To increase expression, we exposed the parent cell line to various levels of MTX in shake flasks. A fresh vial was expanded and equally distributed into five 250-mL shaker flasks, each containing 50 mL of CD-G44 complete medium supplemented with increasing concentrations of methotrexate: 0-nM control, 100 nM, 250 nM, 500 nM, and 1,000 nM. We used a 37 °C humidified, 5%-CO2 incubator rotating at 105 rpm for all cultures.
Cell Culture Conditions: Housed in 5%-CO2 humidified 37 °C incubators, cells grew in shake flasks until they attained a density of >1.0×10⁶ viable cells/mL and were subcultured to a seeding density of 0.4×10⁶ viable cells per milliliter of medium. We used other types of static tissue culture containers throughout our robotic optimization process, including 384-well tissue culture treated plates and 96-well, 24-well, and six-well nontissue culture treated plates.
Titer and Stability: We performed terminal and stability shake-flask studies to test the stability of clone productivity both in the presence and the absence of MTX selective pressure. Amplified cultures were grown in MTX-free CD-DG44 complete medium for a 38-day duration (about 17 generations).
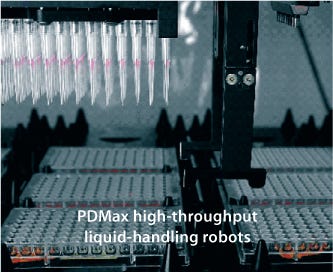
Figure 2:
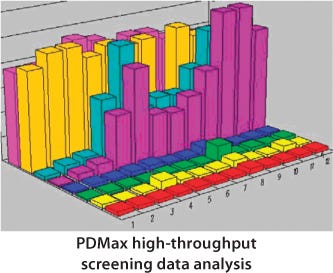
Figure 3
Assays
Cell Count and Viability: We determined the cell count and viability of cultures in flasks using a Vi-CELL XR cell viability analyzer from Beckman-Coulter (www.beckmancoulter.com). This automated cell counter uses the trypan-blue viability dye method and image-analysis software.
We determined viable cell counts for large sets of small-volume samples or cultures using a 384-well plate-based imaging method developed to support high-throughput cell-line development. Cultures were stained and counted using a fluorescent microscope, camera, and image analysis software to determine the number of discrete viable cells per well. During clone screening, colonies with a minimum coverage of 14% of their wells were candidates for transfer to 96-well plates.
Product-Specific Protein Quantitation: We determined protein concentration with a high-throughput 96- or 384-well fluorometric microvolume assay technology (FMAT) system, which is a homogeneous, nonwashing, bead-based immunochemical assay. Its principle is similar to that of a sandwich or competitive ELISA, except that the results readout describes the pixel intensity of an image of beads rather than the absorbance of an enzyme substrate. Our 48-plate feeder/reader from Applied Biosystems (www. appliedbiosystems.com) is controlled by fully automated FMAT software. The detection range of the human growth hormone (hGH) FMAT assay with this particular capture/ detection antibody pair generally is 0.1–5 ng/mL.
Flow Cytometry: Amplified cultures maintained under MTX selective pressure were stained before analysis and/or sorting with flow cytometry. We used methotrexate labeled with fluorescein isothiocyanate (f-MTX) to qualitatively identify highly fluorescent cells in a transfected population that potentially contained the highest copy number of DHFR genes.
We performed analytical flow cytometry and bulk sorting on a MoFlo high-speed flow cytometer from Beckman Coulter equipped with a single 488-nm argon air-cooled laser (100 mW) with forward scatter (diode), side scatter (SSC), and three fluorescence channels (FL1, FL2, FL3). Each sort required ∼10–30 million cells per sample. We operated the flow cytometer under a custom-made HEPA-filtered cleanroom operation using procedures and controls suitable for generating GMP quality cell lines. Sorted cells were cloned by limiting dilution and assessed for productivity by a high-throughput FMAT protein-titer assay.
Results and Discussion
MTX Amplification (Amp-2): Figure 1 shows a recovery profile of cultures from Amp-2 created by tracking the percent-viability of each culture against days of exposure to various concentrations of MTX. By day 14, populations exposed to 500 nM and 1,000 nM of MTX showed signs of stress with viabilities of 62% and 50%, respectively. Throughout the study, we observed no significant killing for either the control unamplified population or the 100-nM MTX or 250-nM MTX-amplified populations. At the end of this three-week amplification process, we froze vials of those cultures that had successfully adapted to various MTX concentrations.
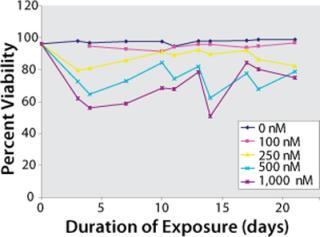
Figure 1: ()
Terminal Titer Study: Before bulk sorting and cloning, we assessed the amplified populations for product expression levels through a seven-day terminal titer study using FMAT analysis. We followed titer values and viable cell densities of the Amp-2 panel over a seven-day period (Figure 2). Product titers increased over time depending on dose with exposure to increasing concentrations of MTX. The day 7 cumulative titer of the unamplified parent cell population was determined to be 11 µg/mL. Day 7 titers of the 100-nM, 250-nM, 500-nM, and 1,000-nM MTX-amplified populations were found to be 32 µg/mL, 51 µg/mL, 66 µg/mL, and 94 µg/mL respectively — ∼3–9×greater than those of the unamplified parent cell line titer. Based on these findings, we selected the 100-nM, 250-nM, 500-nM, and 1,000-nM MTX populations for bulk sorting and limiting dilution cloning.
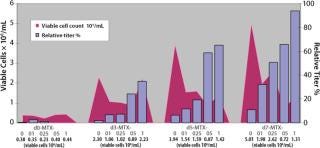
Figure 2: ()
Flow Cytometric Analysis and Bulk Sorting: We used analytical flow cytometry to track amplification by measuring the fluorescence intensity of cells stained with f-MTX. After three weeks of amplification, we collected ∼20×106 viable cells from each of the four amplified cultures (100 nM, 250 nM, 500 nM, and 1,000 nM MTX) and prepared for f-MTX staining and analytical analysis by the flow cytometer.
Figure 3 shows a series of five histograms representing each cell population (dead cells and cell aggregates are excluded by gating windows) of the Amp-2 panel. The data are presented as a one-parameter histogram in which fluorescence is tracked on the X-axis, with staining intensity increasing with the histogram channel numbers.
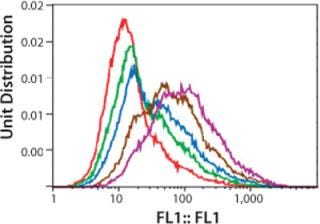
Figure 3 ()
We expected the average fluorescence intensity to increase with increasing concentrations of MTX used during amplification, possibly correlating with increasing copies of the DHFR gene. As Figure 3 shows, a rightward shift of histogram profiles correlated to the exposure of cells to increasing concentrations of methotrexate, so fluorescence intensity of exposed cell populations increased depending on dose. The histogram profile of the 1,000-nM MTX-amplified culture (purple curve) shifted farthest to the right (about one log) relative to the histogram of the unamplified control (0-MTX).
After gating out dead cells and cell aggregates, we selected, sorted, and collected the top-20% fluorescing cells of each amplified population/histogram. About 4×10⁶ cells were collected in the sort procedure for each sample, with >90% viability (Figure 4), and we cultured those overnight in CD-DG44 complete media before limiting-dilution cloning. The histogram shown is a one-parameter analysis of one sample from each sorted population. Samples were analyzed at this point to validate the purity of the “postsort” fractions. In general, the bulk sorted profiles demonstrated a change in relative fluorescence intensity from a lower bimodal distribution to a higher predominantly narrowed single profile.
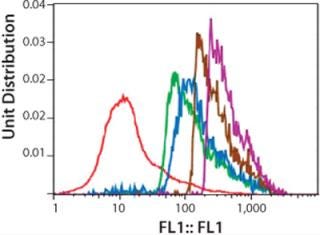
Figure 4: ()
Cloning, Expansion, and Final Cell Line Selection: Amp-2 clones were continually maintained under the selective pressure of methotrexate throughout this project, with the exception of the stability study. Limited-dilution cloning and expansion from each sort followed by cell viability and FMAT assays resulted in the selection of 720 24-well clones based on productivity. After further expansion and assay, we transferred a total of 180 clones to 30 six-well plates: 27×50-nM MTX clones, 132×500-nM MTX clones, and 21×1,000-nM MTX clones. After additional expansion and assay, we chose the top 30 clones based on a calculated sum-ranking value that took into account individual titer-ranking and specific productivity-ranking values. All clones successfully adapted to suspension growth in shake flasks within a two- to three-week period.
10-Day Terminal Shake-Flask Study: We performed a terminal shake-flask titer study on those top 30 suspension-adapted clones to further assess product expression levels and growth characteristics (Table 1). Most of the clones (27/30) we evaluated produced terminal titer values significantly greater than the titer generated by the parent cell line (#31); only clones 3 and 25 were lower. Clone 2 was the highest producer, demonstrating about fivefold greater titer than that of the parent cell line. Its calculated specific productivity improvement (pg/cell/day, PCD) was ~5.4-fold greater than that of the parent cell line.
Table 1. Fold increases in titer and PCD values over those of the parent cell line (31) for the 10-day terminal titer study with MTX
38-Day Terminal Stability Shake-Flask Studies (no MTX): We subjected the finalist clones to a 38-day extended shake-flask study without the presence of MTX (Table 2).
BIOREACTOR RUN DESIGNS
10-L Glass Bioreactor Batches
10 L on 15 May 2007 (30% medium feed)
10 L on 21 May 2007 (30% medium feed with a temperature shift)
XDR-200 Bioreactor Batches (single-use)
200 L at 135 L with 10% feed on Day 7 and harvest on Day 9
200 L at 165 L with 10% feed on Days 5 and 6 and harvest on Day 11
XDR-1000 Bioreactor Batches (single-use)
007A: 10% feed on Days 5 and 6, harvest on Day 10
008A: 15% feed on Day 6 and harvest on Day 10 (+ Supplement A)
008B: 15% feed on Day 5 and harvest on Day 9 (+ Supplement A)
008C: 15% feed on Day 5 and harvest on Day 9 (+ Supplement A)
008D: 15% feed on Day 5 and harvest on Day 9 (+ Supplement A)
Table 2. Relative titers of 10-day terminal study with MTX (from Table 1) and 38-day stability shake-flask study without MTX compared with parent/control (31)
In each study, clones 1, 2, and 28 (highlighted in gray) consistently ranked as the highest-expressing finalists. In the absence of MTX selective pressure, productivity in the new clones dropped off less severely (40%, 75%, and 40%, respectively) than it did in the control parent cell line (about ninefold). Based on these data, Clone 2 demonstrated a 5.0- to 11.4-fold (eightfold average) increase in titer compared with the parent cell line. We set this level of improvement as our target for successful scale-up into 10-L, XDR-200, and XDR-1000 bioreactors.
Bioreactor Scale-Up
Based on its productivity and stability, we chose Clone 2 for verification of performance in 10-L benchtop bioreactors followed by scale-up engineering runs in XDR-200 and XDR-1000 single-use, stirred-tank bioreactors. As mentioned above, we set an eightfold improvement in product titer (over the parent cell line) as a target.
Materials and Methods: The “Run Designs” box presents the significant differences between our 10-L, XDR-200, and XDR-1000 bioreactor runs during scale-up. Due to a limited client budget and project time, we combined several strategies after adjusting for risk. The same unoptimized vendor’s base medium was used in all bioreactor runs, and the “feed” medium composition was the same while we varied the bioreactor percent-volume replacement.
We operated the XDR-200 and XDR-1000 bioreactors at less than their maximum working volumes by request of our client (Figures (567). As this project progressed, we repeated our final bioreactor strategy three times in XDR-1000 runs 8B, 8C, and 8D in which we kept the proprietary medium supplement “A,” its time of addition, and the harvest point locked to achieve optimal product quantity and quality.
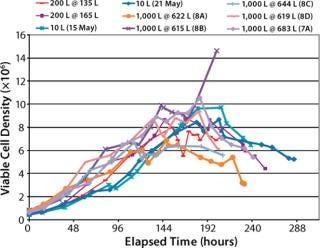
Figure 5: ()
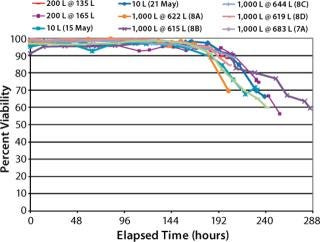
Figure 6: ()
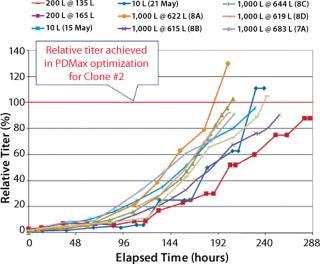
Figure 7: ()
Viable Cell Density (VCD) Comparison (Figure 5): Maximum VCD of the 10-L bioreactor cultures ranged about 8–10×106 viable cells/ mL. Maximum VCD of the XDR-200 cultures ranged about 8–8.5×10⁶ cells/mL. Maximum VCD of the XDR-1000 runs ranged about 6–10×106 cells/mL both with and without supplement “A.”
Cell Percent-Viability Comparison (Figure 6): Cell percent-viabilities for all runs remained >90% until the expected harvest timeframe. We observed no significant differences across the 10 L, 200-L, and 1,000-L scales despite varying supplements and media feeds.
Percent Relative Titer Comparison (Figure 7): For the 10-L runs with Clone 2, the maximum titer reached 88–112% of that achieved by Clone 2 in PDMax high-throughput screening optimization (six- to ninefold higher than the parent cell line in small-scale bioreactors). For the XDR-200 runs, Clone 2 reached 95–98% of the titer achieved in high-throughput screening optimization (about eightfold higher than the parent cell line in small-scale bioreactors). For the XDR-1000 runs, Clone 2 reached 105% of the titer in run 7A without supplement “A.” Runs 8A, 8B, 8C, and 8D reached 98%, 130%, 95%, and 96% respectively of the titer achieved in high-throughput screening optimization (seven- to 10-fold higher than the parent cell line in small-scale bioreactors).
Total average batch duration (hours from inoculation) needed to reach the target titer was reduced from 220 hours in the 10-L runs to ~190 hours in the XDR-1000 bioreactor. Our results and conclusions are limited by the lack of control runs performed using the parent cell line in these bioreactors.
Demonstrated Scalability
We demonstrated successful scale-up of a CHO cell line’s performance from small-scale, high-throughput PDMax laboratory optimization to a 10-L glass and XDR-200 and XDR-1000 single-use bioreactors. The eightfold average improvement in productivity was maintained throughout this scale-up range. After successfully completing engineering performance runs, the cell line was cleared for GMP clinical manufacturing in XDR-1000 single-use bioreactor systems.
You May Also Like

