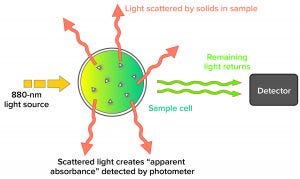
Figure 1: Example of a forward light-scatting turbidity measurement system
Turbidity describes the relative clarity of a liquid as the result of suspended solids. Instruments that measure turbidity typically use a beam of light to detect particles by measuring the difference between the amount of light emitted from the light source and the amount that is received by a detector. Such measurements are affected by the size, shape, and number of particles in a sample of liquid because those solids scatter the incoming light, which provides an apparent absorbance that is measured by the detector. By contrast, PendoTech’s turbidity measurement system uses “forward light scattering” to measure turbidity: It detects the scattering of light that passes straight through a sample (Figure 1).
In bioprocess operations, the turbidity of a fluid often is measured to monitor unclarified material that leaves a bioreactor or fermentation vessel. Turbidity measurements also are taken to analyze filter performance. Those measurements are made after filtration to detect “breakthrough” or undesired materials coming from a filter, which can indicate that the filter is losing its retention capacity. In conjunction with pressure measurements, turbidity monitoring can be used to provide an overall assessment of filter performance.
Historically, turbidity measurements generally have been made through off-line sampling. That is inefficient, however, and often disruptive to a bioprocess. Now, PendoTech’s single-use turbidity measurement system takes on-line measurements, allowing users to monitor turbidity in real time. The system also uses a single-use flow cell that eliminates typical maintenance requirements, such as calibration and cleaning. Those flow cells are also robust enough that they can be cleaned and reused repeatedly, making PendoTech’s turbidity system suitable for both process development and manufacturing applications.
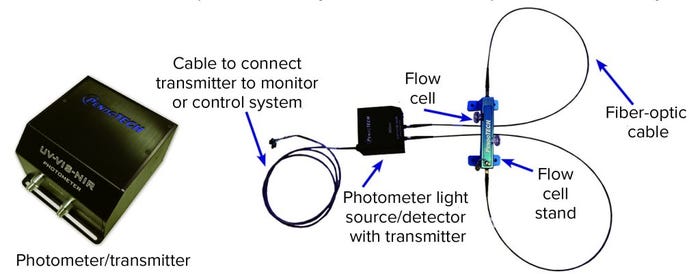
Figure 2: PendoTech turbidity system setup
System Overview
The PendoTech turbidity system is a compact photometer equipped with an 880-nm light source and fiber-optic cables that connect to a flow-cell stand that houses a single-use turbidity flow cell (Figure 2). Recently, the company made significant upgrades to this system with inclusion of an advanced, high-performance photometer and addition of a new flow-cell stand.
The advanced photometer features
an enhanced response and improved accuracy
an illuminated indicator that shows the status of the device
the ability to read up to 3.00 AU.
The photometer comes in benchtop and panel-mounted configurations (Figure 3). Because the photometer outputs results in absorbance units (AUs), the system does not have an exact accuracy specification for nephelometric turbidity units (NTU). Relative NTU accuracy depends on the development of an NTU-to-AU correlation curve.
The addition of a flow-cell stand (Figure 4) is a critical aspect of the latest upgrade. The stand makes this turbidity system much more convenient for users, allowing them essentially to “drop” flow cells into place. That makes them easy to swap in and out of the system. The stand also acts as a barrier to ambient light and is designed to minimize air bubbles, both of which can compromise reading accuracy.

Figure 3: Back panel of benchtop (left) and panel-mounted (right) advanced photometer models
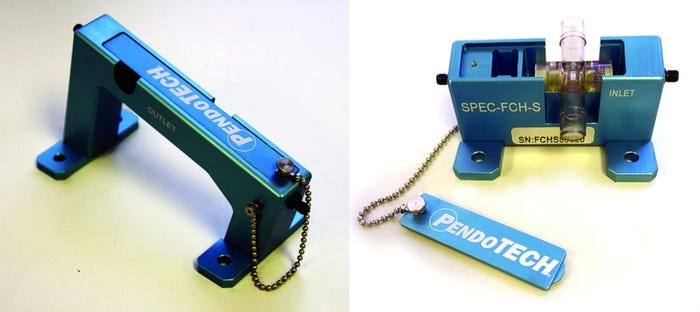
Figure 4: The large flow-cell stand (left) accommodates 6.5-cm pathlength flow cells; the small flow-cell stand (right) can hold all other sizes.
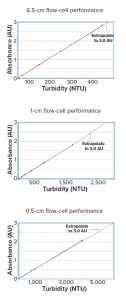
Figure 5: 6.5-cm (top), 1-cm (middle), and 0.5-cm (bottom) flow-cell performance
Validation Testing and Results
Extensive validation testing was performed for evaluating the accuracy, repeatability, and true dynamic range of PendoTech’s upgraded turbidity system. Formazin NTU turbidity standards — traceable to the US National Institute of Standards and Technology (NIST) — were used to analyze the correlation between turbidity (in NTU) and absorbance (as measured by the system in AU). PendoTech circulated those standards through its single-use flow cells with optical path lengths of 6.5 cm, 1 cm, and 0.5 cm. Averages and standard deviations of the resulting absorbance readings were calculated across three or more flow cells of each type to characterize their performance.
NTU standards of 20, 100, 200, and 400 NTUs were circulated through a 6.5-cm flow cell, and the corresponding absorbance values measured from the PendoTech unit were recorded (Figure 5). Results demonstrated a linear correlation between the turbidity values and absorbance readings (R2 > 0.9999). An extrapolation to 3.0 AUs correlated to a turbidity value of about 425 NTUs.
NTU standards of 100, 200, 400, 800, and 1,700 NTUs were circulated through a 1-cm flow cell, and the corresponding absorbance values measured from the PendoTech unit were recorded (Figure 5). Results demonstrate a linear correlation between the turbidity values and absorbance readings (R2 = 0.9998). An extrapolation to 3.0 AUs correlated to a turbidity value of approximately 2,750 NTUs.
NTU standards of 200, 400, 800, 1,000, and 4,000 NTUs were circulated through a 0.5-cm flow cell, and the corresponding absorbance values measured from the PendoTech unit were recorded (Figure 5). Results demonstrate a linear correlation between the turbidity values and absorbance readings (R2 = 0.9999). An extrapolation to 3.0 AUs correlated to a turbidity value of approximately 6,000 NTUs.
Performance Confirmed
PendoTech’s single-use turbidity system reveals a highly linear correlation between turbidity of a sample and the measured absorbance. The data above support an overall accuracy specification of ±1% (±0.03 AU) from 0 AU to 2 AU and of ±2% (±0.06 AU) from 2 AU to 3AU. Table 1 shows an approximate conversion of that specification to NTUs. The system does not have an exact NTU accuracy specification because that depends on an NTU-to-AU correlation curve, which can be developed with off-line sampling and is specific to each type of sample. PendoTech finds very little variance from flow cell to flow cell, which provides for an overall repeatability of ±0.5% at full scale (±0.015 AU) for the system.

Nick Troise is an R&D engineer at PendoTech in Princeton, NJ; 1-609-541-7135; [email protected]; https://www.pendotech.com.


