Control of Protein A Column Loading During Continuous Antibody Production: A Technology Overview of Real-Time Titer Measurement Methods
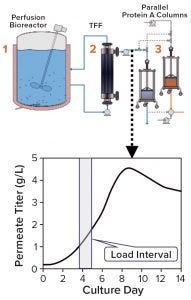
Figure 1: Titer in the protein A load (permeate) changes over a load interval during continuous production due to variations in cell density and cell-specific productivity in the perfusion reactor. The system shown here using two parallel protein A columns is a design currently used at BI Fremont in California, but other configurations are possible.
During production of therapeutic antibodies, harvest titer is measured to monitor product mass loaded onto the protein A capture column. This prevents both column underloading (underusing expensive resin) and overloading (wasting product as flow-through (FT)) while allowing for column yield calculations. Batch production yields a single homogenous harvest pool, thus only one titer measurement (along with volume loaded) is sufficient to determine the mass loaded. During continuous production, however, cell-free harvest (permeate) continuously exits a perfusion reactor and loads a protein A column, so the product titer can vary over the loading period (Figure 1), making several titer measurements necessary to control mass loaded. Titer results also must be available in time to stop loading when the target mass has been reached.
In addition to other requirements discussed below, those frequency and timeliness requirements in titer measurement during continuous production tend to demand the use of a method other than traditional offline affinity high-performance liquid chromatography (HPLC). Here, we review several potentially appropriate methods that currently are available or under development. And we describe our experiences with these methods at our Boehringer Ingelheim (BI) development and manufacturing site for biopharmaceuticals in Fremont, CA.
Methods appropriate for measuring titer and other parameters during continuous production are becoming increasingly important with the industry’s growing adoption of continuous processes. Important drivers of that trend include consistent growth in demand for biologic drugs and the distinct advantages of continuous over batch processing: reduced capital equipment costs and facility size, improved productivity, increased process flexibility, and consistency in product quality (1, 2).
Factors to Consider in Choosing a Titer Measurement Method: Some considerations for choosing a titer method depend on the measurement format (whether it is offline, atline, online, or inline); other factors are independent of format. We define terms as follows:
offline (manual sampling, measurement outside the production area)
atline (manual sampling, measurement within the production area)
online (automated sampling, measurement in the production area)
inline (no sampling, measurement in the production area by a probe placed in the product stream).
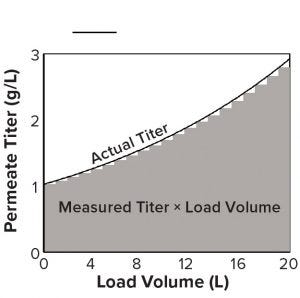
Figure 2: A titer measurement during loading, multiplied by the volume loaded, is the area of a bar under the curve, the sum of which approximates the total area and mass loaded during a cycle.
Factors independent of method format include measurement frequency, accuracy, and precision, all of which influence the accuracy of the mass-load measurement, which can be conceptualized as the area under a curve that delineates titer and load volume (Figure 2). The area of each vertical bar under the curve is an incremental mass load equal to the titer multiplied by the volume loaded after that titer measurement. When titer is measured again, the volume loaded restarts. The sum of all bars estimates the total mass loaded.
Inadequate measurement frequency during titer upswings will miss a substantial area under the curve, leading to underestimates of loaded mass (and overestimates during downswings). Bias and imprecision also will lead to inaccurately loaded mass, with the caveat that imprecision may be overcome if an adequate number of titer measurements are collected over the course of the load. An alternative is to average multiple measurements of each sample if staff effort and cost allow.
Other factors independent of method format include
an instrument’s cost-effectiveness and risk of failure (reliability)
timeliness of results (to ensure timely stoppage of column loading, thus preventing under- or over-loading)
the capacity for method validation when used during good manufacturing practice (GMP) production
staff time required for manual collection and analysis of samples, delivering results to production operators, and tending to an instrument.
Staff time can be reduced with an autosampler and by automating analysis and transfer of titer results from the analytical instrument to supervisory control and data acquisition (SCADA) software controlling the production process. Some instrument vendors have designed their software to communicate seamlessly with SCADA packages, whereas others require “middleware” that translates an instrument’s communications into a form that SCADA software can interpret.
Several factors are relevant to atline, online, and inline methods that require locating analytical equipment in the often-limited production space. Given the limited space, it is unlikely that a duplicate will be present if an instrument has a substantial footprint, so one question to consider is how measurements can continue if that instrument fails. If repair or replacement is possible, how quickly can that occur? If it is slow, can measurements continue with a duplicate instrument in an adjacent room? An option might be to use traditional offline HPLC titer measurement as a backup method, but analytical differences are likely when the original method uses a different measurement principle. An offline method also requires staff to be made ready for the 24-hours/day, seven days/week workload of a continuous production process. If a method is online or inline, with a sampling tube or probe contacting the product stream, will the production process remain sterile both during normal operations and after instrument repair or replacement? Ensuring sterility is essential for method validation.
Method Details
Chromatographic Methods — Traditional HPLC Titer (Offline): Traditional offline HPLC titer using analytical protein A affinity chromatography offers the accuracy, precision, reliability, validation-readiness, and moderate cost (~$95,000) that have made it the default method for measuring protein expression titers during batch production. When applied to a continuous process, it does not occupy production space because the instrument resides elsewhere. Measurement continues easily if the main instrument fails because other similar instruments are common in analytical laboratories. Measurements have a low risk of contaminating the process stream with manual sampling by syringe rather than a tube connected to the process stream for the run duration.
On the other hand, considerable staff time can be spent manually sampling a production process and tending to the HPLC instrument to generate titer results of adequate frequency. Without an automated data connection to send results from the instrument to SCADA software, analysts also must deliver results quickly to a production operator to prevent over- or underloading of the capture column. For these reasons, the alternative methods described below should be considered and weighed against this traditional method for continuous production processes.
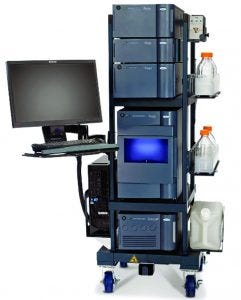
Figure 3: The Waters Patrol ultraperformance liquid chromatography (UPLC) instrument (https://www.waters.com)
Chromatographic Methods — Patrol UPLC (Online): The Patrol portable ultraperformance liquid chromatography (UPLC) instrument can be placed in the production space to sample load material automatically through an aseptic sampling tee and HPLC tubing leading to the instrument. It then measures load titer using the traditional HPLC titer method, yielding results that are equivalent to those from the traditional method (Figures 3 and 4). Automated sampling provides frequent results and reduces staff time requirements. The instrument can reduce staff time requirements further and deliver timely results by sending them automatically to process SCADA software. However, middleware (e.g., the Mystro program from One Hill Solutions) is necessary because the Patrol control software (Waters Empower) does not connect directly to SCADA software.
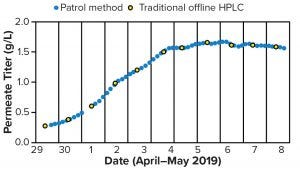
Figure 4: Comparing example titer results from a Waters Patrol instrument (blue circles) with traditional offline high-performance liquid chromatography (HPLC) titer (yellow cricles during continuous production)
A drawback of Patrol systems is the mechanical complexity of the process sample manager (PSM) responsible for online sampling. Its multiple pumps and valves can cause occasional instrument failures. Some repairs may take time, necessitating replacement with a redundant unit or a backup method. At ~US$200,000 per instrument, Patrol redundancy can be expensive. The instrument also requires substantial space (its footprint is roughly the same as that of a traditional HPLC, but the height is ~5.5 feet). The online sampling connection brings risk of process contamination, and it must be validated before the instrument can be used in a GMP production environment.
Idex Tridex Analysis (Online): The Idex Tridex protein analyzer is an instrument about the size of a large desktop computer (Figure 5). It is designed for measuring titer using the traditional offline HPLC method, but integration with a Flownamics Seg-Flow or Lonza MAST autosampler automates the sampling, and included software can integrate chromatograms automatically as well. Unfortunately, transfer of titer results to a SCADA software still is not automated, but the results are stored in “csv” file format on the instrument, which allows a process operator to view them through a network. The cost of the instrument is relatively low (~$60,000), but it does require some extra costs for single-use supplies: a reagent pack of mobile phase (~$1,500) and an analysis module (analytical column cartridge, valve, and A280 cell, ~$3,000), both of which measure 1,000 samples or last 90 days in the instrument. The supplier claims that no preventive maintenance is needed for the stated seven-year unit life, and the system will be made capable of installation, operation, and performance qualification (IQ, OQ, PQ) in the future. That would lend confidence that the method can be validated for use in GMP production spaces.
With an online autosampler, the Tridex method introduces some process contamination risk but provides for adequate measurement frequency and savings of staff time for sampling. A current lack of automated results delivery to SCADA software could cause unacceptable delays in preventing column under- or overloading. Cost and space requirements are relatively low. In the event of instrument failure, exchanging the single-use chromatography device or the entire instrument should be fast and relatively inexpensive. Thus far, limited studies at BI have demonstrated adequate precision but questionable accuracy as demonstrated by sporadic correlation with traditional HPLC results — possibly due to peak tailing and carryover from suboptimal mobile phases for the products studied (data not shown). Future trials with method modifications are planned. Given the limited timeframe of our BI studies, instrument reliability has not been tested.
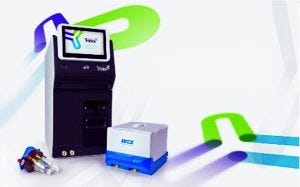
Figure 5: The Tridex instrument (Idex Health and Science, https://www.idex-hs.com)
Optical Methods — Raman Spectroscopy (Inline): A portion of radiation scattered from a sample will differ in wavelength from the incident light when that sample has a chemical bond that changes in polarizability during vibration. Raman spectroscopy measures the intensity and difference in wavelength from the incident light of that scattered radiation (3). Because of the many bond types in harvest fluid — and local effects on bond polarizability — Raman spectra contain substantial information about cell culture composition, including nutrients, metabolites, and cell density (4). The number of components that can be monitored this way (including product titer) has grown as the technology has matured.
Raman measurement requires development of models that correlate Raman spectral features with traditional offline analyses, usually tested over several runs to capture process variability. Companies offering Raman instruments suitable for bioprocessing include Kaiser Optical Systems and Resolution Spectra Systems. One available Kaiser system has an optical tube with a window at the tip and a probe head that attaches to the tube and conveys optical signals by fiber optics to an analyzer, which is similar in size to a wide desktop computer (Figure 6). One possible setup for measuring titer during continuous production would be to insert the Raman probe in a flow cell through which permeate flows before loading the capture column.
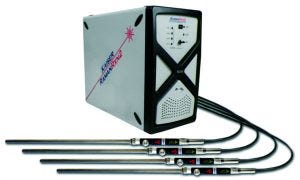
Figure 6: The RamanRxn2 Hybrid Analyzer instrument (Kaiser Optical Systems, http://www.kosi.com)
Simple inline setup, constant monitoring, moderate space requirements (which are becoming smaller over time), reduced staff time for setup and operation, and the potential for automating reports of titer values to SCADA software all enable Raman spectroscopy to deliver high measurement frequency and timely results using a moderate footprint and minimal staff time. If the probe head, fiber optic cable, or analyzer fails, it can be replaced quickly without disturbing the production process. Although substantial staff time could be required to build an adequate model correlating spectral features with offline results, such a model can generalize to different products, cell lines, media, and reactor volumes, thereby increasing return on investment (5).
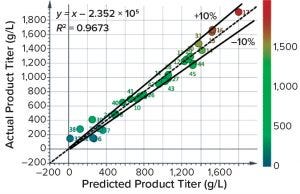
Figure 7: Results of a trial at BI Biberach investigating the ability of Raman spectra to predict antibody titer; most predictions are within 10% cross-validation error. BI’s Dr. Thomas Wucherpfennig hosted the Raman experiments, and Resolution Spectra Systems evaluated the Raman spectral data.
Kaiser reports that its units have been operating in GMP production spaces with validated methods, so GMP readiness for other production operations should be straightforward. In terms of accuracy, one experiment at BI using a Resolution Spectra Systems probe yielded a model that could predict titer mostly within a 10% cross-validation error (Figure 7). Fluorescence appears to have interfered in that case, so results could improve in future trials. Raman operation during that test was limited, so we cannot comment on reliability. A Kaiser RamanRxn2 instrument with one probe costs ~$157,000, making the unit more expensive than other technologies. But the extra cost can be justified if the Raman method enables measurement of other parameters (e.g., glutamine, glutamate, ammonium, glucose, and lactate), thereby reducing or eliminating the need for traditional assays of titer or other parameters.
Optical Methods — FlowVPE Instrument (Inline): The FlowVPE instrument is an automated and inline version of the atline SoloVPE slope spectroscopy instrument offered by C Technologies (Figure 8). Whereas the inline version uses a sample cuvette that is manually filled and placed onto the instrument, the automated version uses a flow cell. Both vary the vertical position of a fibrette inside the sample to measure the slope of the absorbance/pathlength curve, and thus infer product concentration. Absorbance is measured through a fiber optic cable connecting the VPE unit to a separate Cary 60 spectrophotometer from Agilent Technologies. SoloVPE instruments currently are used to measure purified product concentration by validated methods in several GMP production spaces.
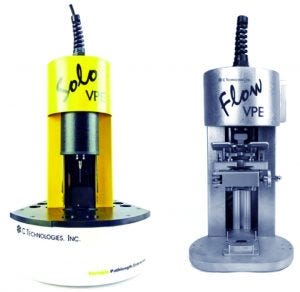
Figure 8: (left) SoloVPE and (right) FlowVPE instruments (C Technologies, now part of Repligen, https://www.ctechnologiesinc.com)
Once a protein A column equilibrates during loading, the flowthrough (FT) material exiting its outlet contains all load components but for the antibody product that has bound to the resin. Slope-spectroscopic and refractive-index methods (see below) leverage that fact by subtracting the FT signal from the load signal to infer titer (Figure 9). Thus, to measure titer, users measure samples at both the column inlet and outlet, then establish a calibration that correlates the signal difference with load titer.
(Of note for using the subtractive method is that when load composition changes quickly — e.g. because of rapid cell-density change — the FT also will change composition quickly. During rapidly changing load composition, FT collected at the same time as the load, or several column volumes afterwards, would not equal the load minus the MAb. Using FT collected one column volume after the load will give the most accurate titer results.)
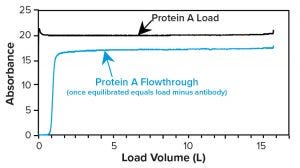
Figure 9: Example absorbance of protein A load and flowthrough (FT) plotted against load volume; load absorbance is due to antibodies, media, and metabolites; FT absorbance is due to media and metabolites only. Thus, the difference in absorbance indicates titer.
The automated inline FlowVPE instrument simplifies delivery of frequent and timely results, making it the better choice over more labor-intensive SoloVPE systems for continuous production. Discussion here thus focuses on the inline instrument. Advantages include high measurement frequency (as often as every ~11 seconds), timeliness of results that are sent automatically by analog signal to SCADA software, and minimal staff time requirements for sampling and analysis. C Technologies reports that the autoclavable stainless steel flow cells already are used in GMP production spaces, and a single-use version is under development. Method validation thus should be straightforward.
 Disadvantages of this slope spectroscopy instrument include footprint and expense: Two full ~$90,000 instruments would be required to measure load and FT. Also, we have seen flow-cell window fouling with a unit placed at the column outlet, raising concerns about method reliability. Because the entire product stream passes through the flow cell, such fouling or other form of instrument failure would require tube welding and instrument exchange to resume measurements, forcing a pause in production and risking process contamination. We have not used this instrument extensively to measure titer, so we cannot comment on whether the process remains sterile during long-term operation.
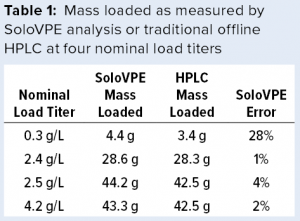
Given the similarity between the two instruments, we performed bench studies on a SoloVPE unit to gauge the precision and accuracy of the FlowVPE version. We collected load material at different column volumes (CVs) for each of four nominal load titers and measured the titer of each sample with the SoloVPE instrument and traditional protein A HPLC. The SoloVPE titer error was at times >5% and biased slightly high on average (Figure 10). However, integrating the titer/volume curve (by multiplying each SoloVPE titer by volume loaded, then summing) gave errors ≤4% in total mass loaded for all but the lowest titer load (0.3 g/L), for which the error was 28% (Table 1). Thus, as mentioned above, integrating several individual measurements across a load could help overcome method imprecision and allow the instrument to deliver adequately accurate mass loading at higher titers.
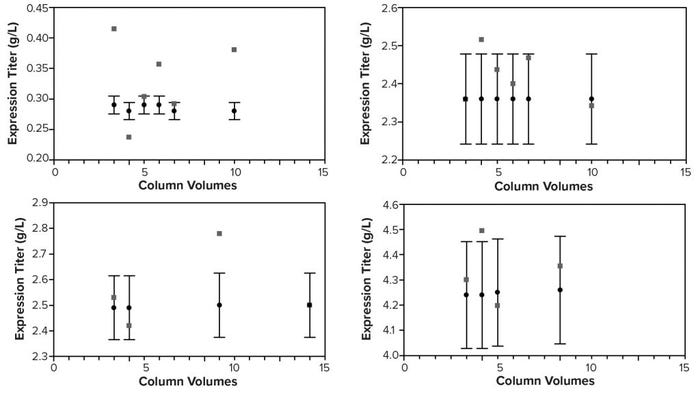
Figure 10: SoloVPE instrument and traditional high-performance liquid chromatography (HPLC) titers by column volumes (CV) for four nominal load titers; error bars on the HPLC titers show measured value ±5% to help gauge SoloVPE titer error.
Optical Methods — Refractive Index (RI) (Inline/Online): When light passes at an angle through the interface between two fluids that have different refractive indices, the beam changes direction (6). The extent of that direction change increases with the refractive index difference between the two liquids. Differential refractive index (dRI) detectors commonly used in liquid chromatography use this principle to detect analytes after separation. The dRI detector contains a two-sided flow cell: a reference side for the mobile phase isolated from the chromatography column outlet, and a sample side through which analytes dissolved in the mobile phase pass. Because the refractive indices of the analytes differ from that of the mobile phase, a dRI signal is generated and the analytes are detected.
Users can apply the same detector to measure load titer during continuous production because the antibody concentration difference between the protein A load and FT creates a proportional difference in their refractive indices. A possible setup for this method is to use a typical HPLC pump (~$25,000) to pump both load and FT from sampling tees to the dRI detector (~$13,000). The FT fills the reference side of the flow cell, and the load continuously flows through the sample side. A stream of dRI values sent by analog signal to the SCADA software then could be used to infer a continuous load-titer measurement based on appropriate calibration. Periodically, a user would refresh the FT to keep it representative of what is actually exiting the column. Such a setup would deliver a timely, continuous titer value inexpensively (~$38,000 for pump and detector), occupy minimal space, and allow for rapid exchange of parts upon instrument failure. It would minimize staff time by eliminating the need for sampling, analysis, and delivery of results to an operator.
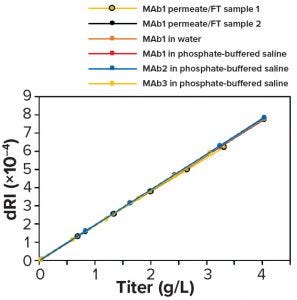
Figure 11: Differential refractive index (dRI) calibration curves made from standards in different matrices — permeate/flowthrough (FT), water, phosphate-buffered saline (PBS), permeate/FT from a different production run, and different antibody products (MAb1, MAb2) — all are equivalent.
A dRI detector can be calibrated for load-titer measurement in several ways. Using a series of standards made from a high-titer load material diluted with different amounts of FT is most representative of the actual load and FT introduced into the detector when measuring titer. However, FT normally is not collected during continuous processing. An alternative method that we used to derive results presented herein, is to diafilter a purified antibody product into water or phosphate-buffered saline (PBS), then dilute the diafiltered product with the same water or PBS to desired concentrations for calibration standards.
A test at BI on one molecule (MAb1) showed that calibration using water or PBS was nearly identical to that using permeate and FT, which shows that calibration is insensitive to matrix differences (Figure 11). Calibration using standards made with permeate/FT from a different production run and with different antibodies (MAb2 and MAb3) in PBS all gave nearly identical results, thus demonstrating calibration repeatability and showing that one calibration can apply to several antibody products. Also, calibration is linear up to 25 g/L, well beyond the highest titer expected in Chinese hamster ovary (CHO) cell culture (data not shown). That limit corresponded to the maximum readable dRI of the detector used in our experiments.
To measure the accuracy of the RI method, we compared RI titers with traditional HPLC titers of samples collected during five perfusion runs. The correlation was near parity (slope = 1.023), with a coefficient of determination near one (R2 = 0.997) (Figure 12, left). Errors >10% occurred only in low-titer samples (0.20–0.31 g/L), where a higher error percentage is more likely (Figure 12, right). To estimate RI method precision, we measured a control sample eight times over several months. The coefficient of variation (CV) was <0.5%, demonstrating adequate precision. The absence of online testing of this method during an actual production process at BI prevents us from evaluating its reliability.
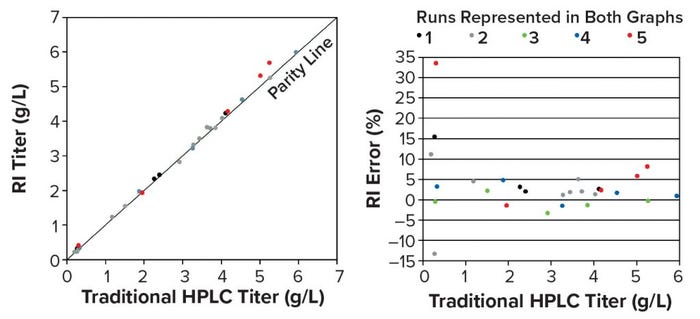
Figure 12: (left) Parity plot of traditional offline HPLC and RI titers across five perfusion runs; (right) RI titer error >10% occurred only in low-titer samples (0.20–0.31 g/L).
Despite the benefits of the RI titer method, it does have some drawbacks. For example, the two sampling tees increase process contamination risk. Also, if the protein A column develops channels or resin binds antibodies incompletely (e.g., from excessive caustic stripping), then the FT would rentain some antibody, thus eliminating the possibility of accurately measuring load titer. In such situations the RI method would measure only the titer difference between the inlet and outlet.
When testing the stability of the dRI signal over 12 hours, the longest expected loading period, we found that it became unstable after about seven hours, revealing a potential source of unreliability in the method. In our test, the reference side of the flow cell was filled with FT and then closed. Thus, a possible cause for the instability is chemical change or microbial growth in the static FT sequestered in the reference side of the flow cell. If that is the case, then it could be overcome by periodic flushing of the reference side with fresh FT. Such flushing is likely to occur anyway given the need to maintain FT representativeness when load composition is dynamic. Given these drawbacks, the possibility of validating such a dRI method for use in GMP production spaces is uncertain.
An alternative solution that could circumvent those drawbacks would be to use RI probes currently under development at Pall Biotech. Probes inserted into flow cells and placed at column inlet and outlet could measure absolute RI of load and FT. The outlet probe would measure absolute RI independent from the inlet, thus detecting column channeling or incomplete binding as a sudden or gradual increase in the signal over time. In addition, there would be no need to sequester FT in a flow cell, thus preventing changes to sequestered material and the consequent signal instability of dRI detectors. Measured FT would be exactly one column volume after each load, an ideal situation when load changes composition quickly. Two such probes are inexpensive (~$41,000) relative to other titer measurement instruments. A drawback is the need to stop flow and weld a replacement probe into place when the existing probe fails.
Turbidimetric: In this method, rabbit serum anti-IgG antibodies bind to sample antibodies, forming aggregates that scatter light, which is measured as absorbance at 340 nm. Background absorbance is measured at 652 or 659 nm. Titer is inferred from the background-corrected absorbance using a five-point calibration curve typically generated using a commercially available calibrant from Roche.

Figure 13: Cedex Bio and Bio HT Analyzer instruments (Roche Custom Biotech,
http://custombiotech.roche.com)
The two available instrument models — Roche-trademaked Cedex Bio and Bio HT analyzers (Figure 13) — are both Roche products and use the same assays. But the latter is designed for high-throughput applications and has proven compatibility with Flownamics Seg-Flow autosamplers. Although an autosampler introduces some process contamination risk, it eliminates staff time needed for sampling. Titer results can be sent to SCADA software using Sm@rtLine Data Cockpit (SDC) middleware, thereby delivering timely titer results and further reducing staff effort. Costs are moderate (Cedex Bio analyzer at ~$55,000 and Cedex Bio HT analyzer at ~$100,000), and the Bio HT analyzer is reliable and capable of being validated as demonstrated by years of use for in-process control in GMP spaces at our site.
Despite those benefits, this turbidimetric method brings some drawbacks. Instrument complexity requires substantial time for repairs when necessary, forcing use of a redundant instrument or another method rather than waiting for an instrument repair. If a redundant instrument is used, it is likely to reside outside the production space because of the relatively large footprint of these machines. Another issue is the requirement for analysts to refill consumables. Also, the supplied calibrant could yield a calibration curve inferring results that do not correlate 1:1 with traditional offline HPLC results. For example, at our site we found the ratio ranged from 0.94:1 to 1.01:1 across three MAbs studied.
We hypothesize that the anti-IgG antibodies used in the turbidimetric assay have different affinities for the commercially available calibrant than for the antibodies generated at our site. Users might overcome this problem by choosing to calibrate with load from the process being measured, which is an option that the vendor explicitly mentions. During our tests, we also encountered interference from culture media, imprecision illustrated by day-to-day variability in control samples, and late culture samples showing greater deviations from traditional offline HPLC titer than early culture samples. For these reasons, the accuracy and precision of this method should be evaluated thoroughly before it is used to measure load titer in a given process.
Next Steps
Currently, no single method for measuring titer during continuous production at BI is clearly superior to the others, so we are continuing our evaluations. The Patrol system remains our default method because of its use of accurate and precise traditional HPLC affinity chromatography, its integrated automated sampling, and its ability to deliver results to SCADA software through middleware. We believe that those benefits outweigh the high cost, risk of instrument failure, larger space requirement, and staff time needed to work the instrument. Although the Idex Tridex system — with its reduced footprint, lower cost, and ease of repair or replacement — does provide an attractive alternative, its accuracy must improve, and transfer of results to SCADA software must be automated. We find the Raman method to be attractive because of its inline nature and potential measurement of many parameters, but measurement accuracy remains unproven. Inferring titer by RI also shows promise but has yet to be tested at scale.
Acknowledgments
We thank members of the Bioprocess Engineering group at BI Fremont for reviewing this article; Michael O’Connor at Pfizer for the graphic of a perfusion reactor and protein A columns in Figure 1; Dr. Thomas Wucherpfennig (BI Biberach) for hosting the Raman experiments; and Resolution Spectra Systems for evaluating the Raman data shown in Figure 7. We also thank Waters, Idex, Kaiser Optical Systems, C Technologies, and Roche Diagnostics International for images used herein.
References
1 Pohlschmidt M, Kiss R, Gottschalk U. An Introduction to Recent Trends in the Biotechnology Industry: Development and Manufacturing of Recombinant Antibodies and Proteins. New Bioprocessing Strategies: Development and Manufacturing of Recombinant Antibodies and Proteins. Kiss R, Gottschalk U, Pohlschmidt M, Eds. Advances in Biochemical Engineering/Biotechnology series Vol 165. Springer: Basel, Switzerland, 2018: 1–8.
2 Zydney AL. Continuous Downstream Processing for High Value Biological Products: A Review. Biotechnol Bioeng. 113, 2016: 465–475.
3 Skoog DA, Leary JL. Raman Spectroscopy. Principles of Instrumental Analysis: Fourth Edition. Saunders College Publishing: Orlando, FL, 1992: 296–309.
4 Esmonde-White KA, et al. Raman Spectroscopy As a Process Analytical Technology for Pharmaceutical Manufacturing and Bioprocessing. Anal. Bioanal. Chem. 409(3) 2017: 637–649; https://doi.org/10.1007/s00216-016-9824-1.
5 Mehdizadeh H, et al. Generic Raman-Based Calibration Models Enabling Real-Time Monitoring of Cell Culture Bioreactors. Cell Cult. Tissue Eng. 31(4) 2015: 1004–1013; https://doi.org/10.1002/btpr.2079.
6 Skoog DA, Leary JL. Properties of Electromagnetic Radiation. Principles of Instrumental Analysis: Fourth Edition. Saunders College Publishing: Orlando, FL, 1992: 58–78.
Corresponding author Jeffrey D. Goby ([email protected]), Joelle N. Khouri, Anoushka Durve, and Kenji Furuya all work in the process science group at Boehringer Ingelheim in Fremont, CA. Their former colleague, Eike Zimmermann, is now director of product quality at Allogene Therapeutics. All images and trademarks herein are the properties of their respective owners. Patrol and Empower are registered trademarks of Waters. Mystro is a registered trademark of One Hill Solutions. Tridex is a trademark of Idex Health and Science. Seg-Flow is a registered trademark of Flownamics. MAST is a trademar of Lonza. RamanRxn2 is a trademar of Kaiser Optical Systems. FlowVPE and SoloVPE are registered trademarks of C Technologies. Cedex is a trademark of Roche.
You May Also Like

