April 2019 Featured Report
Figure 1: Data-integrity warning letters for 2016
Data integrity is achievable when data collection is complete, consistent, and accurate (
1
). Failure to maintain data integrity compromises a company’s ability to demonstrate the safety and efficacy of its products. Escalation of serious regulatory actions related to data integrity violations has prompted the need to assess data integrity compliance and implement systems designed to guarantee it. Comprehensive measures must be taken to ensure that data are attributable, legible, contemporaneous, original, and accurate (ALCOA) (
2
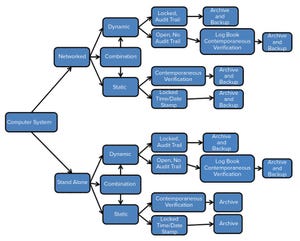
). Preventive measures need to be implemented to ensure that validity, accessibility, and integrity of data are maintained throughout a defined retention period. Automated system controls aimed at data integrity assurance include written procedures, system validations, change control, system security (physical and logical), electronic signatures, and audit trails, as well as data archive, backup, and retrieval. Incorporation of ...
Figure 1: General principles for application of collaborative robots in manufacturing
It should come as no surprise to anyone familiar with biomanufacturing that current designs of bioprocess facilities as well as associated manufacturing spaces and support operations require excessive amounts of manual labor and manual interventions that lead to high labor costs and, consequently, total cost to supply. From receipt of raw materials to process execution and performance review, resolution of quality issues, and product shipping, no industry devotes a greater percentage of operating costs (or cost of goods sold, CoGS) to labor than biomanufacturing. For example, 35–50% of labor cost is typical in biomanufacturing (
1
,
17
) compared with 10–14% for the next highest industry (
1
,
2
). Increasing availability of in-line sensor technologies, adoption of paperless manufacturing and laboratory execution systems (MES/LES), integration of multiple control systems, automated processing without manual interventio...
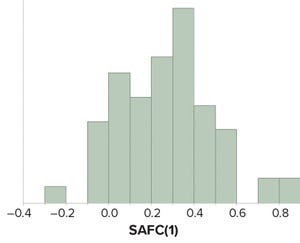
Figure 1: Values of sample autocorrelation function at lag 1 — SACF(1) — from attributes amenable to statistical analysis for continued process verification of a product line.
Control charts are used to assist in process monitoring activities. They use an estimate of central tendency (the overall mean) and variation (the standard deviation). Sample standard deviations (S) tend to underestimate process standard deviations (σ) when they are calculated using limited sample sizes of independent results (
1
). For this reason, the unbiasing constant
c
4
is used as a divisor when calculating Shewhart control-chart limits. If data used for control charting are positively autocorrelated, that tends to underestimate σ further and compromise the utility of such widely used constants.
Prevalence of Positively Autocorrelated Data in Drug Product Manufacturing
Continued process verification (CPV) is performed during stage 3 of the process validation lifecycle. The purpose of CPV is to monitor critical process parame...
