Rapid Generation of High-Producing Clonal Cell Lines: Using FRET-Based Microfluidic Screening for Analysis, Sorting, Imaging, and DispensingRapid Generation of High-Producing Clonal Cell Lines: Using FRET-Based Microfluidic Screening for Analysis, Sorting, Imaging, and Dispensing
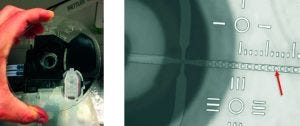
Figure 1: A disposable sorting cartridge (LEFT) for the Cyto-Mine cell sorter and droplet dispenser; zoomed-in image of a cartridge in use (RIGHT); the red arrow denotes a single picodroplet.
Sales of monoclonal antibodies (MAbs) are predicted to be over US$125 billion by 2020 (1). Such revenue potential puts significant pressure on the biopharmaceutical industry to reduce timelines, especially to first-in-human trials. Cell-line development represents a large and critical portion of the early development timeline.
Whether a developer is using random or targeted integration for introducing genes into a host-cell genome, the regulatory requirement for addressing monoclonality introduces a time and resource-intensive step in this process. Many different techniques are used routinely in biopharmaceutical discovery and development workflows: single-cell analysis, sorting, imaging, and dispensing into individual wells of microplates (2). In addition, a productivity screening method such as minipool titering or fluorescence-activated cell sorting (FACS) analysis typically is performed before the monoclonality stage to minimize labor (3). Traditionally, different pieces of equipment would be required for each of these techniques, resulting in a costly and time-consuming process that both takes up valuable laboratory space and increases the risk of sample contamination.
The Janssen R&D cell-line development (CLD) group partnered with Sphere Fluidics to evaluate its Cyto-Mine system: a high-throughput microfluidics instrument developed to address unmet needs in the monoclonality and productivity screening stages of cell-line development processes. The instrument takes a mixed population of cells loaded by a user and encapsulates individual cells into picodroplets (4). The machine then analyzes each individual droplet for productivity using a fluorescence resonance energy transfer (FRET)–based screen, then images and dispenses the highest-productivity droplets into individual microplate wells (5). The entire process occurs inside a single-use cartridge with media and reagents that are completely free of animal-sourced components.
We have tested the instrument and its associated screening method with MAb and non-MAb projects and found that they can generate cell lines with high productivity, good viability, and a strong assurance of monoclonality after a single round of screening. Thus we have determined that incorporating a Cyto-Mine system into our process can significantly shorten the overall cell-line development timeline while reducing both screening and resource requirements without compromising productivity or product quality in our production cell lines.
Droplet Generation
The compact Cyto-Mine system from Sphere Fluidics is one of the first integrated devices capable of automatically performing single-cell analysis, sorting, imaging, and dispensing into individual microplate wells. This high-throughput instrument uses picodroplet technology and single-use microfluidic cartridges to analyze and sort MAb-expressing cells. Figure 1 shows an example cartridge and a microscopic view of such a cartridge in use.
The Method: Cells from a transfection pool are centrifuged and then resuspended in fresh culture medium containing FRET reagents, then manually pipetted into a single-use cartridge that will be mounted into the instrument. These cells in aqueous medium are pumped across the chamber from left to right, where they meet surfactant being pumped into the cartridge from the top and bottom. That encapsulates cells and medium to form picodroplets that act as tiny bioreactors to compartmentalize individual cells and let them grow. Then encapsulated cells are pumped into an incubation chamber for analysis.
FRET-Based Screening of Transfectants
Our preferred method for screening cells is to identify high expressers through FRET-based screening of secreted MAbs after incubating them at 37 °C. Before encapsulation, cells are washed and resuspended in fresh medium to remove any MAbs that may be present. We add a pair of FRET reagents that will enable identification of high-expressing, low-expressing, and nonexpressing transfectants during the picodroplet formation step.
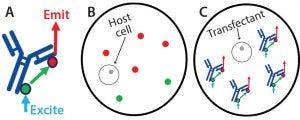
Figure 2: Screening on the Cyto-Mine system based on fluorescence resonance energy transfer (FRET); reagents used to screen the transfectants for monoclonal antibody (MAb) expression were added before droplet formation. Protein G labeled with Alexa Fluor 488 dye was added as the FRET donor, and protein L labeled with Alexa Fluor 594 dye was added as the FRET acceptor. (A) The proteins will bind to MAb molecules secreted by a cell within a picodroplet. Upon excitation in the Cyto-Mine unit, they will serve as FRET donors (protein G) and acceptors (protein L) to generate a red signal that correlates with each cell’s expression level. (B) A nonexpressing cell will generate a low or no red emission signal; (C) a high-expressing cell will generate a high red emission signal
For this work, we used protein G (ProG) labeled with Alexa Fluor 488 green dye and protein L (ProL) labeled with Alexa Fluor 594 red dye — both from Thermo Fisher Scientific — but we have had success with other combinations of affinity reagents for screening a more diverse set of molecules. Inside its picodroplet, a cell secretes MAb during a short incubation, allowing the FRET pair to bind (Figure 2). After incubation, the picodroplets are screened through blue-laser excitation, which causes Alexa Fluor 488 to emit a signal that will then excite any Alexa Fluor 594 that is nearby.
Note that this FRET-based screening produces signal only when the ProG– AlexaFluor488 and ProL–AlexaFlour594 are in close proximity to one another while bound to an individual MAb molecule. Therefore, droplets exhibiting higher red-emission FRET signals are those with higher MAb expression.
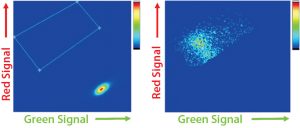
Figure 3: Cyto-Mine FRET-based analysis of picodroplets; (A) dot plot of non- and low-expressing droplets with high green and low red signals; (B) dot plot of high-expressing droplets showing the characteristic FRET signature of low green and high red signal. Note that the latter data also exists in the former dot plot but is rescaled because high expressers represent the minority of droplets.
Sorting and Droplet Dispensing
After a short incubation to generate sufficient FRET signals, cells undergo an analysis and sorting procedure. The graphing and gating process is similar to that in typical flow cytometry: A dot-plot is generated with green signals shown on its x-axis and red signals shown on its y-axis. Picodroplets with no cells — or with low- or nonexpressing cells — show a green signal from excitation of the ProG–AlexaFlour488 (FRET donor) but very little to no red signal because the ProL–AlexaFlour594 (FRET acceptor) is not in close enough proximity for excitation. Higher expressing cells exhibit the characteristic FRET signal of a shift downward in green signal, and a shift upward in red signal as ProL–AlexaFlour594 is excited. Figure 3 shows examples of both scenarios.
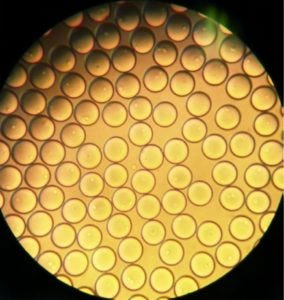
Figure 4: Bulk dispensed picodroplets viewed under a standard benchtop white-light microscope at 10,000×.
A user then can gate the desired picodroplets, causing them to be channeled into a separate compartment on the microfluidic cartridge. Once a sufficient number of gated events have been reached, the user can initiate droplet dispensing. The instrument dispenses individual droplets directly into single microplate wells. Figure 4 shows sorted picodroplets dispensed as a single pool. When they are dispensed into individual wells of a 96-well plate, they burst upon contact with the growth medium.
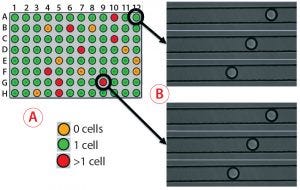
Figure 5A and 5B
Monoclonality Assurance
When monoclonality assurance is the goal, you want the clear majority of droplets either to be empty or to have a single cell present. The number of cells encapsulated per droplet in a Cyto-Mine instrument is dictated by Poisson statistics, and users can control that distribution based on the number of cells loaded into a cartridge. Nevertheless, some occurrences can suggest that sorted and dispensed droplets are not truly monoclonal: e.g., “doublets” (droplets that contain two cells), cell clumps in starting samples that are difficult to separate, and a smaller percentage of droplets containing more than one cell per well than would be expected based on the Poisson distribution. To account for those possibilities, the instrument performs imaging of individual picodroplets at the dispensing stage.
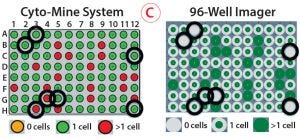
Figure 5: Monoclonality assurance; (A) images are taken of sorted picodroplets as they pass through the Cyto-Mine cartridge during dispensing, and they are automatically screened to determine whether they contain 0, 1, or >1 cells. (B) Of three images each for two example droplets, the top images show droplets containing one cell, and the bottom images show droplets containing two cells. (C) Comparing Cyto-Mine detection software during dispensing and 96-well imager detection after dispensing, wells scored differently are circled in black. The 96-well plate imager and Cyto-Mine detection matched well, and we determined that the Cyto-Mine system was conservative and tended to overestimate counting.
As Figure 5 shows, multiple images are taken of each picodroplet as it passes through dispensing into a 96-well microplate. Cyto-Mine software automatically scans each image to determine whether no cells, one cell, or more cells are included in each dispensed droplet (Figure 5A) — and this can be verified by eye (Figure 5B). We centrifuged microplates of dispensed cells and imaged them on a 96-well plate imager, then compared the results with those generated automatically. The Cyto-Mine and plate-imager results were in alignment for most wells (Figure 5C). For each misalignment, the software had assumed there were more cells than the plate imager showed, resulting in a conservative overestimation of cells present and better assurance of monoclonality.
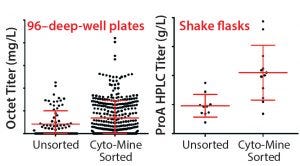
Figure 6: MAb expression titers from unsorted and CytoMine–sorted clones in cell-line development; Chinese hamster ovary (CHO) cells were transfected with DNA encoding MAb A and taken through either a limiting-dilution process (no sorting) or Cyto-Mine–based FRET sorting.
Case Studies
We have performed a number of evaluations incorporating the Cyto-Mine instrument into our cell-line development process. To demonstrate the utility of FRET-based screening for identifying rare, high-expressing transfectants, we first compared unsorted clones with Cyto-Mine sorted clones. Figure 6 shows the improvement with both 96–deep-well (96DW) protein A biosensor Octet-measured expression titers — from a Pall ForteBio instrument — and fed-batch shake-flask protein A high-performance liquid chromatography (HPLC) titers after sorting for Chinese hamster ovary (CHO cells) expressing MAb A.
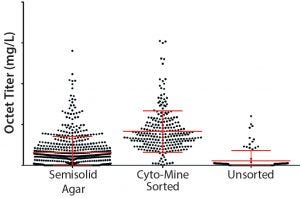
Figure 7: MAb expression titers in 96–deep-well plates from semisolid agar colony screening, Cyto-Mine sorting, and unsorted clones in cell-line development; CHO cells were transfected with DNA encoding MAb B and either taken through semisolid agar colony screening, Cyto-Mine–based FRET sorting, or a limiting-dilution process (no sorting).
Next, we compared our platform semisolid-agar colony-screening method with the Cyto-Mine sorting method described here (6). Figure 7 shows 96DW protein A biosensor Octet-measured expression titers for CHO cells expressing MAb B. Titers are comparable between our semisolid agar colony-screening technique and the Cyto-Mine methods — and represent an improvement over results achieved without enrichment.
Figure 8 shows 96DW protein A biosensor Octet-measured expression titers and fed-batch shake-flask protein A HPLC titers for CHO cells expressing MAb C. Again, the Cyto-Mine process yielded clones that were as good as or better than our platform semisolid-agar colony-screening process. Product quality analysis and a
30-day expression stability study also were comparable (data not shown).
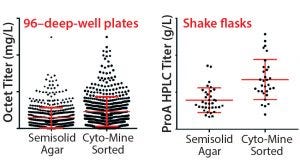
Figure 8: MAb expression titers from both semisolid agar colony screening and Cyto-Mine sorted clones in cell-line development; CHO cells were transfected with DNA encoding MAb C and taken through either a semisolid agar colony screening or Cyto-Mine based FRET sorting.
Better and Faster
The high-throughput Cyto-Mine microfluidic instrument was developed by Sphere Fluidics for identifying and isolating high expressing clones during cell-line development. Users load a mixed population of cells into a disposable cartridge on the instrument, which then encapsulates individual cells in picodroplets of media. The machine analyzes each individual droplet for productivity using a FRET-based screen, then images and dispenses the droplets that contain high-productivity cells into individual microplate wells.
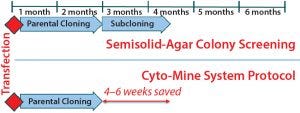
Figure 9: Summary timelines compare semisolid agar colony screening with the Cyto-Mine process. Incorporating the Cyto-Mine system into cell-line development has shortened the overall timeline by four to six weeks and reduced screening and resource requirements without compromising productivity or product quality.
We have tested this instrument and its associated screening method with both MAb and non-MAb proteins. From the three case studies reported herein, we determined that the method can generate cell lines with high productivity and a strong assurance of monoclonality after a single round of screening without compromising product quality. All that was achieved four to six weeks faster than using our platform semisolid-agar colony-screening cell-line development process would take (Figure 9).
Acknowledgments
Sphere Fluidics (Cambridge, UK) provided technical support and advice throughout the work described herein. This study was supported by Janssen R&D’s pharmaceutical development and manufacturing sciences (PDMS), cell and developability sciences, cell-line development, and analytical teams. Partial funding was provided by a Janssen R&D integrated technology strategy (ITS) grant.
References
1 Ecker DM, Jones SD, Levine HL. The Therapeutic Monoclonal Antibody Market. mAbs 7(1) 2015: 9–14.
2 Zingaro K, et al. Implementation of Plate Imaging for Demonstration of Monoclonality in Biologics Manufacturing Development. PDA J. Pharm. Sci. Technol. 18 April 2018.
3 Evans K, et al. Assurance of Monoclonality in One Round of Cloning Through Cell Sorting for Single Cell Deposition Coupled with High Resolution Cell Imaging. Biotechnol. Prog. 31(5) 2015: 1172–1178.
4 Crawford DF, Smith CA, Whyte G. Image-Based Closed-Loop Feedback for Highly Mono-Dispersed Microdroplet Production. Sci. Rep. 7(1) 2017: 10545.
5 Idusogie EE, et al. Development of an Antibody Screening Assay for Selection of Production Cell Lines. BioProcess Int. 6(4) 2008: 20–32.
6 Lee C, et al. High-Throughput Screening of Cell Lines Expressing Monoclonal Antibodies. BioProcess Int. 4(1) 2006: 32–35.
Corresponding author Thomas Kelly is a scientist, Angela M. Tuckowski is an associate scientist, and Kevin D. Smith is associate director and head of cell line development and genetic characterization at Janssen R&D in Spring House, PA; [email protected]. This article is based on a presentation Kelly gave at KNect365’s Cell Line Development and Engineering Europe meeting in Amsterdam, The Netherlands (23–25 April 2018).
You May Also Like

