Buffer and Solution Mixing-Time Validation: A Risk-Assessment Framework for Analysts Using Matrix and Bracketing ApproachesBuffer and Solution Mixing-Time Validation: A Risk-Assessment Framework for Analysts Using Matrix and Bracketing Approaches
In biopharmaceutical manufacturing, validation of solution-mixing processes plays a vital role in ensuring drug-product quality and regulatory compliance. Because biologics are complex, multicomponent solutions, their successful production hinges on consistently homogeneous mixing. Variations in that process can diminish product efficacy, stability, and safety. Given regulatory agencies’ increasing focus on process consistency, mixing times must be validated comprehensively yet efficiently.
The frequently applied matrix and bracketing methods enable optimization of mixing validation across different solution formulations. Both approaches aim to identify and validate worst-case scenarios, streamlining the validation process while meeting regulatory requirements. However, such studies must be supported by a robust, quantitative risk-assessment framework that includes key factors influencing mixing effectiveness.
We introduce such a framework, evaluating mixing performance as a function of hydrodynamic conditions, solubility limits, particle-size distribution, and chemical complexity and ionic strength (Figure 1). By proposing a structured risk-assessment strategy, we seek to guide biomanufacturers in establishing validated mixing processes that align with regulatory standards, enhancing consistency in product quality and operational efficiency.
Setting Acceptance Criteria for Mixing-Time Studies
During process validation, biologics manufacturers conduct mixing-time studies to ensure consistent product formulation. Such studies determine the time needed to achieve a homogeneous solution, which is crucial for maintaining uniform product quality and efficacy. By proactively identifying potential issues related to inadequate mixing, such as localized variations in solution concentration or pH, manufacturers can mitigate risks and maintain consistency in product quality. Thus, accurate mixing validation helps in establishing robust operational controls by ensuring even distribution of ingredients, consistent achievement of critical quality attributes (CQAs), and ultimately, regulatory compliance (1, 2).
Acceptable Sample Size for Establishing Homogeneity Criteria: Homogeneity is demonstrated when at least three consecutive samples show consistent agreement within acceptable variability in the measured parameter. For normally distributed parameters, the required sample size at a given confidence, power, and detectability is calculated using Equation 1. Therein, ns is the sample size, while Z1−α and Z1−β are the inverse cumulative Z values corresponding to type I (α) and type II errors (β) (3). A typical α value is set at 0.05, indicating a 5% risk of falsely rejecting a true null hypothesis, leading to a confidence level of 95% (4). For β, a common value is 0.20, implying 80% reliability or a 20% chance of failure to reject a false null hypothesis (5). The detectability term (Δ/σ) represents the acceptable level of deviation from the mean, expressed in number of standard deviations. According to US Food and Drug Administration (FDA) guidance, a Δ/σ value of 1.0 at 90% confidence and 80% reliability suffices to conclude that a sample represents the population (6). Under the above conditions, the calculated sample size for establishing process consistency is three.

Equation 1: Calculating an acceptable sample size for establishing homogeneity criteria.
Setting Homogeneity Acceptance Criteria: To establish solution homogeneity, either individual study results must maintain a relative standard deviation (RSD) within ≤5.0%, or all individual values must remain within ±10.0% of the average (7). When measurements are reported near the lower end of the measurement range, absolute values are applied to validate the required precision for achieving homogeneity. Methods frequently reported in validations of mixing-time studies are detailed below, along with corresponding absolute values.
Acceptable variability limits are used to confirm homogeneity. Monitoring at least one critical parameter related to mixing (such as turbidity, conductivity, pH, or osmolarity) is recommended to ensure that a process remains within acceptable limits. Not all parameters need to be assessed in every case, but it is essential to establish and then rigorously monitor acceptance criteria for mixing time to verify homogeneity.
Visual confirmation, as defined by United States Pharmacopeia (USP) General Chapter <790>, ensures that solutions are free from visible particles. The method also can serve to assess mixing efficiency when detailed measurements are infeasible (8, 9).
Turbidity is controlled below 5 NTU to maintain solution clarity, and that method can be used to verify the absence of particulate matter, indicating complete solubility (10, 11).
Conductivity can be monitored closely to indicate a solution’s ionic content, with deviation levels of ±2 to ±3 µS/cm to ensure uniform ionic distribution and process consistency (12). For noncritical processes, limits of up to ±5 µS/cm or ±5% may be used, offering flexibility while maintaining control (13, 14).
Solution pH typically is set within ±0.03 to ±0.05 units to maintain a consistent chemical environment, thereby ensuring homogeneous conditions throughout a solution (15, 16). In weak acid solutions, such as CO2-bicarbonate–mediated buffers as well as cell-culture growth media and feeds, mixing time can influence solution pH significantly. In such cases, achieving consistent pH values across three consecutive samples to confirm solution homogeneity is often impractical. Consequently, using pH assessment within a narrow range across three samples is not recommended as a criterion for evaluating homogeneity.
Osmolarity is set within ±5 mOsmo/kg to ensure homogeneity (17, 18).
Matrix and Bracketing Approaches for Validation
Aimed at optimizing efforts while ensuring process consistency, matrix and bracketing approaches are essential strategies in validating many kinds of biopharmaceutical processes, including mixing-time studies. The matrix approach involves testing a representative subset of variable combinations, such as batch sizes, agitator speeds, and tank geometries, to understand their impact on mixing efficiency. For example, in a bioreactor, a matrix study might assess different combinations of 100-L, 500-L, and 1000-L batches with agitator speeds of 100 rpm and 200 rpm in tanks of different geometries, assuming that untested conditions will behave similarly.
In contrast, the bracketing approach focuses on testing extremes of key variables, such as the smallest and largest batch sizes and the lowest and highest agitator speeds, under the assumption that intermediate conditions will perform consistently. A bracketing approach is particularly useful when a process behaves predictably between extreme conditions.
Both methods offer distinct advantages, enabling manufacturers to streamline validation efforts while ensuring effective mixing and maintaining process control.
Limitations of Matrix and Bracketing Approaches: During mixing-time validation, all tanks used in a manufacturing process should be tested under at least one condition to assess potential risks. That approach is consistent with regulatory guidelines from the FDA and European Medicines Agency (EMA) (19, 20). In practice, not all preparation tanks are geometrically similar, differing in factors such as aspect ratio, impeller location, number of impellers, and ratio of impeller diameter to tank diameter (DI/DT). Such differences complicate demonstration of consistent mixing across scales under a bracketing approach, which would validate only extreme conditions. To address that concern and ensure validation robustness, it is recommended that every tank used in a manufacturing process be tested in mixing studies.
To identify the worst-case condition from grouped conditions in a matrix approach, validation scientists should focus on assessing mixing hydrodynamics within a given tank, maximum solubility of multicomponent solution, particle size of powders used, and immiscibility based on chemical complexity and ionic strength (Figure 1) (1). Therefore, a comprehensive and quantifiable risk-based approach should be devised to evaluate those factors thoroughly, ensuring effective grouping of conditions and identification of the worst-case scenario. Such an approach involves the following four steps.
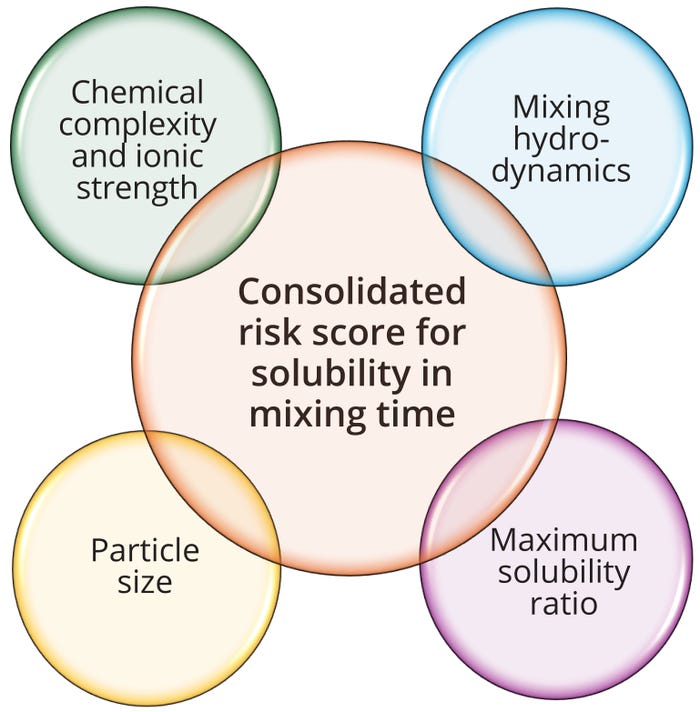
Figure 1: Comprehensive riskassessment framework for buffer and solution mixing-time studies, using a matrix approach.
Identify All Tanks: List all tanks used throughout a biomanufacturing process.
Group Solutions by Tank: Organize the solutions prepared in each tank, as identified in the previous step. Each preparation within those tanks is treated as a condition within the group.
Conduct a Comprehensive Risk Assessment: Perform a detailed risk evaluation for each condition within a group to define the worst-case scenario. Assessment occurs in three stages:
• Evaluate mixing hydrodynamics — analyze the mixing dynamics for the grouped conditions, and assign a risk score in relation to solution solubility
• Assess solution properties — evaluate the intrinsic properties of each solution and assign a risk score based on the maximum solubility of a multicomponent solution, powder-particle size, and ingredient immiscibility
• Calculate overall risk — derive an overall score by combining the risk factors: (mixing hydrodynamics) × (solution maximum solubility) × (particle size) × (chemical complexity and ionic strength).
Test Critical Conditions: Validate the most critical conditions to ensure that mixing performance is controlled effectively across all tank sizes and configurations.
This four-step method ensures a structured and thorough evaluation, enabling definition of worst-case conditions and maintaining control over mixing efficiency.
Mixing Hydrodynamics
When using a matrix approach for mixing validation, analysts should assess variability in mixing hydrodynamics that arise from differences in mixing conditions within a group — e.g., variations in preparation volume, mixing speed, solution viscosity, solution density, and tank aspect ratio, which in turn influence critical factors such as average shear, vortex formation, and overall blending time in a mixing tank. A comprehensive, risk-based, and quantifiable approach should be applied to evaluate those factors thoroughly:
• Identify normalized engineering parameters to assess mixing dynamics across operating conditions and scales
• Assign weight to each normalized engineering parameter according to its influence on mixing
• Consolidate risk scores and weights for each parameter and condition assessed to compare risks for each condition.
Identifying Normalized Engineering Parameters To Assess Mixing Dynamics: Key parameters used to assess mixing performance and mass-transfer efficiency in stirred-tank bioreactors. For instance, power per unit volume (P/V), Froude’s number (Fr), and blend time (tblend) all play critical roles in ensuring optimal mixing dynamics and discouraging microbial growth.
Average Shear Assessment: The P/V ratio is a crucial metric for assessing average shear across the entire preparation volume. It normalizes the effects of different impeller types, numbers, and configurations, facilitating consistent comparisons across tanks. Equation 2 shows how to calculate P/V values (21, 22).

Equations 2–5: Risk calculations — mixing hydrodynamics.
Vortex-Formation Assessment Using Froude’s Number: The Fr value evaluates vortex formation within a stirred tank by comparing inertial and gravitational forces (21, 22). Equation 3 shows how to calculate Fr values. Therein, N denotes the impeller rotational speed, DI is the impeller diameter, and g is acceleration due to gravity (9.81 m/s²).
Blend Time in Impeller-Agitated Systems: Differences in impeller design, scale, liquid height:tank diameter ratio (H/DT), and impeller speed significantly impact discharge rate per unit volume and overall mixing efficiency. Such variations can be normalized across scales using a tblend value, which represents the time needed to achieve homogeneity in a tank. That value enables consistent comparison of impeller performance during scale-up or scale-down (21). An impeller discharge rate (Qimp) is calculated using the impeller flow number (NF), agitation rate (N), and impeller diameter (D). The circulation time (tcir) is the ratio of tank volume to discharge rate. Mixing time, the time to reach 95% homogeneity, is about four times the circulation time (21). Values for NF equal 0.7 to 0.9 for radial impellers and 0.3 to 0.5 for pitched-blade impellers (22). Mixing-tank tblend values can be calculated using Equation 4.
Assigning Weight to Normalized Engineering Parameters According to Their Influence on Mixing: Table 1 outlines key parameters used in assessing mixing dynamics, along with their assigned weights and associated rationales. We considered each parameter’s influence on factors such as turbulence and shear forces to determine its importance to overall mixing performance, especially in large-scale operations. The weights listed in Table 1 reflect the relative significance of each parameter in ensuring efficient and uniform mixing, with our rationale for each assignment.

Table 1: Weighting for each normalized engineering parameter, according to its influence on solution mixing.
Final Risk-Score Calculation for Mixing Hydrodynamics: The final score will be a weighted average of the individual risk scores for each parameter (Equation 5). This strategy normalizes parameters to assign relative risk scores based on the total value within the grouped conditions.
For parameters such as P/V and Fr, calculate the risk score by dividing the total value of the group by each individual parameter value. For example, if three conditions in a vessel have P/V values of 10, 20, and 50 W/m³, then the total value of the group is 10 + 20 + 50 = 80 W/m³. The risk scores are as follows:
• For P/V = 10 W/m³, the risk score is 80 ÷ 10 = 8
• For P/V = 20 W/m³, the risk score is 80 ÷ 20 = 4
• For P/V = 50 W/m³, the risk score is 80 ÷ 50 = 1.6.
For parameters such as tblend, reverse the calculation by dividing each individual value by the total group value. For instance, if the blend times for three grouped conditions are 10, 20, and 30 seconds, then the total blend time is 10 + 20 + 30 = 60 seconds. The risk scores are as follows:
• For tblend = 10 seconds, the risk score is 10 ÷ 60 = 0.16
• For tblend = 20 seconds, the risk score is 20 ÷ 60 = 0.33
• For tblend = 30 seconds, the risk score is 30 ÷ 60 = 0.5.
This approach provides a consistent and logical way to compare relative risks across different parameters by normalizing them against the total values of the group.
Maximum Solubility Ratio
In multicomponent solutions, the maximum solubility of a component depends on the presence of other components due to changes in the solution’s overall properties (23, 24). One such property is osmolarity, the measure of solute concentration per liter of solution, expressed in osmoles per liter (Osm/L). It accounts for all solute particles in a solution, including ions, molecules, and complexes (25). Maximum solubility refers to the highest concentration of a solute that can dissolve in a solvent at a given temperature and pressure before reaching saturation. Beyond that point, additional solute will not dissolve and may precipitate instead (26). An osmolarity level corresponding to a maximum solubility level is called the maximum solubility osmolarity (MSO).
Example Calculation: Consider a solution containing sodium chloride (NaCl) and glucose. To obtain the solution’s total MSO, first calculate an MSO value for the NaCl component. The molecular weight (MW) of NaCl equals 58.44 g/mol, and its maximum solubility (saturation concentration, Csat) is 357 g/L. Because NaCl dissociates into two ions (Na+ and Cl–) in water, the number of particles produced (nNaCl) is two. Knowing those values, you can calculate the MSO of an NaCl solution as shown in Equation 6.
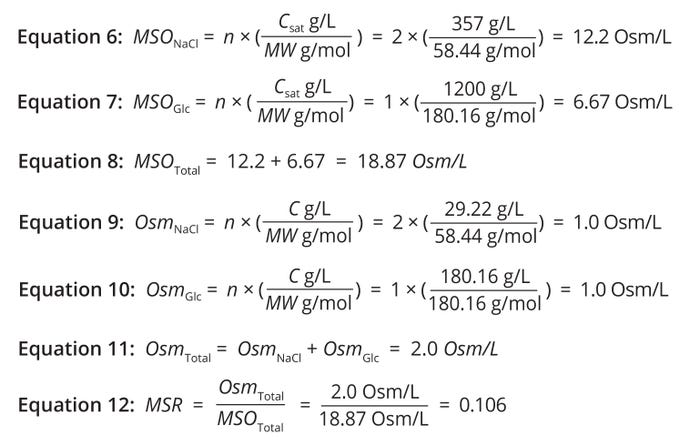
Equations 2–5: Risk calculations — mixing hydrodynamics.
Next, calculate an MSO for glucose, which has an MW of 180.16 g/mol and a Csat value of 1200 g/L. Glucose does not dissociate in water, so the number of particles produced therein (nGlc) is one. The MSO for glucose can be calculated using Equation 7.
The total osmolarity of the solution is the sum of each solute’s osmolarity contributions (Equation 8).
Maximum Solubility Ratio: In multicomponent solutions, osmolarity can provide insights into the components’ solubility behavior. When solution osmolarity approaches a level corresponding to the maximum solubility of one or more solutes, then the solution is nearing saturation. Therefore, the ratio of osmolarity to MSO — the maximum solubility ratio (MSR) — can serve as a useful surrogate measure of maximum solubility (27, 28). Equations 9–12 demonstrate how to calculate the MSR for a solution containing 58.44 g/L of NaCl and 180.16 g/L of glucose.
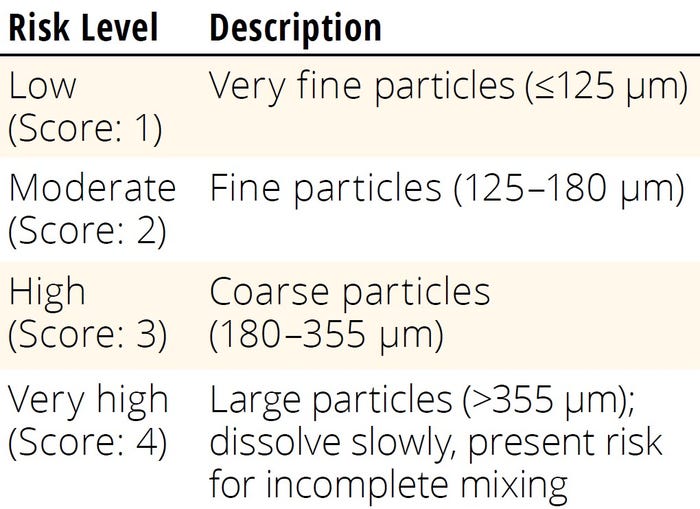
Table 2: Risk-assessment scoring for particle size.
Particle Size
Buffer salts and powders typically are categorized by their particle-size distributions, which substantially affect their dissolution rates and handling characteristics. Biopharmaceutical industry vendors offer such materials with specific particle-size classifications to meet different applications and requirements, ranging from coarse to fine powders. Users often can find detailed information about particle-size distribution in vendor-provided technical documentation (e.g., specification sheets, product catalogs, and technical-data sheets). For risk-assessment purposes, particles can be classified based on USP <8111> guidelines for powder fineness, as shown in Table 2 (29). When more than one powder component is added into a single solution, the consolidated particle risk score (CPRS) for a single solution is calculated as shown in Equation 13. Therein, ni is the number of powder components compounded in a solution, and PRSi represents the risk score of each component in the solution.
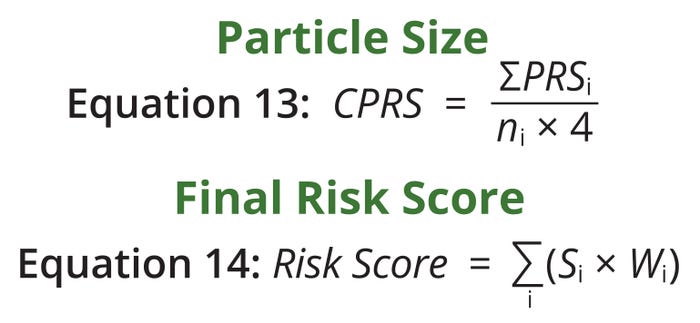
Equations 13–14: Risk calculations.
Chemical Complexity and Ionic Strength
Table 3 categorizes risks for solutions used in biomanufacturing based on their chemical complexity and ionic strength on dissolution, with scores ranging from 1 to 4. Low-risk solutions such as simple salts and buffers dissolve easily, whereas moderate-risk solutions such as amino acids and polysaccharides may necessitate pH adjustments or especially careful mixing. High-risk groups include proteins and viscous solutions that can raise issues for aggregation or high viscosity. Extremely high-risk solutions, such as complex compounds and suspensions, require specialized mixing techniques because of their poor solubility and phase-separation tendencies.
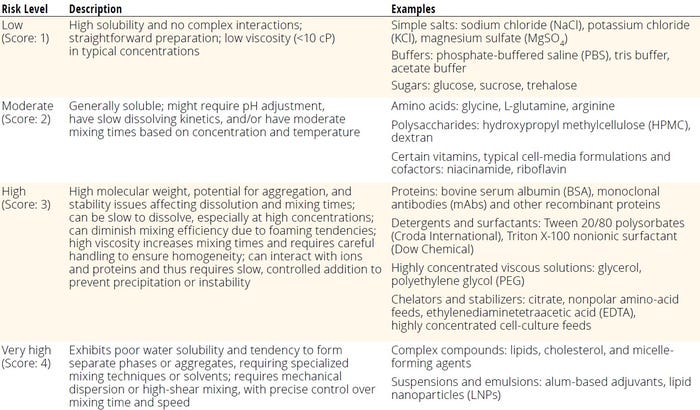
Table 3: Risk-assessment scoring for chemical complexity and ionic strength.
Combined Risk Scores for Mixing-Time Validation
To consolidate the discussed risk factors into a single, comprehensive score, we developed a weighted-sum formula. Each parameter — solution complexity, solution viscosity, particle-size distribution, and mixing hydrodynamics — is weighted based on its relative significance in determining solution stability and solubility. The comprehensive score can be calculated using Equation 14. Therein, Si represents the individual score, and Wi denotes the corresponding weighting factor for each parameter. A weighted approach provides for a quantifiable assessment of cumulative risk, with higher scores indicating increased risk to solubility in the system.
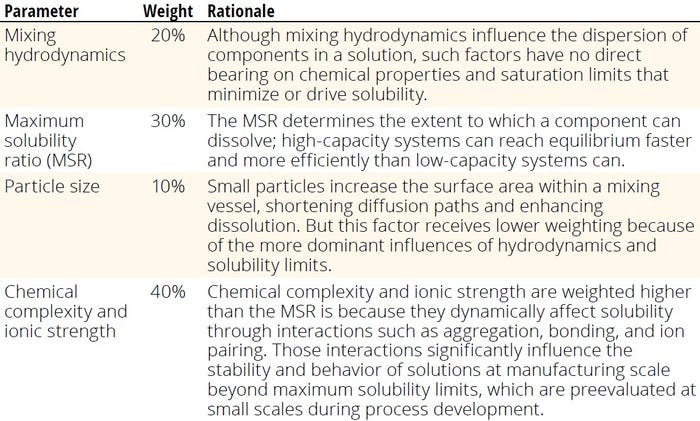
Table 4: Weight of different factors influencing solubility of components in solution.
A Framework for Understanding
Validation of mixing times in biomanufacturing is critical for ensuring drug-product consistency, quality, and safety. We have highlighted the importance of implementing a comprehensive approach that leverages matrix and bracketing strategies to address regulatory requirements efficiently. By focusing on key variables such as mixing hydrodynamics, maximum solubility, particle-size distribution, and chemical complexity, manufacturers can evaluate and optimize their mixing processes systematically. Developing a quantifiable risk-assessment framework provides a deep understanding of factors that influence mixing outcomes, improving decision-making and facilitating process control. A structured methodology not only helps in achieving regulatory compliance, but also enhances product uniformity and operational efficiency.
By adopting a holistic strategy, biomanufacturers can mitigate risks associated with mixing, ensure alignment with regulatory standards, and maintain high-quality bioproduction standards. Our article serves as a guide to implementing a scientific and risk-based approach to mixing validation, supporting continuous improvement of biomanufacturing processes.
References
1 Fulton B, Gorsky I. Risk- and Science-Based Media and Buffer Mixing Validations. Pharm. Eng. March/April 2024; https://ispe.org/pharmaceutical-engineering/march-april-2024/risk-and-science-based-media-and-buffer-mixing.
2 Validation of Mixing Uniformity Also Required for Active Ingredients. ECA Academy: Mannheim, Germany, 8 June 2022; https://www.gmp-compliance.org/gmp-news/validation-of-mixing-uniformity-also-required-for-active-ingredients.
3 NIST/SEMATECH. Engineering Statsitics Handbook. US National Institute of Technology and Standards: Gaithersburg, MD, 2012; https://doi.org/10.18434/M32189.
4 Lakens D. Calculating and Reporting Effect Sizes To Facilitate Cumulative Science: A Practical Primer for t-Tests and ANOVAs. Front. Psychol. 4, 2013: 863; https://doi.org/10.3389/fpsyg.2013.00863.
5 Durivage M. How To Establish Sample Sizes for Process Validation Using Statistical Tolerance Intervals. Bioprocess Online, 27 October 2016; https://www.bioprocessonline.com/doc/how-to-establish-sample-sizes-for-process-validation-using-statistical-tolerance-intervals-0001.
6 Weng Y-H. Statistical Review and Evaluation. US Food and Drug Administration: Silver Spring, MD, 12 December 2016; https://www.fda.gov/media/105013/download.
7 Guidance for Industry (Draft): Powder Blends and Finished Dosage Units — Stratified In-Process Dosage Unit Sampling and Assessment. US Food and Drug Administration: Rockville, MD, 2003; https://www.gmp-compliance.org/files/guidemgr/5831dft.pdf.
8 Shabushnig JG, Katayama H. Japanese Pharmacopeia (JP) and United States Pharmacopeia (USP) Developments in Visual Inspection for Foreign Particulate Matter. PDA J. GMP Valid. Jap. 17(1) 2015: 94–103; https://www.jstage.jst.go.jp/article/pda/17/1/17_94/_pdf/-char/ja.
9 USP <790>. Visible Particulates in Injections. United States Pharmacopeial Convention: North Bethesda, MD, 2024; https://doi.org/10.31003/USPNF_M7197_01_01.
10 Savjani KT, Gajjar AK, Savjani K. Drug Solubility: Importance and Enhancement Techniques. Int. Scholar. Res. Not. 2012, 2012: 195727; https://doi.org/10.5402/2012/195727.
11 Lucero-Borja D, et al. Potentiometric CheqSol and Standardized Shake-Flask Solubility Methods Are Complimentary Tools in Physicochemical Profiling. Eur. J. Pharm. Sci. 148, 2020: 105305; https://doi.org/10.1016/j.ejps.2020.105305.
12 Patil SP, et al. Mixing Models for Slag Covered, Argon Stirred Ladles. ISIJ Int. 50(8) 2010: 1117–1124; https://doi.org/10.2355/isijinternational.50.1117.
13 Alam MM, et al. Water Quality Assessment of Shitalakhya River. Asian J. Fish. Aquat. Res. 6(1) 2020: 9–20; https://doi.org/10.9734/ajfar/2020/v6i130086.
14 Pauline T, Bouchoud L, Bonnabry P. Validation of a Procedure To Mix Homogenous Solutions in Bags and Syringes. Eur. J. Hosp. Pharm. 25(e2) 2018: e126–e129; https://doi.org/10.1136/ejhpharm-2017-001284.
15 Reithmayer K. Accuracy of pH Measurement. Xylem Analytics: Weilheim, Germany, 2 May 2023; https://www.xylemanalytics.com/en/company/blog/blog/2023/05/accuracy-of-ph-measurement.
16 pH Accuracy. Hamilton Company: Reno, NV, 2024; https://hamiltoncompany.com/process-analytics/ph-and-orp-knowledge/ph-calibration/ph-accuracy.
17 Fagehi R, et al. Investigation of the Repeatability of Tear Osmolarity Using an I-PEN Osmolarity Device. Taiwan J. Ophthal. 11(2) 2021: 168–174; https://doi.org/10.4103/tjo.tjo_65_20.
18 Tavakoli A, et al. The Validity of Point of Care Tear Film Osmometers in the Diagnosis of Dry Eye. Ophthal. Physiolog. Optics 42(1) 2022: 140–148; https://doi.org/10.1111/opo.12901.
19 Guidance for Industry: Sterile Drug Products Produced by Aseptic Processing — Current Good Manufacturing Practice. US Food and Drug Administration: Rockville, MD, 2004; https://www.fda.gov/media/71026/download.
20 Guideline on the Sterilisation of the Medicinal Product, Active Substance, Excipient and Primary Container. European Medicines Agency: Amsterdam, the Netherlands, 2019; https://www.ema.europa.eu/en/documents/scientific-guideline/guideline-sterilisation-medicinal-product-active-substance-excipient-primary-container_en.pdf.
21 Doran PM. Bioprocess Engineering Principles (Second Edition). Academic Press: Cambridge, MA, 2013.
22 Benz GT. Agitator Design for Gas–Liquid Fermenters and Bioreactors (First Edition). John Wiley & Sons: Hoboken, NJ, 2021.
23 Kamps ÁP, et al. Influence of Salts on the Solubility of Carbon Dioxide in (Water + Methanol). Part 2: Sodium Sulfate. Industr. Eng. Chem. Res. 45(10) 2006: 3673–3677; https://doi.org/10.1021/ie0513088.
24 Papanyan ZK, et al. The Dissolution of Polyols in Salt Solutions and Ionic Liquids at Molecular Level: Ions, Counter Ions, and Hofmeister Effects. ChemPhysChem 14(16) 2013: 3667–3671; https://doi.org/10.1002/cphc.201300465.
25 Brauer AM, et al. Physiological and Regulatory Convergence Between Osmotic and Nutrient Stress Responses in Microbes. Curr. Opin. Cell Biol. 81, 2023: 102170; https://doi.org/10.1016/j.ceb.2023.102170
26 Lu JX, et al. Biochemistry, Dissolution and Solubility. StatPearls: St. Petersburg, FL, 2022; https://www.ncbi.nlm.nih.gov/books/NBK431100.
27 Li P, et al. Osmolarity Affects Matrix Synthesis in the Nucleus Pulposus Associated with the Involvement of MAPK Pathways: A Study of Ex Vivo Disc Organ Culture System. J. Orthopaed. Res. 34(6) 2015: 1092–1100; https://doi.org/10.1002/jor.23106.
28 Sukhotnik I, et al. Effect of Lactulose on Bacterial Translocation and Intestinal Adaptation in a Rat Model of Short Bowel Syndrome. J. Pediatr. Gastroenterol. Nutrit. 46(5) 2008: 507–513; https://doi.org/10.1097/mpg.0b013e31815faa88.
29 USP <811>. Powder Fineness. United States Pharmacopeial Convention: North Bethesda, MD, 2012; https://www.usp.org/harmonization-standards/pdg/general-chapters/powder-fineness.
Leya S. Rose is senior manager of process validation; Tyler Younger, Grace Chan, Shandilyn Ball, and Emma Bolduc are manufacturing science and technology (MSAT) engineers; Alexander Elkin is a manufacturing associate; Mark Davis is director of MSAT; and corresponding author NaveenGanesh Muralidharan ([email protected]) is senior manager of the MSAT team, all at AGC Biologics, 5550 Airport Boulevard, Boulder, CO 80301; https://www.agcbio.com.
You May Also Like


