Bioreactor Design for Adherent Cell Culture: The Bolt-On Bioreactor Project, Part 4 — Process EconomicsBioreactor Design for Adherent Cell Culture: The Bolt-On Bioreactor Project, Part 4 — Process Economics
September 23, 2015
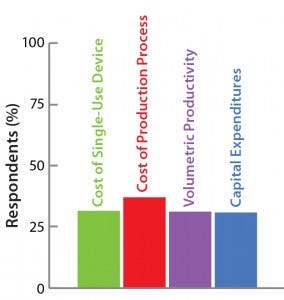
The Open Design Initiative
The BoB team has its own views on
addressing the four challenges that
must be met in designing a future
standard solution for adherent cell
culture. Market opinion is most
important, however. So the team has
conducted a series of surveys to provide
insights on design features that would
best suit market needs. A public survey
conducted in September and October of
2014 asked about the relevance of
various cost parameters to overcome
Challenge #4. Results are shown here.
The Bolt-on Bioreactor (BoB) project is an independent initiative developing and commercializing a bioreactor for efficient, automated culture of adherent cells for biopharmaceutical applications (1). After conducting thorough research on available culture systems for adherent cells, the BoB team believes that a successful alternative to existing devices must solve four major challenges: volumetric productivity (2), process automation (3), containment and sterility (4), and process economics. This month concludes a four-part series addressing each of those challenges while describing design features incorporated into the BoB system to overcome them.
Determining the maximum capacity of a production plant is a crucial decision with extreme impact on capital expenditure and both fixed and variable manufacturing costs. A biopharmaceutical company’s competitive position and market performance can depend on making the right choice early on. It becomes more complex when considering the enormous differences in requirements for space and utilities among production technologies for a given maximum capacity. Depending on design features, different technologies can be accommodated in the same production plant, and obsolete technologies can be replaced with more efficient ones. Otherwise, a new plant must be designed, built, and commissioned before a novel production technology can be implemented.
Replacing an established technology is especially cumbersome for biopharmaceutical production because the process- and product-quality influence of newly introduced technologies are major concerns. That is not only for bioprocessors themselves, but also for regulatory authorities who will want detailed reporting on every minor modification introduced and the effects of such changes on product quality.
Thus, even if a novel production technology is more efficient than an established one, substitution is not an obvious decision. It requires minute analysis from different viewpoints. Process economics are vitally important to these decisions. Such considerations explain the homogeneity of the answers to our survey on the relevance of different cost parameters (see the “Open Design Initiative” box above).
For this analysis, I include in my calculations only costs and expenses that are affected by cell culture technology. I exclude other costs related to production but not so affected. Estimating the full cost of an overall production process or total capital expenditure is beyond the scope of this study. The analyzed process spans the initiation of cell culture to total colonization of all available culture surface with a further 15-day maintenance culture for continued supernatant harvesting.
I’m comparing three existing technologies with the BoB concept: plate stacks, roller bottles, and microcarriers. Cost information comes from different sources. Some numbers are reported in technical literature, others come from my own professional experience, some data come from publicly available sources, and others are estimations or calculations based on my best knowledge. Costs were converted into US dollars at concurrent exchange rates to this report.
For clarity, I have divided manufacturing costs into variable and fixed categories. Major sources for publicly available prices include www.coleparmer.com, www.us.vwr.com/store, www.sigmaaldrich.com, www.amazon.com, www.us.vwr.com, and www.gelifesciences.com (data retrieved in September 2014).
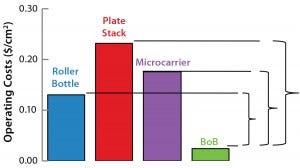
Figure 1: Operating costs and capital expenditure (CapEx) comparison at 1,000-m2 production scale; broken lines indicate the maximum price of a BoB single-use culture chamber in $US/cm2 (above) and maximum investment in control units in US$ (below) that make a BoB system more economically
advantageous to users than indicated technologies at 1,000-m2 production scale. 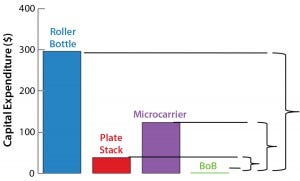
Variable Manufacturing Costs
This category includes all costs that vary proportionally to the number of units produced. Here, the production unit is the square centimeter of cell-adhesion surface. The adequacy of different surfaces for culturing adherent cells is explored in a previous installment of this series (2).
Raw Materials: This subcategory includes single-use materials that are used and consumed during production.
Cell Culture Device: Prices for different devices come from list prices where available and otherwise from those reported by different organizations and available online. To calculate total expenditures, I considered the cost of all culture devices used in a model process. For example, consider that the target production area for a given batch is 1,000 cm2, and it starts with a 100‑cm2 T-flask culture, which is subcultured into three T-175 flasks (525 cm2), with a final passage in six T-175 flasks (1,050 cm2). Prices for each T-100 and T-175 flask are respectively $6.10 and $7.60, so the total cost of cell culture devices used in this process is $74.50: (1 × $6.10) + (3 × $7.60) + (6 × $7.60). During the final 15-day stage, no further consumption of such devices is necessary.
While analyzing the cost of different available culture devices, I found a slight reduction in cost per square centimeter for each vendor and product as device size increases. That correlation disappears when several different vendors and products are included in the analysis. So I calculated average costs for each technology: $0.017/cm2 for roller bottles, $0.061/cm2 for plate stacks, and $0.044/cm2 for microcarriers. Each cell culture device represents an individual purchase unit, with 1 g being the basic unit for microcarriers. I have assumed all cell culture processes to begin with a 150-cm2 culture, with a surface-dilution factor of five for every subpassage.
Special Accessories: Some cell culture devices require special accessories for operation (e.g., plate stacks need special accessories for filling and harvesting). These accessories may include venting filters, caps, and tubing (5). Microcarriers require culture bags for use. And the cost of those bags per liter varies depending on their volume, which in turn varies depending on the number of microcarriers needed to provide a desired culture area. I estimate special accessories to cost $0.00 per roller bottle, $114.80 per plate stack, and $114.80 per BoB unit. In the case of microcarriers, the cost per device varies with the number of devices and is estimated at $228.70x–0.92, where x is the number of devices.
Culture Medium: The volume of culture medium used in a given process is proportional to the volume used per square centimeter of cell-attachment area, total cell-attachment area, process duration, and medium replacement rate (which in turn is proportional to the metabolic activity of the cell population). Here I assume complete medium replacement with every cell doubling (both medium replacement and cell doubling having equal rates). And for convenience, I assume that attachment area doubles at the same rate. With a starting culture area of 150 cm2, attachment area in a given subculture step (for the purpose of estimating culture medium use) is calculated as follows: 150 × 2n = attachment area, where n is the total number of cell doublings that have taken place at the time of the subculture.
For example, with a cell population dividing every 36 hours in a discontinuous process (e.g., in roller bottles), total medium replacement will take place every 36 hours, and the amount of culture medium replaced will be 0.25 mL/cm2 of culture area in use at the moment of medium replacement. For continuous processes (as in a Bolt-on Bioreactor system), however, medium replacement takes place continuously. The overall replacement rate is the same, with an important difference in medium consumption at the last medium replacement step. Discontinuous processes must waste culture medium at that point, whereas continuous processes adjust to the required volume. So for the final 15-day supernatant harvesting stage, I calculated culture media consumption at a rate of 0.25 mL/cm2 every second day.
The numbers used herein are representative of real numbers but may vary considerably for different processes. Although production scale influences the cost of culture media, sourcing policies will truly determine the media cost for a given company. So I have chosen to set a fixed cost per liter that is independent of scale: $8/L (6).

Figure 1: Operating costs and capital expenditure (CapEx) comparison at 1,000-m2 production scale; broken lines indicate the maximum price of a BoB single-use culture chamber in $US/cm2 (left) and maximum investment in control units in US$ (right) that make a BoB system more economically
advantageous to users than indicated technologies at 1,000-m2 production scale.
Process Solutions: Although different culture processes need different compositions for nonmedia process solutions (e.g., washing buffers, equilibration buffers, and cell harvest solutions) or do not need some of them at all, it is safe to assume that process solutions will be used during subculturing. Thus I have considered the volume of such solutions to be proportional to the number of subpassages (every 2.3 cell doublings) and the total attachment area (0.25 mL/cm2) for each subpassage, with no further consumption during the final 15-day supernatant harvesting stage. I estimate the process solution cost at $8/L.
Other Consumables: Some common laboratory materials (e.g., pipette tips, syringes, gloves, tubes, and glassware) are used proportionally to the number of devices used in a bioprocess, no matter their type or volumetric area. I set this cost arbitrarily at $1/device.
Direct Labor: This subcategory includes costs of employees working on production-related activities. To estimate labor cost, I calculated the number of hours necessary to perform necessary production and quality control tasks and multiplied by $30/hour.
Production Labor: Different steps in a production process require different amounts of time from laboratory technicians and other employees. Necessary labor differs according to the number of operations required from employees and the number of devices involved. I calculated these costs for the cell-expansion stage to be $19.50/device for roller bottles, $45.00/device for plate stacks, $127.50/BoB unit, and $60.72x–24 for microcarriers, where x is the number of devices. I calculated the production labor costs for the additional 15-day supernatant harvesting stage to be $68.25/roller bottle and $142.50/plate stack and $30/day for microcarriers and a BoB system, respectively.
Quality Control: In-process analysis is the established method for bioprocess quality control. Associated labor costs are driven mainly by the overall number of culture devices used for discontinuous processes and by a daily control for continuous processes. I calculated these costs in the cell-expansion stage to be $2.4/roller bottle and $7.5/plate stack and $60/day for microcarriers and a BoB system. For the additional 15-day supernatant harvesting stage, I estimated costs at $18.00/roller bottle and $56.25/plate stacks and $30/day for microcarriers and a BoB system.
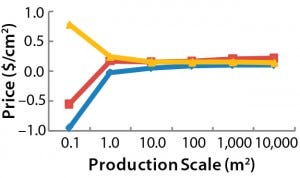
Figure 2: Maximum allowed prices for a BoB system — (above) maximum price of the culture
chamber in $US/cm2 and (below) maximum investment in control units in $US — make the system more economically advantageous to users than other technologies at different (logarithmic)
production scales (Table 1). 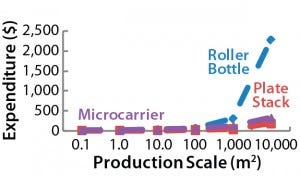
Inventory Shrinkage: In my present analysis, I considered inventory losses to depend exclusively on batch-contamination events. Airborne particles and aerosols generated during culture manipulations represent the greatest source of contamination (7). So for simplicity within the scope of this study, I assume exposure of the interior of open culture vessels to be the contamination source. To estimate the probability of a batch being contaminated and discarded, I take as a starting point the value of mycoplasma-contaminated cultures provided by Uphoff and Drexler (8): 10–30%.
Now I assume an average of 0.2 as the probability of a culture being contaminated in regular research laboratories, then cut that value by half for industrial laboratories for an average of 0.1. I also assume that number to come from an average 15-day culture starting from single-use T flasks, moving through two T flasks on the third day and four T flasks on the fifth day. Opening every T flask twice every second day adds up to 58 open–close cycles. Thus, the probability of a batch contamination after 58 open–close cycles is 0.1, and the probability of no batch contamination is 0.9. Assuming a contamination in any open–close cycle is an independent event, 0.9 = Pnc58, and Pnc = 0.998, where Pnc is the probability of a culture not being contaminated for each individual open– close cycle. And the probability of a batch being contaminated is P = 1 – 0.998cycles, with cycles being the total number of open–close or connect– disconnect cycles (twice the number of devices). To account for the fact that some contamination events occur early in a process and some occur when it is nearly finished, I estimate the cost of a discarded batch to be 25% the cost of a produced batch. With inventory loss calculated as the probability of a batch being contaminated multiplied by the cost of a discarded batch (1 – 0.9982x × C/4, where x is the total number of devices used in the process and C is the cost of the process, excluded inventory shrinkage). Although far from exact, such an approximation helps compare inventory shrinkage costs due to contamination.
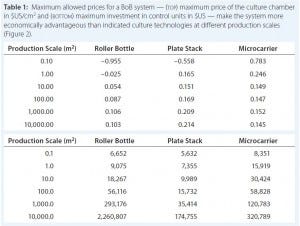
Table 1: Maximum allowed prices for a BoB system — (top) maximum price of the culture chamber
in $US/cm2 and (bottom) maximum investment in control units in $US — make the system more
economically advantageous than indicated culture technologies at different production scales (Figure 2).
Variable Overhead Costs: In this subcategory, I include costs that increase or decrease as production increases or decreases but that cannot be directly assigned to each production unit.
Indirect Labor: This accounts for additional time used by employees in activities such as sourcing, warehouse handling, and waste management. This additional time increases with the number of devices handled. I estimate an additional 5 minutes/device at an estimated cost of $1.67/device for an indirect labor cost of $20/hour.
Indirect Materials: The consumption of some materials such as labels, boxes, bags, and paper increases with the number of devices used. An additional dollar per used device is deemed sufficient to account for this.
Solid-Waste Management: Biological waste must be disposed of by authorized waste management contractors or by authorized processes within a given company. This cost increases with the volume and weight of waste. So variable overhead cost for solid-waste management is directly proportional to the number of devices used and their unitary volume and weight. Bearing in mind a cost for medical waste management of $0.08– 1.36/kg (9), I estimate the cost for solid-waste treatment to be $0.72/kg.
From publicly available data provided by manufacturers, I calculated an average weight of 0.19 g/ cm2 for roller bottles, 0.62 g/cm2 for plate stacks, and 11 g/L of plastic bags used with microcarrier culture (10 g microcarriers account for 3,200 cm2 and require 1-L bag volume). Materials used for rolled-membrane manufacturing are similar to those of roller bottles, so I estimate the weight for rolled-membrane devices (e.g., a BoB system) to be $0.09 g/cm2. Solid-waste cost estimates are $1.37/m2 for roller bottles, $4.46/m2 for plate stacks, $0.02/m2 for microcarriers, and $0.65/m2 for a BoB system.
Liquid-Waste Management: As for solid waste, this cost increases with the volume of liquid waste. Bearing in mind the cost for medical waste management (9), I estimate the cost for liquid-waste treatment at $0.72/L of culture medium and process solutions used.
FixedManufacturing Costs
Here I consider fixed manufacturing overhead costs — those directly related to manufacturing — and assume that maximum capacity is determined by batch size. For example, in analyzing fixed manufacturing costs for production of adherent cells on 100,000 cm2, I do not include marketing or after-sales costs. Production facilities are assumed to be of necessary size for a maximum capacity of 100,000 cm2 with a given cell culture technology. So beyond the minimum area needed for efficient operations, the size of premises will be larger for higher maximum capacities.
To account for the reduction in cell duplication time with continuous processes (as compared with batch processes) as a consequence of the absence of cellular stress and subculture operations (10–12), I’m considering production time for continuous processes to be 30% faster. This is a conservative estimation considering that doubling time increases >50% in stressing environments (13, 14) over discontinuous processes. I estimate cell-doubling time to be 36 hours for discontinuous processes and 25 hours for continuous processes, both starting with the seeding step. With the process duration defined as how long it takes to colonize the batch area starting from 150 cm2 — and with the assigned doubling times — I calculated the fixed costs as follows.
Electrical Power Consumption: A large portion of electricity expense in a bioprocess facility is associated with the heating, ventilation, and air-conditioning (HVAC) system, with consumption proportional to the volume of a production plant. From a starting value of 5,000 kWh/day for a 15,000-ft2 good manufacturing practice (GMP) plant (15) — and assuming an average ceiling height of 3 m — I calculate an average 1.2 kWh power consumption per cubic meter each day. As of June 2014, the average US electrical cost was 7.3 cent/kWh (16).
Indirect Labor: More cleaning, maintenance, and validation employees are needed for larger facilities. The average number of indirect employees in GMP plants Assuming that each employee works 1,700 hours/year at $20/hour in a plant with an average 3-m ceiling height gives in an indirect labor cost of $0.24/day m3.
Depreciation and Amortization of Classified Areas: This cost accounts for depreciation of general manufacturing equipment in classified areas. The basic unit is $/day m3, with capital expenditure calculated from published data (15) for facilities with an average 3-m ceiling height. To calculate the facility volume needed to operate with each adherent-cell technology, I ignored the minimum facility size common to all four technologies and calculated the additional volume necessary in classified areas as twice the volume needed for the maximum number of devices operating simultaneously. Doing so accounts for device handling as well as area taken up by the specialty manufacturing equipment. This cost is calculated at $0.20/day m3.
Depreciation and Amortization of Nonclassified Areas: This is the depreciation cost of nonclassified areas (e.g., warehouses). Unitary cost is estimated as 33% of the respective value for classified areas, and necessary space is calculated as twice the total volume of devices used throughout a process to account for storing and handling space. This calculation gives $0.07/day m3.
Depreciation and Amortization of Specialty Manufacturing Equipment: This cost covers only special equipment associated with cell culture using a given technology. Roller bottles need rollers and CO2 incubators, for example, and microcarriers need bioreactors. The basic unit is $/day m3, with capital expenditure calculated from the cost of equipment necessary to culture cells at each scale. Calculated values for this cost are $2.77v –0.41 + $4.48v–0.78 for roller bottles, $1.661v + $4.48v–0.78 for plate stacks, and $26.63v –0.72 for microcarriers (v is the volume taken up by the respective cell culture apparatus).
Capital Expenditure
Capital expenditure (CapEx) — investments in long-term operating assets — is an important factor to consider when evaluating production technologies. Compare the volume of classified area needed for operating thousands of roller bottles with the size of plant necessary to accommodate a bioreactor. In addition, depreciation and amortization costs analyzed above depend directly on some investments included in CapEx. For this analysis, I considered only items that affect fixed manufacturing costs.
General Production Facilities: This includes premises and utilities necessary for manufacturing but excluding classified areas. (Given the large investment share they represent, they get their own section below.) Expenditure is calculated at $370/m3.
Classified Production Premises: This category includes premises and utilities subject to special environmental control according to GMP guidelines. Expenditure is calculated at $1,110/m3.
Production Equipment: Here I consider only special equipment needed for manufacturing with a given technology. Other manufacturing equipment are included above. I calculate this capital expenditure to be $10,100v –0.41 + $16,357v–0.78 for roller bottles, $3,030 + $16,357v –0.78 for plate stacks, and $97,187v–0.72 for microcarriers (v is the volume in cubic meters taken up by the respective cell culture apparatus).
BoB Pricing Analysis
Typically, adherent cells are cultured either to expand the cells themselves (e.g., cell therapies) or to obtain a biological product produced by them. To take both applications into account, I consider costs of fully colonizing the maximum available culture area at different production scales along with the costs of maintaining the final culture for 15 days afterward.
After computing all calculated data for manufacturing costs and CapEx, I calculated the maximum allowed price for BoB culture chambers and maximum allowed expenditure in BoB control units that render the BoB system economically advantageous for customers. To do so, I compared the cost per square centimeter of the culture process and the CapEx at different scales for different technologies relative to the BoB system when BoB control unit and culture chamber price is $0.00. Figure 1 graphically represents this calculation process. Table 1 lists values obtained for the maximum allowed price of a BoB culture chamber and maximum allowed expenditure in BoB control units for manufacturing costs and CapEx equal to those of the other three technologies at any of six production scales. Figure 2 plots the results.
Those data suggest a maximum price for BoB culture chambers and a maximum investment in BoB control units to make the system more economically advantageous for users than any of the other technologies at different production scales. Any selling price below those shown in Table 1 and higher than the costs of producing and commercializing the BoB concept will render economic benefit to both user and supplier.
By comparing the selling prices of culture devices and production equipment associated with three other technologies, the BoB team concludes that advantageous selling prices for both user and supplier should be feasible for BoB systems at any production scale >1 m2. Production scales between 0.1 m2 and 1 m2 will require a usage-intensity analysis to determine the effect of CapEx on the overall costs of such production processes. The results herein provide a solution to the fourth challenge faced by the BoB team: to develop a system that will be economically feasible to provide economic benefits both to its vendor and customers.
Reference
1 Bolt-on Bioreactor: Automated Adherent Cell Culture, 2014; www.boltonbioreactor.com.
2 Simon M. Bioreactor Design for Adherent Cell Culture: The Bolt-on Bioreactor Project, Part 1: Volumetric Productivity. BioProcess Int. 13(1) 2015: 28–33.
3 Simon M. Bioreactor Design for Adherent Cell Culture: The Bolt-on Bioreactor Project, Part 2: Process Automation. BioProcess Int. 13(4) 2015: 40–48.
4 Simon M. Bioreactor Design for Adherent Cell Culture: The Bolt-on Bioreactor Project, Part 3: Containment, Sterility. BioProcess Int. 13(5) 2015: 34–40.
5 CLS-BP-007 Rev 6. Corning® CellSTACK® Culture Chambers: Instructions for Use. Corning Inc.: Lowell, MA, 2011.
6 Kelley B. Industrialization of MAb Production Technology: The Bioprocessing Industry at a Crossroads. MAbs 1(5) 2009: 443–452.
7 Ryan J. Technical Bulletin CLS-AN 020 Rev 2. Understanding and Managing Cell Culture Contamination. Corning Inc.: Lowell, MA, 2008.
8 Uphoff CC, Drexler HG. Detecting Mycoplasma Contamination in Cell Cultures By Polymerase Chain Reaction. Cancer Cell Cult. Meth. Molec. Med. 88, 2004: 319–326.
9 4032/002 12.2011 3000. Medical Waste Management. International Committee of the Red Cross: Geneva, Switzerland, November 2011.
10 González-Hernández Y, Fischer RW. Serum-Free Culturing of Mammalian Cells: Adaptation to and Cryopreservation in Fully Defined Media. ALTEX 24(2) 2007: 110–116.
11 Pub. No. MAN0000030, Rev.5. User’s Guide: Growth and Maintenance of Insect Cell Lines Catalog Numbers B821-01, B825-01, B855-02. Life Technologies: Carlsbad, CA, 2013.
12 Ludwig A, Tomeczkowski J, Kretzmer G. Influence of the Temperature on the Shear Stress Sensitivity of Adherent BHK 21 Cells. Appl. Microbiol. Biotechnol. 38, 1992: 323–327.
13 Nasser AA. Factors Effects the Growth of Chinese Hamster Ovary (CHO) Cell on Microcarriers Culture. Adv. Biores. 1(1) 2010: 182–188.
14 Jung S, et al. Ex Vivo Expansion of Human Mesenchymal Stem Cells in Defined Serum-Free Media. Stem Cells Int. 2012, 123030: 1–21.
15 Odum J. Focusing on the Future of Biologics Manufacturing. ISPE 2013 Supplier Showcase Presentations, 12 September 2013; www.ispe.org/new-jersey/12-sep-2013-future-biologics-manufacturing.pdf.
16 US Energy Information Administration, 2015; www.eia.gov. •
Marcos Simón, PhD, is founder of the Bolt-on Bioreactor Project, Technology Park, Miramon 182, 20009 San Sebastian, Spain; [email protected]; www.boltonbioreactor.com.
You May Also Like


