Cell Viability in Bioprocesses: Making a Case for ReevaluationCell Viability in Bioprocesses: Making a Case for Reevaluation
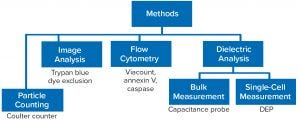
Figure 1: Evaluation of alternative cell counting methods; DEP = dielectrophoresis
Trypan blue dye exclusion first was proposed as a means of measuring mammalian cell damages over a century ago in 1917 (1). Despite extensive documentation of its limitations (2), it remains the “gold standard” method of measuring cell viability in common use today. But can this method truly measure viability? And how do we define cell viability, for that matter? Those fundamental questions are linked to whether we refer to cells as “alive” or “dead” in the context of bioprocessing and how that relates to their ability to produce the recombinant proteins or viruses that we may want to use as biotherapeutics or vaccines.
“Happy” Cells
Researchers and conference presenters often refer to “happy” cells as those appearing to be normal under a microscope and that grow at an expected rate and secrete desired proteins. Of course those properties are associated with viable cells, and a textbook definition of viability would include a quantification of living cells. That begs the question of how we determine whether a cell is alive or dead.
We expect that a living cell could undergo a recognized network of metabolic processes, but one fundamental property of such cells is their ability to divide. However, in scientific literature viability often is quoted in terms of the proportion (%) of cells within a sample that can exclude a dye such as trypan blue. Cells that become stained with trypan blue have damaged membranes and thus are incapable of growth or many other functions associated with normal metabolism.
A question arises, however, regarding timing: Do cells become incapacitated with respect to normal metabolism and their ability to divide for a period before that membrane damage occurs? If that were the case, then it could be argued that the values of viability obtained by the dye-exclusion assay overestimate the true viability of a culture as defined by the potential for cell division.
Methods of Determining Viability
Figure 1 outlines the predominant methods used for determining cell concentration and viability in cultures. Dye-exclusion methods use trypan blue and other dyes such as propidium iodide that have been adopted for general use in flow cytometry. In a basic method, cells are enumerated using a hemocytometer following dye staining. As a manual technique, that has been used for decades and involves loading a cell sample onto a hemocytometer and then using a tally counter for visual counting of cells that take up the dye. A viability percentage is calculated from the number of unstained cells related to the total number of cells. That same principle is applied by image-based analyzers such as the Roche Cedex XS (Figure 2).
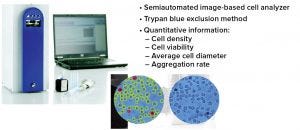
Figure 2: Image-based cell analysis
A number of alternative on-line instruments are now available for continuous monitoring of bioprocesses. Such methods generate an enormous amount of digital data. Dielectric spectroscopy and digital holography, for example, can provide a more realistic understanding of the metabolic state of producer cells. Applicable to continuous biomanufacturing, these alternatives lend themselves to replacing the commonly used dye-exclusion methods that are both off-line and limited in their information. Novel, digital, on-line methods are marker-free and indicate the metabolic state of cells in culture. Thus, they could enable development of strategic feeding regimes and timely product harvesting to reduce contamination by host-cell proteins that can include degradative enzymes originating from cell lysis. That offers the potential to provide consistently high-quality biologic products with minimal molecular heterogeneity. Recent work has demonstrated that using the resulting data to detect early but reversible stages of apoptosis can provide hitherto unavailable information about cell subpopulations and metabolic states (5, 8).
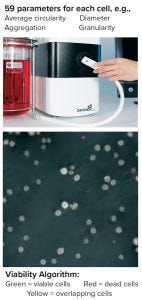
Figure 3: On-line digital holography by Ovizio
More sophisticated imaging systems include Ovizio’s iLine F on-line digital holography system (Figure 3). It can monitor cells continuously by pumping samples from a bioreactor through a closed loop at ~4.8 mL/min. The cells flow through an optical monitoring chamber before returning to the bioreactor. A holographic image of single cells in a field of view is created by exposure to a light beam and then processing both the intensity and phase of the scattered light. Software analysis of the resulting holograms measures 59 parameters related to cell characteristics: e.g., diameter, circularity aspect ratio, and granularity. Focused images differentiate living cells from dead cells. The advantages of this form of cell analysis are that it requires no dyes (making it marker-free) and that it provides for continuous real-time analysis of cell proliferation. The technology also provides a large amount of digital data that could be mined for hitherto unreported metabolic characteristics.
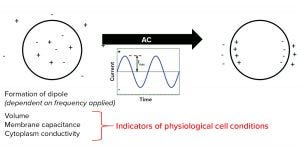
Figure 4: Dielectric properties of cells
Biocapacitance As a Dielectric Measurement: Dielectric measurements of cells rely on the principle that their intracellular ionic content is separated from surrounding aqueous media by an electrically insulating membrane. So cells can create a dipole of charge when exposed to an electromagnetic field (Figure 4). If that field is created from an alternating current, then the dipole formation depends on the current’s frequency: A low frequency creates a permanent dipole in the cell membrane; at high frequencies, no dipole might form. A “sweet spot” radiofrequency range provides for a characteristic beta-dispersion response profile. That response can be different for each cell type and depend on membrane permittivity and the conductivity of intracellular fluids (3).
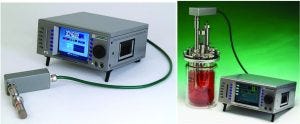
Figure 5: Biocapacitance monitor for on-line measurements
To monitor the proliferation of cells in a bioreactor using that principle, biomanufacturers can use a biocapacitance monitor such as Futura systems from ABER Instruments (Figure 5). The system comes with a sterilizable probe fitted with annular electrodes around its tip. That probe can be secured through the head plate of a bioreactor, where the tip can create a low-intensity electric field the size of a tennis ball. Increased capacitance caused by cell growth within that field can be monitored throughout a culture run. Figure 6 compares the output of a biocapacitance probe and an Ovizio holography system for growth of Chinese hamster ovary (CHO) cells expressing a monoclonal antibody (MAb). Of particular note is the strong correlation between those data during the exponential growth phase. However, the outputs differ at ~90 hours, when the inflection point for the capacitance data comes earlier and the decline phase is apparently steeper.
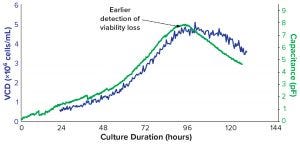
Figure 6: Comparison of optical and dielectric monitoring of Chinese hamster ovary cells
DEP Cytometry: Biocapacitance probes are valuable because they can be autoclaved and can monitor cells continuously in a bioreactor. The output records average properties of a population of cells that might be heterogeneous, particularly in the latter stages of cultures. But a dielectrophoretic (DEP) cytometer can measure the responses of individual cells to an electromagnetic field.
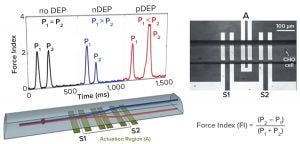
Figure 7: Dielectrophoretic (DEP) cytometer (5)
Figure 7 outlines the principle of an instrument developed at the University of Manitoba (4). Cells flow through a microcapillary tube at 5 cells/sec, allowing a sample of ~600 cells to be analyzed within 10 minutes. The detector has three electrodes. The middle one produces a radiofrequency field at 100 kHz to 10 MHz and acts as a DEP actuator that causes displacement of individual cells depending on their polarizability. Two sensing electrodes on either side of the actuator electronically measure the vertical displacement of cells caused by DEP actuation. Those two electrodes record an electronic signature for each cell (Figure 7), thus containing information about its dielectric status.
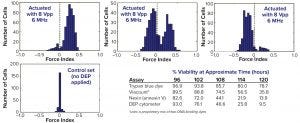
Figure 8: DEP cytometry time-lapse histograms showing binary populations of cells (5)
One key parameter extracted from that signature is called the force index (FI), an indicator of the relative difference in response from the two sensing electrodes. This DEP cytometer is proven as a valuable experimental tool for characterizing cell subpopulations in culture. With proper frequency selection (6 MHz), cells can be distinguished based on positive or negative force indices relating to changes in cellular polarizability observed toward the end of a culture.
Figure 8 shows the distribution of force indices in a batch culture at the critical time of cell viability loss at 96–120 hours postinoculation. If we ascribe the loss of cell viability to a change from a positive to a negative force index, then we can relate the measure of viability to more established staining methods. The inset table illustrates a good correlation between the DEP measure of viability and the annexin V method, which is an early apoptotic indicator based on a measure of the phosphatidyl serine marker on the outer surface of cell membranes. Note also a substantial difference in values between the DEP viability measure and the trypan blue viability measure, particularly at later time points.
Differences in viability measures from alternative assays were illustrated further in PhD work at the University of Manitoba (5). Although high viability values (>90%) were recorded by each of several methods during the exponential growth phase of cells in culture, substantial differences were observed during the decline phase (beyond 90 hours in the batch). So in Run A of Figure 9, values recorded at 120 hours show 80% viability by trypan blue but only 10% viability by DEP and annexin V. Thus, the recorded rate of cell viability loss is assay dependent and could be related to the sequence of events that occur during the demise of cells in that late stage of culture.

Figure 9: Cell viability monitoring (5) — Run A (left), Run B (right)
Further evidence was obtained in Run B, which includes a measure of the adenylate energy charge (AEC) of cell extracts at five late-stage time points. AEC measurement shows the state of phosphorylation for the adenosine nucleoside, making it an indicator for the energy status of the cells (6). Note that this value decreases at an even earlier stage than do the measures used for cell viability.
Induction of Apoptosis By Starvation
The death phase of cells in a bioreactor usually follows a well-established sequence of events characterized by apoptosis. This can be triggered by an accumulation of inhibitory metabolites or by a depletion of critical nutrients. Such late-stage events in a bioreactor can be simulated by inoculating exponentially growing cells into media depleted of glucose and glutamine (starvation media). Figure 10 shows a decrease in cytoplasmic conductivity values derived from data obtained by DEP cytometry (7). Those values decline over 48 hours following nutrient deprivation of cells in starvation media from a base value of 0.45 S/m to 0.05 S/m (8). This leads to the following question: At what point are those cells recoverable?
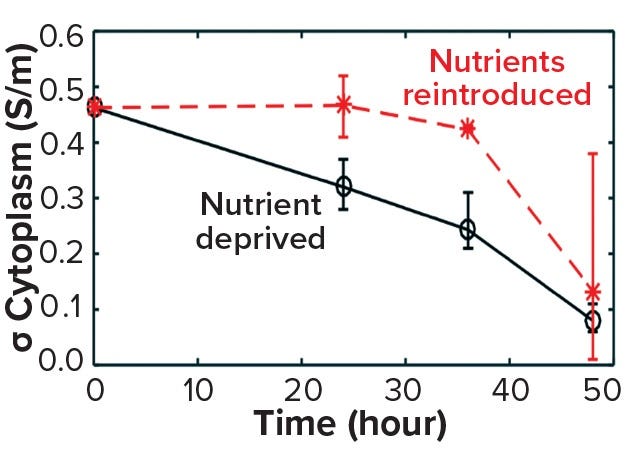
Figure 10a: Cell recovery from nutrient deprivation (8)
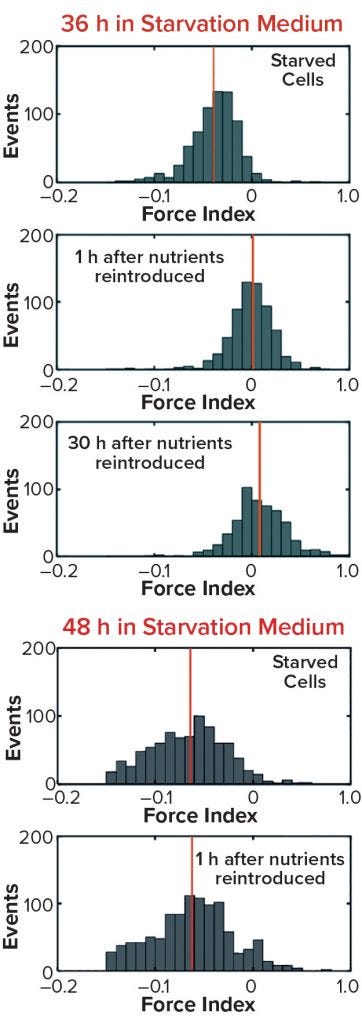
Figure 10b/c: Cell recovery from nutrient deprivation (8)
In a recent study, cells were reintroduced into glucose- and glutamine-containing media at four time points up to 48 hours in the starvation media (8). The data show that up to 36 hours poststarvation cells could recover their normal cytoplasmic conductivity and continue growing, whereas at 48 hours no cells could be recovered. That finding is further supported in Figure 10 by analysis of the force index observed with DEP cytometry. The mean negative value of starved cells at 36 hours recovers to a mean of zero after only an hour in the presence of nutrients, whereas cells obtained after 48 hours do not recover to their original values. These results suggest that a cytoplasmic conductivity of ~0.3 S/m could be a threshold value below which cells can be considered to be nonviable, whereas above that threshold cells maintain the potential for division and viability. It could be argued that cytoplasmic conductivity represents a clearer threshold of living or dead cells than that offered by membrane damage as determined by the trypan blue dye-exclusion assay.
Further data on the state of cells during nutrient deprivation are available from differential interference contrast microscopy. Figure 11 shows changes in the cell morphology during 48 hours of nutrient deprivation (9). Cells appear to gradually lose the microvilli associated with their outer cell membranes and assume a smooth appearance — but note that, nevertheless, the membrane remains intact and therefore trypan-blue negative up to that time point.

Figure 11: Differential interference contrast (DIC) microscopy (9)
Proposed Model of Cell Viability Loss
The model in Figure 12 combines well-characterized stages of apoptosis with measurements obtained by different methods for monitoring cell state in culture. The intracellular ionic content of a normal growing cell is in a steady state controlled by energy-dependent active transport mechanisms such as the ATPase pumps that exclude Na+ and Ca2+. Deprivation of energy substrates leads to depletion of ATP and subsequent decrease of the AEC. That causes the active transport pumps to fail, resulting in decreasing cytoplasmic conductivity. At the same time, reorientation of membrane phospholipids exposes phosphatidyl serine to the outer membrane, resulting in a positive annexin V assay. Those early stage events also can be detected by a DEP cytometer and a biocapacitance probe.
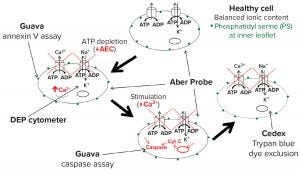
Figure 12: Proposed model for detecting changes during apoptosis
Further progression brings an increase in cytoplasmic Ca2+ and activation of caspases that can be assayed and identified as representing midpoint apoptosis. Membrane damage required for sensitivity to trypan blue comes only at a much later stage. Using this model and the measured events described above, we estimate that the time lapse between observed dielectric changes and membrane damage typically lasts 15–25 hours. That would account for the differences in viability estimates among methods. A further conclusion is that standard values obtained with the trypan blue dye-exclusion assay present a gross overestimation of culture viability as defined by the ability of cells to recover and divide.
Advantages of New Methods for On-Line Cell Monitoring
Although trypan blue dye exclusion has been the gold-standard for measuring the state of cells in a bioprocess, it suffers from clear disadvantages. First, the method normally requires manual sampling at regular intervals. Second, it is a late indicator of cell demise that grossly overestimates true viability. On-line optical and dielectric methods now available are particularly suitable for continuous culture operations. Such techniques can provide extensive data indicating the health state of cells in any type of bioreactor.
At minimum, dielectric methods such as biocapacitance provides give an early indication of cell viability loss. That can allow for early intervention with a feeding regime or early termination of a culture, reducing the potential for contamination of secreted products with host-cell proteins (HCPs) that proliferate once membrane damage occurs. These markerless methods require no cell staining, and with enhanced techniques such as multifrequency scanning they can identify cell subpopulations. Advanced optical methods such as those provided by online holography also can be used to mine previously untapped quality data about the state of cells in culture. Smoothing of cell surfaces could be one optical indicator of early onset changes to viability.
Further investigation is required to develop a full understanding of what are regarded as living or dead cells. But we believe that the definition of viability based upon the potential for cell division makes more sense than one based on membrane damage. If cells need to have a cytoplasmic conductivity >0.3 S/m for division to occur, then that could serve as a reasonable surrogate marker. This also could lead us all to a better understanding of what we really mean by “happy cells.”
References
1 Pappenheimer AM. Experimental Studies upon Lymphocytes: 1. The Reactions of Lymphocytes Under Various Experimental Conditions. J. Exp. Med. 25(5) 1917: 633–650.
2 Black L, Berenbaum MC. Factors Affecting the Dye Exclusion Test for Cell Viability. Exp. Cell Res. 35, 1964: 9–13.
3 Salimi E, et al. Dielectric Model for Chinese Hamster Ovary Cells Obtained By Dielectrophoresis Cytometry. Biomicrofluidics 10(1) 2016: 014111.
4 Nikolic-Jaric M, et al. Microwave Frequency Sensor for Detection of Biological Cells in Microfluidic Channels. Biomicrofluidics 3(3) 2009: 34103.
5 Braasch K, et al. The Changing Dielectric Properties of CHO Cells Can Be Used to Determine Early Apoptotic Events in a Bioprocess. Biotechnol. Bioeng. 110(11) 2013: 2902–2914.
6 Atkinson DE. The Energy Charge of the Adenylate Pool As a Regulatory Parameter: Interaction with Feedback Modifiers. Biochem. 7(11) 1968: 4030–4034.
7 Salimi E, et al. Single-Cell Dielectrophoresis Study of Apoptosis Progression Induced By Controlled Starvation. Bioelectrochem. 124, 2018: 73–79.
8 Fazelkhah A, et al. Cytoplasmic Conductivity As a Marker for Bioprocess Monitoring: Study of CHO Cells Under Nutrient Deprivation and Reintroduction. Biotechnol. Bioengin. 2019, in press.
9 Afshar S, et al. Progression of Change in Membrane Capacitance and Cytoplasm Conductivity of Cells During Controlled Starvation Using Dual-Frequency DEP Cytometry. Anal. Chim. Acta. 1059, 2019: 59–67.
Corresponding author Michael Butler ([email protected]) is principal investigator at the National Institute of Bioprocessing Research and Training (NIBRT), 26 Foster’s Avenue, Mount Merrion, Blackrock, County Dublin, A94 F5D5, Ireland; adjunct full professor at University College Dublin, and distinguished professor emeritus at the University of Manitoba, 66 Chancellors Circle, Winnipeg, MB R3T 2N2, Canada. Adam Bergin is a PhD researcher in the cell technology group at NIBRT; Katrin Braasch is a research associate, and Elham Salimi is an assistant professor in electrical engineering at the University of Manitoba in Canada.
You May Also Like


