Mechanistic Modeling for a Hydrophobic-Interaction Chromatography Process: Use in Vaccine Antigen PurificationMechanistic Modeling for a Hydrophobic-Interaction Chromatography Process: Use in Vaccine Antigen Purification
Bioprocess models and simulations are the basis for digital twins, which are virtual representations of physical processes and enabling methods of biopharma 4.0. Early adopters in the industry have shown potential application of this approach in nearly all stages of a product development life cycle. Experts in academia and the biopharmaceutical industry have studied mechanistic modeling as the main method of chromatography modeling. Mechanistic models are mathematical descriptions of physiochemical phenomena. They are based on first principles and thus can provide a full description of a system. Compared with purely data-driven models, mechanistic models provide higher prediction power, a potential to extrapolate well outside of a calibration space, and high fidelity for scale-up prediction. Studies have focused on the applications of chromatography mechanistic modeling for process development and optimization (1–3), robustness (4–6), and scale up (7, 8). Other studies on application to quality by design (QbD) have paved the way for validating process models to support commercial manufacturing (9–12).
Several user-friendly commercial chromatography mechanistic modeling software are available that do not require coding, making them practical for bioprocess scientists. Our study below uses GoSilico chromatography modeling software (from Cytiva, formerly GE Healthcare) to model a hydrophobic- interaction chromatography (HIC) process used to purify a vaccine antigen with a complex feed stock.
Material and Methods
System and Column Characterization: After setting the ÄKTA avant system (from Cytiva) in by-pass mode, we equilibrated the system in eluent consisting of 10-mM citrate and 400-mM NaCl. We injected a pulse of 100-μL sample of 10-mM citrate, 800-mM NaCl, and 1% acetone. Retention volumes to conductivity and UV peaks were obtained as system dead volumes. Dead volume for UV (VUV) was 0.43 mL and 0.55 mL for conductivity (Vconductivity).
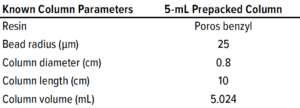
Table 1: Known parameters of the 5-mL prepacked POROS benzyl column used for model development.
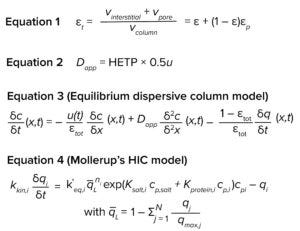
Equations
We performed chase pulse experiments on 5-mL prepacked POROS Benzyl column (from ThermoFisher Scientific) to determine total porosity (εtot) and apparent dispersion coefficient (Dapp) according to Equations 1 and 2, respectively (shown on next page). We equilibrated the column in eluent consisting of 20% ethanol, then injected a pulse of 100-µL sample of 1% acetone in 20% ethanol. The εtot and Dapp values were 76.8% and 0.2869 mm2/s, respectively. Table 1 shows known column parameters required for modeling. For the pilot scale-up experiment, we determined εtot and Dapp in the same way for the 2.6-cm inner-diameter column. The values were 68.3% and 0.2852 mm2/s, respectively.
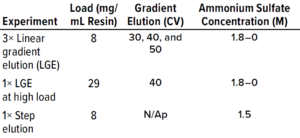
Table 2: Experiments performed for model calibration (CV = column volume).
Protein Experiments: We executed the five protein experiments shown in Table 2 to provide data needed for adsorption-model parameter estimation. For the protein purification experiments, we used the ÄKTA avant chromatography system. For model calibration and validation experiments, we used POROS Benzyl 5-mL prepacked column, and for the pilot-scale experiment, we used a XK26/40 column (from Cytiva) packed with POROS Benzyl resin.
UHPLC Analysis
Using ultrahigh-performance liquid chromatography (UHPLC), we analyzed starting materials for all experimental runs and for elution fractions from the linear gradient elution (LGE) at high load. An Agilent 1290 UHPLC system with UV detection set at 215 nm determined biomolecule content and purity. A reversed-phase column (Waters 186008946, BioResolve MAb column, 450 Å, 2.7 µm, 2.1 × 150 mm) held at 70 °C and a linear gradient of water and acetonitrile based buffers separated the biomolecules from in-process impurities. Accuracy and precision of the assay typically was 95–105%.
Model Calibration and Application
We performed model calibration using GoSilico chromatography modeling software. The equilibrium dispersive model (13, 14) served as the column model, and Mollerup’s hydrophobic interaction model (15) was the adsorption model. Both model equations are shown above.
For the equilibrium dispersive model, u is interstitial velocity and Dapp and εtot are as defined above. For the adsorption model, kkin is kinetic rate, k΄eq is the adsorption equilibrium, q– L is the fraction of free ligands, n is the stoichiometric coefficient, cp is the mobile-phase concentration, qi is the bound concentration, Ksalt is the activity parameter for salt, and Kprotein is the activity parameter for protein.
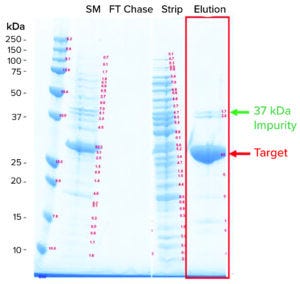
Figure 1: Sodium dodecyl sulfate–polyacrylamide gel electrophoresis (SDS-PAGE) analysis of a hydrophobic interaction chromatography (HIC) process (SM = starting material, FT = flowthrough).
Results and Discussion
Industrial HIC Process: Escherichia coli recombinantly expressed the target antigen. Following an anion-exchange capture step, HIC was the intermediate and polishing step. The HIC process was operated in bind-and-elute mode with the product binding to the ligand. We loaded the product onto the HIC system with the feed conditioned in 1.8 M ammonium sulfate (AmS). During elution, AmS concentration lowered to 1.5 M, leading to typical coelution of the target with impurities (Figure 1). Specifically, a prominent impurity was present at about 37-kDa molecular weight, which we referred to as the 37-kDa impurity. The 37-kDa impurity has lower hydrophobicity than the target because it elutes before the main target peak in an LGE experiment. Aside from the 37-kDa impurity, a group of minor impurities coelute with the target, which we referred to as the impurity cluster because they appear to collectively elute as a single peak after the main target peak in a LGE experiment.
Mechanistic Model Development: Fluid dynamic and thermodynamic effects need to be considered to characterize and describe a chromatography system accurately. System components such as mixers, tubing, and detectors (e.g., UV and conductivity) cause holdup volumes that need to be accounted for. We performed pulse-injection experiments without the column to ascertain dead volumes to the UV and conductivity meter.
To describe the occurring fluid-dynamic effects acting on solute molecules moving through a chromatography column, a suitable column model needs to be considered. For example, the general rate model (GRM) describes how molecules traverse through the interstitial bulk volume through convection and dispersion, cross a layer of stagnant film around the resin bead by means of film mass transfer, and pore diffusion of solvent molecules in porous adsorbent beads.
An adsorption model can describe thermodynamic effects. Adsorption models describe how molecules interact with ligand and competing molecules and can be used to describe adsorption modes.
For our study, we selected an equilibrium dispersive model as the column model (Equation 3). It is a simplified model that considers the effects of convection and dispersion but assumes the mass transfer of components not to be rate limiting and thus does not include a term to account for mass transfer limitation. Alhough the GRM is considered to be the most comprehensive column model, using a simpler model where applicable can reduce calibration effort, speed up simulations without compromising accuracy, and mitigate the risk of overfitting.
We selected the HIC adsorption isotherm model developed by Mollerup et al. (15). It describes the adsorption phenomenon as reversible interactions between solute molecules and hydrophobic ligands on an adsorbent surface. To consider effects dependent on protein and salt concentrations, activity coefficients are included (see Equation 4).
Model development workflow starts with system and column characterization in which tracer pulse experiments are performed to determine system dead volumes and column parameters such as porosity and dispersion. Following that, protein experiments (typically involving LGE studies) are needed to estimate component-specific isotherm parameters. Our study required five protein experiments for model calibration, including three LGE studies at low load conditions within the linear range of the isotherm, an isocratic elution experiment, and one LGE study at high-load condition (Table 2). Those experiments were performed on a 5-mL column volume (CV) prepacked column. We also performed UHPLC analysis of the high-load experiment to produce a concentration profile of the target protein and its coeluting impurities (Figure 2). That enabled us to determine the elution behaviors of the impurity species.
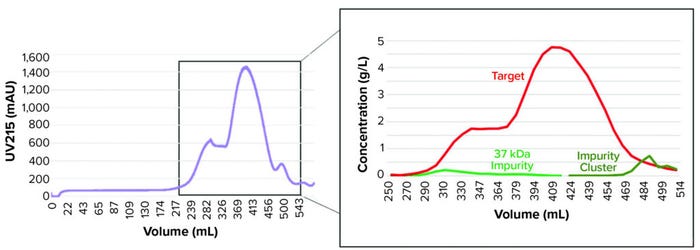
Figure 2: Ultrahigh-performance liquid chromatography (UHPLC) quantification (right) of protein species content along elution peaks (left) are used to support model development.
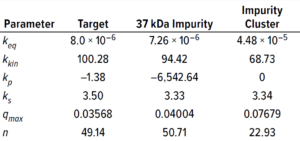
Table 3: Protein-specific model parameter values (estimated using GoSilico software).
Experimental online (chromatographs) and offline (UHPLC analysis) data were imported to the software, and model parameters were estimated. The software uses an inverse peak-fitting method to estimate unknown model parameters. The simulated chromatographs with the found parameter set overlapped well with the experimental chromatographs for calibration. Peak retention of the simulated elution peaks generally coincides well with that of the experimental elution peaks (Figure 3). Table 3 lists estimated values for the model parameters.
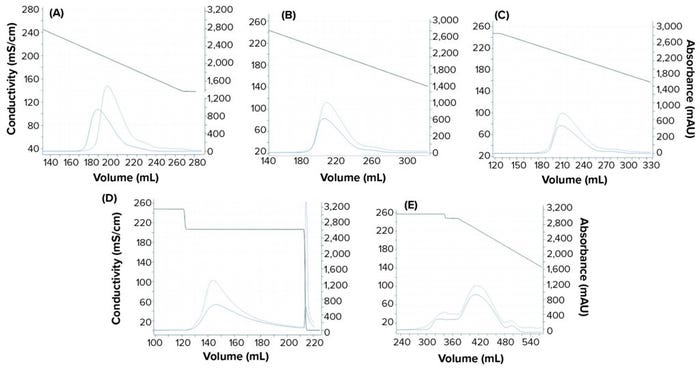
Figure 3: Chromatograms obtained from the GoSilico software model calibration; (a–c) linear gradient elution runs at low loading condition with 30 CV, 40 CV, and 50 CV gradient length, respectively; (d) step elution; (e) 40 CV linear gradient elution at overloaded condition. The dashed blue lines refer to experimental UV214 absorbance. The solid blue lines refer to simulated UV214 absorbance. The black lines refer to conductivity.
Model Validation
We perforemd calidation runs to evaluate the accuracy of the calibrated mechanistic model. The study included isocratic elution experiments at different loading conditions, including one at an intermediate load density of 17 g/L resin and one at high load density of 26 g/L resin. Loading material had a lower ionic strength in the validation runs than in the calibration experiments, most likely because of the variability of AmS stock solution used for sample conditioning. Thus, we adjusted AmS concentration in the feed material of the simulation to correct for ionic strength.
Figures 4a and 4b compare simulated and experimental chromatographs and show results for yield and purity. Results indicate that the in silico model was able to predict the target yield and purity within 5%, which is within the variability of UHPLC analytical assay (also 5%). For the high load experiment, the model was able to correctly predict the point of target breakthrough.
The model also predicted process performance of an experiment using starting material conditioned in 1.7 M AmS, which is well beyond the calibration space with starting material conditioned in 1.8 M AmS. The model predicted the reduced yield from target breakthrough during loading and the lower purity compared with having starting material conditioned in 1.8M AmS (Figure 4c).
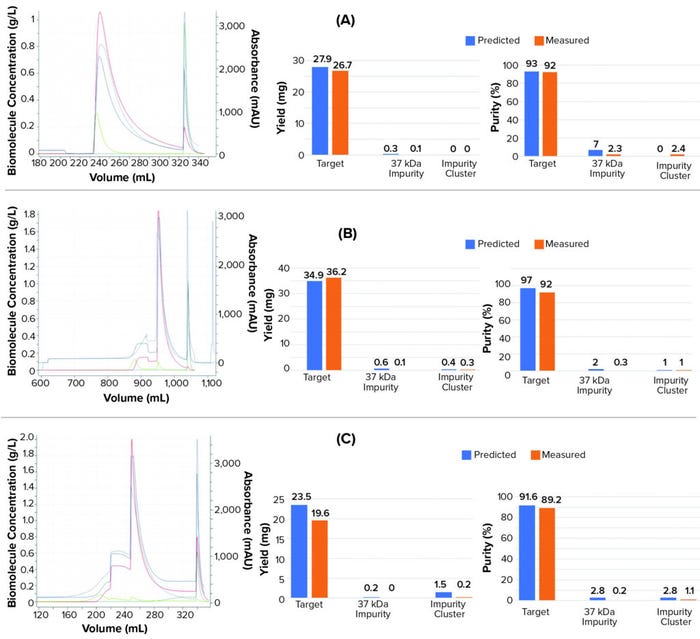
Figure 4: Chromatographs from validation experiments: isocratic elution experiments with (a) 17-g/L resin load, (b) 26-g/L resin load, and (c) load conditioned in 1.7 M AmS instead of 1.8M. Dashed blue line refers to the experimental UV214 absorbance. The solid blue lines represent the simulated UV214 absorbance. The red lines represent the target protein concentration. The light green lines represent the 37 kDa impurity concentration. The dark green line refers to the collective concentration of a cluster of impurities (impurity cluster).
Model Application
Design Space Optimization: Development of a scalable bioprocess requires that robust process set points be found. Mechanistic models can be a valuable tool to help gauge the understanding of a design space. Traditional design of experiments (DoE) approaches such as the commonly used central composition design (CCD) experimental design selects a few experimental points in a design space to fit a quadratic equation. However, the data are spread so thin that missing one experimental point could skew the results. In addition, complex biological processes usually cannot be described fully by simple quadratic equations.
Mechanistic models are high-fidelity, first-principle models that enable users to simulate thousands of experiments with minimum experimental effort. Such models can extrapolate well beyond a calibration space, thus providing an accurate and broad picture of a design space.
We performed a Latin hypercube sampling experiment using the mechanistic model in which 500 experimental points within the design space were simulated with different load densities and elution AmS concentrations. Contour maps for purity and yield were produced from the simulated data. Results from the sampling experiments suggested elution conditions around 1.52–1.46 M AmS and load density at 7–25 mg/mL resin represented the most robust operating range in terms of purity and recovery (Figure 5).
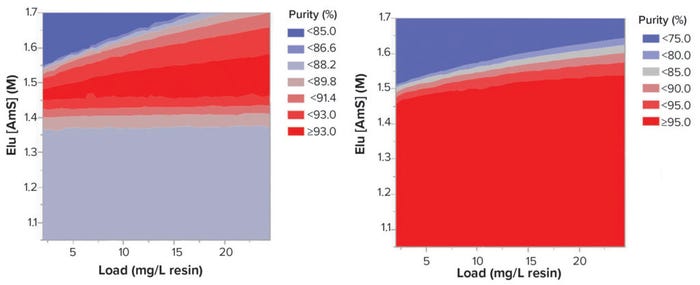
Figure 5: Contour graphs of the results from Latin hypercube simulation.
Scale-up Performance Prediction: Mechanistic modeling is a valuable tool for predicting scale-up process performance, thus derisking large-scale manufacturing runs and supporting root-cause analysis. Traditional data-driven approaches using scale-down models to predict scale-up performance do not provide system knowledge or enable understanding of a physical process. Thus, data-driven approaches are error prone in such applications. Mechanistic models, however, facilitate full understanding of a system and can help anticipate impacts of system changes. Furthermore, such models can be integrated to process automation control systems. With process analytical technology (PAT), mechanisitc models can be used for real-time process-state estimation and prediction of important output attributes such as yield and purity.
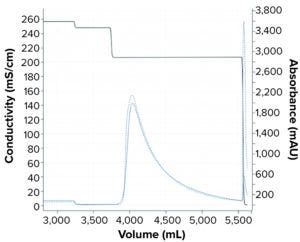
Figure 6: Comparing simulated and experimental chromatographs for pilot scale-up experiment. The dashed blue line refers to the experimental UV214 absorbance. The solid blue line refers to the simulated UV214 absorbance. The black line refers to conductivity.
We performed a pilot scale-up experiment using a 2.6-cm inner-diameter column packed to 19-cm bed height (e.g., 101 mL CV) to determine scale-up prediction capability of the mechanistic model developed in this study. To do that, we performed a tracer pulse experiment on the XK26 column (from Cytiva) packed with POROS Benzyl resin for column characterization to determine the porosity and Dapp for the new column. Simulation for the XK26 column was set up as the column model was updated with the new column parameters such as column dimension, porosities, and Dapp values. The adsorption model was transferred from what was obtained with the 5-mL prepacked column. The simulated chromatograph shown in Figure 6 demonstrates good alignment with the experimental chromatograph.
Future Directions
In the current study, a mechanistic model of an industrial HIC chromatography process used in vaccine manufacturing is developed using GoSilico chromatography modeling software. The workflow for model development is described herein. The accuracy of the model predictions was verified with validation runs using different loading conditions. We demonstrated proof-of-concept application cases, including a massive sampling study to provide design space understanding. Performance prediction of a pilot scale-up run was well demonstrated.
Chromatography modeling has been identified by digitalization initiatives in the biopharmaceutical industry as a promising tool for in silico process development and process control. Mechanistic models are excellent for providing accurate prediction of a full system. Current challenges of chromatography modeling using this approach include the unavailability or difficulty of using mechanistic models to describe more complex bioprocesses and certain adsorbent modalities. In addition, the time-consuming initial phase of model development limits the usefulness of this approach during early development stages. Recent proof-of-concept studies have been performed using hybrid modeling approaches to allow for flexibility in combining both mechanistic knowledge and process data to improve the speed and accuracy of chromatography modeling without deep knowledge of mechanistic details (17– 19).
References
1 Degerman M, Jakobsson N, Nilsson B. Modeling and Optimization of Preparative Reversed-Phase Liquid Chromatography for Insulin Purification. J. Chromatogr. A. 1162(1) 2007: 41–49; https://doi.org/10.1016/j.chroma.2007.02.062.
2 Ng CKS, et al. Design of High Productivity Antibody Capture By Protein A Chromatography Using an Integrated Experimental and Modeling Approach. J. Chromatogr. B. 899, 2012: 116–126; https://doi.org/10.1016/j.jchromb.2012.05.010.
3 Huuk TC, et al. Model-Based Integrated Optimization and Evaluation of a Multistep Ion Exchange Chromatography. Sep. Purif. Technol. 136, 2014: 207–222; https://doi.org/10.1016/j.seppur.2014.09.012.
4 Close EJ, et al. A Model-Based Approach for Identifying Robust Operating Conditions for Industrial Chromatography with Process Variability. Chem. Eng. Sci. 116, 2014:284–295; https://doi.org/10.1016/j.ces.2014.03.010.
5 Jakobsson N, Degerman M, Nilsson B. Optimization and Robustness Analysis of a Hydrophobic Interaction Chromatography Step. J. Chromatogr. A. 1099(1–2) 2005: 157–166; https://doi.org/10.1016/j.chroma.2005.09.009.
6 Jakobsson N, et al. Model-Based Robustness Analysis of an Ion-Exchange Chromatography Step. J. Chromatogr A. 1138(1–2) 2007: 109–119; https://doi.org/10.1016/j.chroma.2006.10.057.
7 Benner SW, et al. Prediction of Lab and Manufacturing Scale Chromatography Performance Using Minicolumns and Mechanistic Modeling. J. Chromatogr A. 1593, 2019: 54–62; https://doi.org/10.1016/j.chroma.2019.01.063.
8 Mollerup JM, et al. Development, Modeling, Optimization, and Scale-up of Chromatographic Purification of a Therapeutic Protein. Fluid Phase Equilibria. 261(1) 2007: 133–139; https://doi.org/10.1016/j.fluid.2007.07.047.
9 Andris S, Hubbuch J. Modeling of Hydrophobic Interaction Chromatography for the Separation of Antibody–Drug Conjugates and Its Application Towards Quality By Design. J. Biotechnol. 317, 2020: 48–58; https://doi.org/10.1016/j.jbiotec.2020.04.018.
10 Rischawy F, et al. Good Modeling Practice for Industrial Chromatography: Mechanistic Modeling of Ion Exchange Chromatography of a Bispecific Antibody. Comput. Chem. Eng. 130, 2019: 106532; https://doi.org/10.1016/j.compchemeng.2019.106532.
11 Shekhawat LK, Manvar AP, Rathore AS. Enablers for QbD Implementation: Mechanistic Modeling for Ion-Exchange Membrane Chromatography. J. Membr. Sci. 500, 2016: 86–98; https://doi.org/10.1016/j.memsci.2015.10.063.
12 Saleh D, et al. Cross-Scale Quality Assessment of a Mechanistic Cation-Exchange Chromatography Model. Biotechnol. Prog. 37(1) 2021: e3081; https://doi.org/10.1002/btpr.3081.
13 Guiochon G, Goldshan-Shirazi S, Katti AM. Fundamentals of Preparative and Nonlinear Chromatography. Academic Press: Boston, MA, 1994.
14 Kczmarski K, et al. Comparative Modeling of Breakthrough Curves of Bovine Serum Albumin in Anion-Exchange Chromatography. J. Chromatogr A. 925(1–2), 2001: 1–17; https://doi.org/.10.1016/s0021-9673(01)01035-4.
15 Mollerup JM, et al. Quality By Design: Thermodynamic Modelling of Chromatographic Separation of Proteins. J. Chromatogr. A. 1177(2) 2008: 200–206; https://doi.org/10.1016/j.chroma.2007.08.059.
16 Andris S, Hubbuch J. Modeling of Hydrophobic Interaction Chromatography for the Separation of Antibody–Drug Conjugates and Its Application Towards Quality By Design. J. Biotechnol. 317, 2020: 48–58; https://doi.org/10.1016/j.jbiotec.2020.04.018.
17 Narayanan H, et al. Hybrid Models for the Simulation and Prediction of Chromatographic Processes for Protein Capture. J. Chromatogr. A. 1650, 2021: 462248; https://doi.org/10.1016/j.chroma.2021.462248.
18 Wang G, et al. Root Cause Investigation of Deviations in Protein Chromatography Based on Mechanistic Models and Artificial Neutral Networks. J. Chromatogr. A. 1515, 2017: 146–153; https://doi.org/10.1016/j.chroma.2017.07.089.
19 Pirrung SM, et al. Optimization of Biopharmaceutical Downstream Processes Supported By Mechanistic Models and Artificial Neutral Networks. Biotechnol. Prog. 33(3) 2017: 696–707; https://doi.org/10.1002/btpr.2435.
Corresponding author Angela Shaoxu Li is a senior scientist at Sanofi, Vaccine CMC Development and Supply, 1755 Steeles Ave W, North York, Ontario M2R 3T4 Canada; 1-416-667-2700, x7052; [email protected]. Lars Biebinger is a mechanistic modeling specialist from Cytiva, GLSSG GmbH, Kriegsstraße 240, 76135 Karlsruhe, Germany. Jacob Trombley is an intern at Sanofi, vaccine CMC development and supply. Shilin Cheung is a scientist at Brunel Canada Ltd. on contract with Sanofi, Bow Valley Square 4, Suite 1410, 250 – 6th Avenue SW, T2P 3H7 Canada. Tao Yuan is head of drug substance development North America, vaccine CMC eevelopment and supply at Sanofi.
You May Also Like


