The Value of Single-Use and Other Flexible TechnologiesThe Value of Single-Use and Other Flexible Technologies
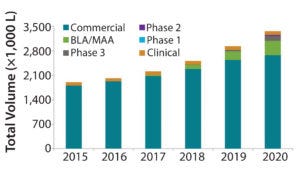
Figure 1: Industry-wide demand forecast for mammalian cell culture capacity (bioTRAK database and forecasting model)
The biopharmaceutical industry is adding mammalian cell culture capacity at rates that we haven’t seen in over a decade. Over the past five years (2012–2016), we estimate that industry-wide capacity has increased from 3.4 ML to 4.0 ML, an increase of 18% (1). We estimate that industry-wide capacity will increase over the coming five years (2016–2020) to 5.7 ML, an increase of >40%. Clearly, this growth is a response to the continued increase in demand for biopharmaceutical products and to the current tightening capacity environment.
Biomanufacturers also have announced a diversity of facilities over the years, with a mix of both conventional “six-pack” large stainless steel (SS) facilities and large commercial single-use (SU) “facility-of-the-future” projects. Perhaps it is time to acknowledge that both types of facilities have a significant role to play in supplying modern biopharmaceuticals. Larger SS facilities provide economies of scale that are difficult to achieve in SU facilities (2). SU technologies and modular construction provide flexibility, speed, and capital savings that enable rapid response to demand changes (3, 4). An optimum facility (or mix of facilities) depends on the nature of a company’s portfolio and future product-requirement forecasts.
Continuous processing — although still early in market adoption — is showing potential for significant improvements in process productivity and flexibility. The adoption of SU technologies and interest in continuous processing have increased at least in part because they enable more flexible supply chains. Here we highlight the challenges in forecasting future demand and provide an example of an approach to estimating the value of flexibility in manufacturing technologies.
The Challenges in Forecasting Demand
For nearly 15 years, BioProcess Technology Consultants (BPTC) has maintained bioTRAK, a database of publicly available information relevant to understanding trends in capacity supply and demand for producing modern biopharmaceutical products using mammalian cell culture and microbial fermentation. For its purposes, we define biopharmaceuticals as recombinant protein therapeutics, including monoclonal antibodies (MAbs). The bioTRAK system contains two primary datasets: One is based on products from midstage development to commercially marketed, with information that allows us to estimate their demand for manufacturing capacity. The other dataset is based on manufacturing facilities, with information that allows us to estimate the amount of capacity they can supply. We use the information in this database for different purposes. One is forecasting future supply and demand for manufacturing capacity. Figure 1 shows one industry-wide forecast for this demand in which we estimate that in 2020 demand will be ~3.4 ML.
As a result of performing forecasts on an industry-wide basis for many years, we have developed an appreciation for the challenges of forecasting future demand for manufacturing capacity. To better characterize the uncertainties, we have performed Monte-Carlo simulations using our forecasting model. Monte-Carlo simulation is a computerized quantitative technique for estimating the range of possible outcomes resulting from inputs to a model that vary according to a predefined probability distribution. In this example, we varied the following inputs to our forecasting model to estimate their effects on the output for forecasted volumetric demand in five years (2020):
Average price of commercial product (±20%)
Average manufacturing process overall yield (±30%)
Growth-rate factor to estimate future demand for existing commercial products (±20%)
Success of pipeline products (success rates not varied, but successful pipeline products were randomly selected from all pipeline products for each iteration).
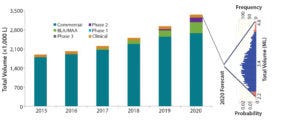
Figure 2: Monte-Carlo simulation results (5,000 iterations) show predicted demand distribution given variable input assumptions.
We used Crystal Ball software from Oracle with 5,000 iterations to run the simulation (Figure 2). Results provide several important insights: First, the variation is quite large in potential future (five year) industry-wide demand (based on assumed input variances), with the output distribution ranging from about 2.2 ML to 4.8 ML and the highest probability demand centered at the base case forecast of about 3.4 ML. Second, the demand distribution is “right tailed,” having a wider range on the high side than on the low side. Such distribution is characteristic of high-risk supply chains (5).
Although the Figure 2 example is for industry-wide demand forecasting, similar challenges face companies attempting to forecast future commercial demand for their pipelines or individual products in development. Certainly, the industry-wide forecasts presented here have greater uncertainty because of a lack of visibility into certain inputs (e.g., product pricing or process yields for which industry typically does not publish detailed information). However, companies face the same challenges and uncertainties in estimating market penetration and future growth rates for existing commercial products. Many companies have failed to forecast future product demand, which has led to significant supply chain challenges. Recognizing that, Brastow and Rice published an example of using Monte-Carlo simulations to forecast future demand range for a single company’s pipeline (6).
The Value of Flexibility
Given the inherent uncertainties in forecasting future demand for biopharmaceuticals, it is not surprising that flexibility in manufacturing has significant value for improving control of supply chains. Flexibility-enabling technologies such as SU equipment and modular facilities have been adopted increasingly during the past decade. Although continuous processing is at very early stages of adoption, it is of increasing interest to industry in part because of its promise to further improve manufacturing flexibility. Finally, strategies that improve manufacturers’ ability to be more responsive to unanticipated changes in demand (e.g, using contract manufacturers) also are part of industry’s response to the need for flexibility.
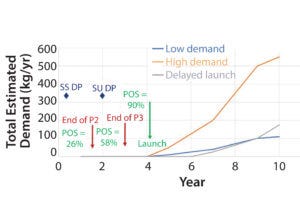
Figure 3: Construction timing for start and late-stage development in two cases (stainless steel and single-use) considered in our example for estimating the value of flexibility; rough postlaunch demand profiles for three scenarios (low and high demand and delayed launch) highlight the challenges faced by biopharmaceutical companies in forecasting future demand for development-stage products. (POS = probability of success)
Despite an intuitive understanding of the value of flexibility in biomanufacturing, the industry lacks good tools to quantify this value. Given the relevance that such understanding could have in manufacturing strategy decisions, it is worth considering approaches to estimating this value. Several studies have described approaches to estimating the value of flexible manufacturing in other industries (7, 8). In particular, one approach described by Maleyeff focuses on estimating the value of flexibility in high-risk supply chains (4).
In the oversimplified example outlined herein, we adopt Maleyeff’s approach to estimating the value of flexibility enabled by single-use technologies for a new, single-product biomanufacturing facility. Figure 3 shows the comparison that we modeled. Because of the longer timeline for construction of a conventional SS facility, the decision to proceed with such a project must be made in phase 2, whereas the shorter timeline for a single-use bioreactor facility allows construction to begin in phase 3.
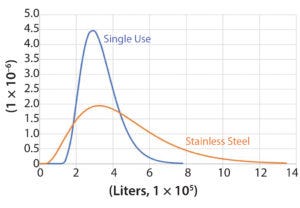
Figure 4: Gamma distributions fitting the forecast demand distribution range (in liters, x axis) for the stainless steel case (orange, based on phase 2 information) and the single-use case (blue, based on phase 3 information)
Because of the greater certainty of dose (g/patient/yr), market penetration (patients/yr), and yield (g drug product/L cell culture volume) at the start of construction of a single-use bioreactor facility during phase 3 in comparison to the start of construction of a SS facility during phase 2, the future demand distribution is considerably narrower for the SU case. Following Maleyeff’s methodology, we fit a gamma distribution to cover the range of those parameters because it allows modeling of a right-tailed distribution. So as not to skew the comparison, we set ranges to equalize the most frequent demand for both cases (Figure 4).
To estimate the optimal quantity of capacity in each case, we used a modified Newsvendor model adapted for our biopharmaceutical case to estimate the optimal supply quantity Q* in each case by minimizing total costs over the entire distribution of each demand forecast. Next, we selected capacities for our SS and SU bioreactor facilities that were near Q*, resulting in an SS facility (4 × 12,500 L) that was roughly twice as large as the SU bioreactor facility (12 × 2,000 L). Then we used BioSolve software from BioPharm Services to model the capital and operating costs for both facilities, assuming a typical MAb process.
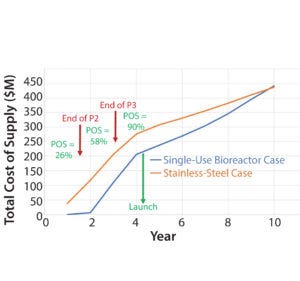
Figure 5: Cumulative total costs of construction and supply for the stainless-steel and single-use bioreactor cases in our example for estimating the value of flexibility
We developed a 5% discounted cash-flow model for both facilities, including capital costs and estimated operating costs for supplying the market through to five years postlaunch (Figure 5). Results indicate that the estimated value of flexibility enabled by the SU technology is over US$60 M in this example. That significant value is achieved even though the total cost of construction and supply for the SS option is slightly lower for the percentage of cases in which successful commercialization is achieved.
Clearly, this example is oversimplified. But it illustrates one approach to estimating the value of flexibility-enabling manufacturing technologies and strategies for our industry. It also highlights the main components of that value: the ability to make decisions about future production-supply quantities at times closer to peak demand when requirements can be more accurately estimated and the reduction of up-front capital costs in cases when the probability of success is relatively low.
More Flexibility in Future Processes
We demonstrated that flexibility-enabling technologies and strategies can have significant value, even if their associated CoGS are higher per unit. This value is derived from the ability to make manufacturing decisions when the demand profile for products is more certain. Our modeling approach can help quantify the value of flexible technologies for biopharmaceutical production based on the observation that future demand profiles for high-risk supply chains are right-tailed and narrow at times closer to peak demand. We believe that the high value of flexibility helps explain why SU technologies are being adopted — even for commercial manufacturing — despite technological challenges and supplier growing pains. It also suggests why continuous processing technologies may be attractive for industry, particularly if they can be developed to maximize flexibility while keeping CoGS closer to those achievable in conventional large SS facilities.
References
1 bioTRAK® Database. BioProcess Technology Consultants, Woburn, MA, 2017; www.bptc.com/what-we-do/biotrak-database.
2 Kelley B. Industrialization of MAb Production Technology: The Bioprocessing Industry at a Crossroads. mAbs 1(5) 2009: 443–452.
3 Levine HL, et al. Efficient, Flexible Facilities for the 21st Century. BioProcess Int. 10(11) 2012: 20–30.
4 Nelson KL. Approaches for Flexible Manufacturing Facilities in Vaccine Production. BioPharm Int. 24(11) 2011: 22–28.
5 Maleyeff J. Quantifying the Value of Flexibility in Supply Chains for High-Risk Products. J. Mgmt. Strategy 5(2) 2014: 16–24.
6 Brastow WC, Rice CW. Planning Pharmaceutical Manufacturing Strategies in an Uncertain World. BioProcess Int. 1(6) 2003: 46–55.
7 Hutchison GK, Sinha D. A Quantification of the Value of Flexibility. J. Mfg. Systems 8(1) 1989: 47–57.
8 Pyoun YS, Choi BK. Quantifying the Flexibility Value in Automated Manufacturing Systems. J. Mfg. Systems 13(2) 1994: 108–118.
Dawn M. Ecker is a consultant, Terence Davidovits is an associate consultant, and Thomas C. Ransohoff is vice president and principal consultant at BioProcess Technology Consultants, Inc. 12 Gill Street, Suite 5450, Woburn, MA 01801; 1-781-281-2701; [email protected].
You May Also Like


