Continuous Solids-Discharging Centrifugation: A Solution to the Challenges of Clarifying High–Cell-Density Mammalian Cell CulturesContinuous Solids-Discharging Centrifugation: A Solution to the Challenges of Clarifying High–Cell-Density Mammalian Cell Cultures
GEA WESTFALIA (WWW.GEA.COM)
Clarification is typically the first unit operation in the purification of monoclonal antibodies (MAbs) and other proteins from mammalian cell cultures. This process removes cells and cellular debris from the culture fluid to produce a clarified cell culture supernatant that will be suitable for further purification (1).
Before 2000, depth and tangential-flow microfiltration were standard clarification technologies in the biopharmaceutical industry. Process-scale centrifugation was considered to be a significant capital investment, and bioprocessors had limited ability to control (minimizing) the effects of shear on mammalian cells. The following decade saw an industry-wide adoption of centrifugation with traditional periodic discharge of solids for primary clarification of mammalian cell cultures. That shift to centrifugation was facilitated by the need to scale processes up to handle 10,000-L to 15,000-L bioreactors, with increasing harvest cell culture densities and titers. Significant technological advances in centrifugation design and operating conditions minimized shear effects on mammalian cells (2).
GEA WESTFALIA (WWW.GEA.COM)
Centrifugation is used in a number of bioprocess applications, including clarification of solutions from hormone, vaccine, and enzyme production; bacterial culture harvest; and concentration and separation of blood fractions (3). Typical centrifuges used for such applications are tubular-bowl designs used in low volume processes, decanters used when feed-solids concentrations are high (e.g., in sewage water separations), and disc-stack centrifuges.
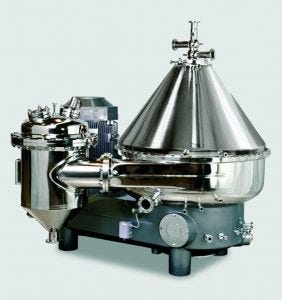
The latter are commonly used for clarification in the biopharmaceutical industry. Disc-stack centrifuges are fed continuously but discharge solids either periodically or continuously (3). A feed stream is fed into the centrifuge bowl while it rotates at a high g-force. Differences in density force cells to the periphery of the bowl, where they accumulate in the solids space, while cell-free centrate flows up the stacked discs through a centripetal pump and is collected for further processing. Centrate backpressure is applied to ensure hydrohermetic operation and that the centrifuge bowl remains full.
Over the past 20 years, cell culture densities and titers have increased significantly, leading to improved batch productivities (2). That increase creates a burden on centrifugation processes when solids-discharge intervals become too short and unmanageable. Thus, centrifuge process robustness can be compromised by higher turbidities in clarified supernatant and associated product losses. The challenge of higher cell densities and titers requires a more robust solids-discharge method that also minimizes capital investment and facility footprint.
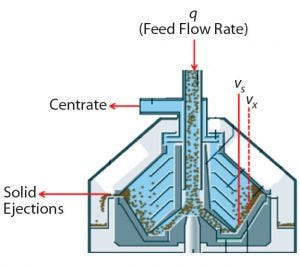
Figure 1: GEA disc-stack centrifuge for periodic solids discharge
Continuous solids-discharge disc stack centrifugation has been used in other industries such as brewing for robust removal of solids from process streams (4). Continuous-discharge centrifugation differs from periodic-discharge centrifugation (Figures 1 and 2) in that rather than solids being discharged periodically, they travel upward through channels above the disc stack for continuous discharge through nozzles into a chamber that has its own centripetal pump (larger than that for centrate collection). It pumps a highly concentrated solids stream out through discharge piping. The percentage of solids in that concentrate stream is relative to its flow rate, which is controlled by a valve.
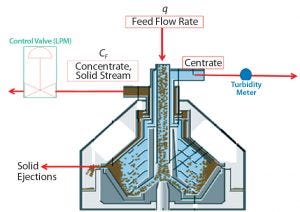
Figure 2: GEA disc-stack centrifuge for continuous solids discharge
Here we compare Biogen’s clarification performance for a high-titer/high–cell-density IgG1 MAb using periodic-discharge centrifugation and continuous solids-discharging centrifugation. We elaborate on how the implementation of this novel technology (continuous solids-discharging centrifugation) in the protein therapeutics industry provided a robust clarification process. We transitioned from periodic-discharge centrifugation to continuous solids-discharging centrifugation within the same production system (centrifugation skid) by changing out the bowl and performing minor piping modifications.
Materials and Methods
We used a Chinese hamster ovary (CHO) cell line to supply IgG1 MAb culture material for all studies. The cell culture process consists of a high-density working cell bank vial thaw followed by inoculum expansion steps and scale-up through multiple upstream bioreactor stages (60 L, 235 L, 950 L, 3,750 L, and 15,000 L). Before the harvest unit operation is initiated, the production bioreactor (15,000 L) is cooled to 2–8 °C, which improves product stability and reduces the risk of microbial contamination. Next, the culture pH is lowered rom pH 7.0 to pH 4.8 using 25% acetic acid to induce cell and cell debris flocculation into larger particles and precipitate host-cell impurities (leading to host-cell DNA and host-cell protein reduction with no adverse effect on product quality). That facilitates downstream separations by reducing the impurity burden on the downstream purification process (5).
Just before starting the harvest unit operation, we take samples and mix them to ensure homogeneous dispersion of cells. Those are pipetted into three centrifuge tubes, then spun down using a Beckman Allegra X-14 benchtop centrifuge to determine the packed cell volume (PCV, expressed as a percentage of solids) of the low-pH harvest feed stream. We spin down the samples at 2,750 rpm for six minutes, then place the tubes into a slide ruler to measure each sample’s solids contents. We enter the PCV values into the centrifuge’s distributed control system (DCS), and the automation averages those values and calculates either a solids discharge interval (for periodic-discharge centrifugation) or a concentrate stream flow rate (for continuous-discharge centrifugation) — using equations detailed below.
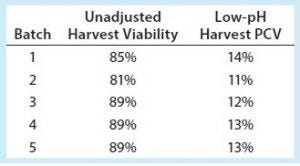
Table 1: Cell culture statistics
Robust centrifugation processes need to be developed with consideration for centrifuge feed-stream properties in addition to scaling parameters. Table 1 shows the unadjusted harvest viability percentages across five batches evaluated (clinical batches 1–3, validation batches 4 and 5), as well as the low-pH harvest (centrifuge feed) percentage of PCV.
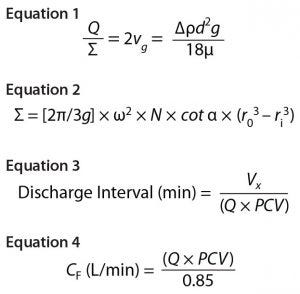
Equations 1–4
Both centrifugation scaling parameters are kept constant from development/pilot to manufacturing scale: Q denotes the centrifuge feed flow rate, and sigma (Σ) denotes the area of gravity settling that would be required to achieve equivalent separation efficiency as a disc-stack centrifuge. Σ depends on several factors, including centrifuge geometry, the number of discs in the disc stack, and rotational speed. As derived by Ambler (6), Sigma theory defines the Q/Σ required to remove half a population of particles of a given diameter as in Equation 1, where vg = sedimentation velocity of a particle due to gravity; Δρ = density difference between the solid particle and liquid phase; d = particle diameter; g = acceleration due to gravity; and μ = dynamic viscosity.
Thus, to achieve 100% removal of a given particle size, the flow rate must be reduced by a factor of two (6). In Equation 2 (7), Σ = equivalent clarification area of centrifuge (m2); g = acceleration due to gravity (m/s2); ω = angular bowl velocity (rad/s); N = number of discs in a stack; α = disc half-conical angle (°); r0 = outer radius of disc (m); ri = inner radius of disc (m).
Below are Σ values across centrifuge scales at typical process bowl speeds:
CSC-6 (pilot-scale centrifuge) 3% surface area of the CFD-130 unit
CSD-130 (large-scale manufacturing with a periodic-discharge centrifuge) 90% surface area of the CFD-130 unit
CFD-130 (large-scale manufacturing with a continuous-discharge centrifuge) surface area is proprietary.
As Q/Σ decreases, so does the size of particles that can be removed effectively by a centrifuge, thus improving clarification performance. Disc-stack centrifuges typically cannot remove cell debris and particulates <1 μm effectively. That limitation necessitates subsequent depth filtration to remove small particulates present in the centrate (product) stream before subsequent downstream processing (8).
To clarify clinical campaign batches’ low-pH harvest feed streams from batches 1–3, we used a GEA CSD-130 periodic-discharge GEA disc-stack centrifuge (Figure 1). The low-pH harvest stream is fed to this centrifuge through a hydrohermetic inlet, which reduces shear effects. To discharge solids periodically, the bowl is opened using a hydraulic discharge mechanism. That interval is determined based on Equation 3, where Vs = total solids volume (L); Vx = safety-factor solids volume (80% of Vs); Q = feed flow rate (L/min); and PCV = % solids in low pH harvest. The approximate Q/Σ for the three clinical batches using the periodic-discharge centrifugation was 7.0 nm/s.
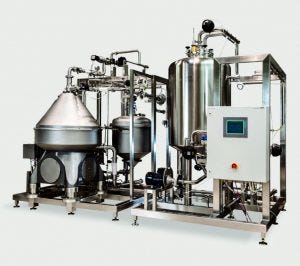
To clarify validation campaign batches’ low-pH harvest feed streams from batches 4 and 5, we used a GEA CFD-130 continuous solids-discharge disc-stack centrifuge (CFD-130). The continuous bowl includes innovative design features that permit concentrate (mobile solids) to collect in the solids space and travel upward through channels above the disc stack for continuous discharge through nozzles (Figure 2). Low-pH harvest is fed to the centrifuge through a hydrohermetic inlet, and solids are discharged continuously by the method described above. Buildup of compacted cells in the solid pump nozzles also requires this method to discharge by opening the bowl; however, that mode of discharge is much less frequent than it is with the periodic discharge method. The continuous bowl (CFD-130) was created and retrofitted onto a CSD-130 skid, which permitted use of the same bowl motor and supporting utilities. Integrating the CFD-130 bowl onto an existing CSD-130 skid provided for cost savings, rapid bowl changeover, and minimal impact to existing space constraints.
To target a concentrate stream composition of 85% solids, the concentrate flow rate is determined based on Equation 4, where Q = feed flow rate (L/min), and PCV = % solids in low-pH harvest. The concentrate flow rate (CF) is controlled by an automated flow-control valve.
During centrifugation, effluent turbidity measurements are used to evaluate properties of the centrate stream (containing product) and detect different levels of debris bypassing the centrifuge. For batches 1–5, we used an inline centrate turbidity sensor to evaluate the clarification performance of the machine. That also helped us detect when the bowl’s solids space was completely full and compacted based on turbidity deflection.
Q/Σ for the two validation batches using continuous-discharge centrifugation was ~6.2 nm/s. The difference in Q/Σ between the periodic and continuous solids discharge methods is marginal; thus, we deemed it insignificant to separation performance. For both methods under normal operations, solids discharges are partial: The centrifuge bowl opens just long enough to discharge solids from the bowl. If partial discharges cannot completely remove collected solids, then full discharges (of the entire bowl contents, ~25 L) can be implemented to bring a system back into equilibrium. That is undesirable from a yield perspective, however, because centrate is inherently lost during a full discharge.
Varying Feed-Stream Solids Concentrations: Both traditional and continuous-discharge methods lack adaptive feedback to synchronize discharge intervals (traditional) or concentrate/solids flow rate (continuous) with changing feed-stream solids concentrations (PCV) during processing. To compensate for changes in feed-stream PCV on a periodic solids-discharge centrifuge, we incorporate a safety factor (Vx in Equation 2) into our calculation, thus preventing the solids space from overfilling during processing. That safety factor inherently wastes product during each discharge because the volume (Vs – Vx) is product when the PCV sample value and actual PCV feed stream are equivalent. Despite that safety factor — and as a result of changing feed-stream solids concentrations (changing PCV) — we expected a couple of issues to arise with continuous discharge, having observed them with the periodic-discharge centrifuge.
When the PCV sample value was significantly lower than that of the actual feed stream, the centrifuge discharges too infrequently. This causes increased downstream filter loading and results in filter fouling. Subsequently, filter changeout causes product loss and adversely affects product hold times.
When the PCV sample value was significantly higher than the actual feed stream, the centrifuge discharged too frequently. That caused more product (supernatant) to be discharged to the drain, which decreased the centrifuge product step yield overall.
To further clarify our product across all five batches (using both centrifugation solids discharge methods), Biogen’s platform process uses Millistak X0HC depth filters from MilliporeSigma after the centrifugation step. In these filters, dual layers of depth-filtration media based on diatomaceous earth are bound by a positively charged resin binder (nominal retention rating <0.1 μm). Subsequent unit operations in this harvest process are 0.22-μm polishing filtration, neutralization, and viral inactivation in preparation for downstream processing.
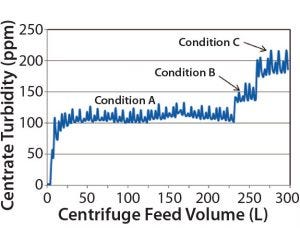
Figure 3: Three conditions of increasing Q/Σ were evaluated. Condition A was the conservative (baseline) condition; Condition B had a Q/Σ ~1.2× that of Condition A; Condition C had a Q/Σ ~1.4× that of Condition A. Based on these experiments comparing centrate turbidity (ppm) and centrifuge feed volume (L), Condition A was chosen for large-scale manufacturing because that produced the lowest baseline centrate turbidities (110–120 ppm). No centrifugation or depth-filtration issues (increasing centrate turbidity or high depth filtration pressure drop profiles) were observed at pilot scale.
Results and Discussion
Our goal in using these two different solids-discharge strategies was to examine
process effectiveness quantified by centrifugation step yield
process clarification efficiency (determined by centrate turbidity and subsequent differential pressure drop across downstream filters).
Periodic Solids Discharging: Harvest process development experiments at pilot scale provided initial operating conditions for large-scale manufacturing (Figure 3). As stated above, the solids discharge interval is a function of the low-pH harvest PCV (solids concentration) measurement. We assumed that solids are distributed homogenously throughout a bioreactor, thus making their discharges frequent enough to prevent a large amount of solids from migrating into the centrate.

Table 2: Batches 1–3 discharge comparison
The first three large-scale clinical batches used the time-based periodic-discharge strategy similar to the process developed at pilot scale. In the large-scale clinical batches, however, we saw elevated centrate turbidity during centrifugation. That occurrence required the discharge-interval timer to be decreased manually, thus increasing the discharge frequency (Table 2). Despite that intervention, elevated centrate turbidity was observed. To establish more robust centrifugation process control, we performed full discharges. That was more effective at reducing centrate turbidity, with the full discharges completely removing collected solids content from the centrifuge bowl. However, a consequence was increased loss of the liquid product-containing fraction.
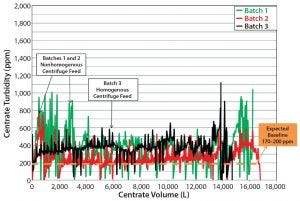
Figure 4: Batches 1–3 centrate outlet turbidity
Although the centrate turbidity baseline shifted continuously during processing of large-scale manufacturing batches 1 and 2 (Figure 4), all variables remained constant: bowl speed, temperature, feed flow rate, and centrate back pressure. This suggested that the change in centrate turbidity was attributable to some process or equipment factor changing the solids concentration in the product feed stream.
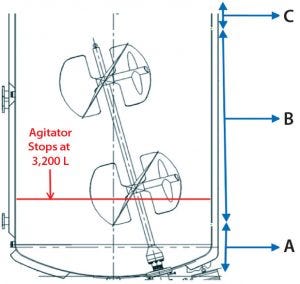
Figure 5: Bioreactor liquid levels at corresponding solids distribution zones in Figure 6; (A) first ~2,000 L fed to centrifuge; (B) subsequent ~13,000 L fed to centrifuge; (C) final ~1,000 L fed to centrifuge
When comparing bioreactor volume (Figure 5) with centrate turbidity baselines in batch 2 (Figure 6), we observed that the solids concentration in the feed stream (PCV) appeared to be inconsistent. The centrate turbidity baseline seemed to correlate with the volume of culture remaining in the bioreactor. To understand that phenomenon, we divided the harvest turbidity profile into three distinct zones (Figure 6).
Based on observations in Figure 5 and 6, we hypothesized that insufficient mixing due to solids settling below the bioreactor’s agitator impeller (Zone A) and solids settling when agitation stopped (Zone B) led to a nonuniform level of solids in the feed stream to the centrifuge. That consequently made the solids-discharge interval unreliable to conform with the needed frequency because the time-based discharge assumes that a feed stream is homogenous. Because of the nonuniform solids levels, the first clinical batch had to be halted before the entire batch was clarified. The filters downstream of the centrifuge had been fouled because of high solids loading (Figure 9).
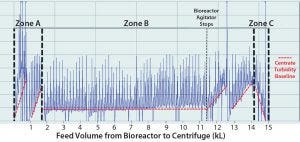
Figure 6: Batch 2 centrate outlet turbidity was tested. (A) Zone A (first ~2,000 L of feed volume transferred from the bioreactor to the centrifuge); based on the slope of the turbidity baseline, this first ~2,000 L contained the highest level of solids, and before starting transfer from bioreactor to the centrifuge, that volume was below the bioreactor’s agitator impeller. (B) Zone B (subsequent ~13,000 L of feed volume transferred from the bioreactor to the centrifuge); during this transfer time when there is ~3200 L in the bioreactor, the bioreactor’s agitator turns off due to physical constraints. (C) Zone C (the last ~1,000 L of volume in the bioreactor) contained the lowest amount of solids.
Improving Process Reliability (Batch 3): Considering the challenges of the first two batches, we sought to optimize subsequent large-scale manufacturing for batch 3 to make it more representative of pilot-plant centrifugation performance. Having manually increased the solids-discharge frequency, implemented full discharges (which is undesirable because of associated centrate/product losses), and examined the centrate turbidity baselines for large-scale manufacturing batches 1 and 2, we deemed that the mixing strategy needed to be revised to ensure that PCV was as uniform as possible during centrifugation.
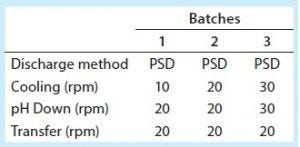
Table 3: Discharge comparison, batches 1–3
Table 3 shows bioreactor agitation rates during harvest for clinical batches 1–3. During the first two batches, the agitation rate was 10 rpm during cooling (which takes about five hours) and 20 rpm during low-pH harvest adjustment (which takes about two hours). To help prevent solids settling, we increased the agitation rate during bioreactor cooling and low-pH harvest adjustment for batch 3. But to ensure that the equipment continued to work properly, we did not change the agitation rate during transfer out. Those changes made the feed stream for batch 3 more uniform, as seen in the relatively level centrate turbidity baseline of the volume feed from bioreactor to centrifuge (Figure 4). But once the volume fell below the bioreactor’s lower agitator impeller, the turbidity baseline increased again, indicating an increase in feed-stream solids (Figure 4). After agitation ended, we had to manually increase the discharge frequency to ensure that the centrifuge effectively removed solids from centrate to prevent downstream filter fouling (Table 1). Despite resolving the lack of bioreactor homogeneity we had observed during large-scale manufacturing batches 1 and 2, we determined that increased cell settling is unavoidable once the bioreactor volume falls below the lower agitator impeller. That makes a more robust centrifugation strategy necessary for feed streams with high cell densities.
Based on GEA’s recommendations, the minimum solids discharge interval for periodic-discharge centrifuges is about two minutes. That allows time for a centrifuge bowl to reach steady state, for automation programming sequences to complete, and for establishing baseline centrate turbidity. Based on our calculations, the cell density of our IgG1 MAb did not correlate with solids discharge intervals that were under two minutes.
Continuous Solids-Discharging Centrifugation (Batches 4 and 5): Although increased mixing improved process consistency for batch 3 (compared with 1 and 2), key issues still needed to be resolved. We needed to ensure that solids-discharge intervals would not be reduced outside the centrifuge manufacturer’s recommendations and that the unit could respond to changing amounts of solids in the feed stream. To resolve those concerns, we implemented a continuous solids-discharging centrifuge in validation batches 4 and 5.
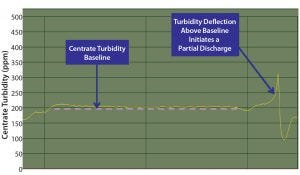
Figure 7: Partial discharges were initiated when either the centrate turbidity increased by >75% from the baseline centrate turbidity or a predefined maximum centrate turbidity threshold was reached
As mentioned, the PCV sampling method assumes feed-stream homogeneity to determine the discharge frequency for either traditional solids discharging (Equation 3) or the concentrate (solids) flow rate for continuous discharging (Equation 4). Using data from the periodic method (batches 1–3), we determined when implementing the continuous solids discharge design that similar issues with changing feed-stream solids concentrations could occur. To mitigate that risk, we integrated turbidity-based adaptive feedback into the continuous solids-discharge centrifuge control logic. That functionality uses clarification parameters (e.g., Q/Σ) equivalent to those with the periodic method, but discharges are triggered by a turbidity instrument on the outlet of the centrifuge when it senses that solid levels are above baseline, compacting the solid stream and making it immobile (Figure 7).

Table 4: Discharge comparison, batches 1–5
As described, a continuous solids-discharging centrifuge discharges solids continuously through submerged nozzles and uses back pressure on a concentrate (solids) centripetal pump inside the spinning bowl to regulate solids concentration in the discharge stream. The adaptive feedback-control scheme we incorporated with the continuous design provided uniform product to downstream filters and significantly reduced the centrifuge’s discharge frequency (Table 4). Furthermore, if maximizing harvest yields (achieved by maximizing the percentage of solids in the discharging concentrate stream) were not a high priority, as it was in these batches, even fewer partial discharges could have been required. Partial discharges were required only when compaction restricted the concentrate flow rate or when feed-stream solids increased such that more of them were entering the centrifuge than were being removed.
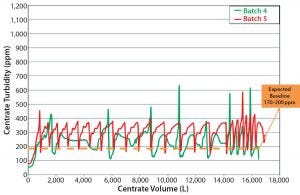
Figure 8: Centrate outlet turbidity, batches 4 and 5
During batch 4 (the first continuous solids-discharge batch), we changed the agitation rate to match that of batches 1 and 2 (Table 2) without a notable increase in centrate turbidity. For batch 5, we changed the agitation rates to match batch 3 (Table 2). Unlike in batches 1–3, the centrate turbidity profiles from batches 4 and 5 were comparable regardless of the bioreactor agitation rate (Figure 8).
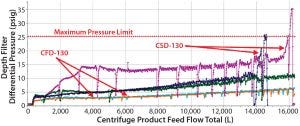
Figure 9: Pressure-drop profiles of depth filters were compared. Depth filters fouled for batch 1 (magenta) and batch 3 (blue), but performance was acceptable for batch 2 (green). That is probably due to manual intervention, which is not a robust process control scheme. The best performances were observed during batches 4 (orange) and 5 (light blue), both using the continuous-discharge centrifugation strategy.
When compared with periodic-discharge centrifugation (Figures 4 and 8, Table 4), the continuous solids-discharging centrifugation method proved to be superior because it improved process clarification efficiency (with a lower centrate baseline turbidity). Also, the continuous solids-discharge strategy improved subsequent downstream filter performance by decreasing the overall amount of solid debris being captured in harvest and reducing pressure spikes usually caused by periodic partial discharges (Figure 9).
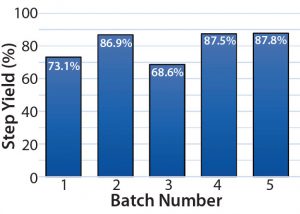
Figure 10: Harvest step yield, batches 1–5 (from bioreactor to centrate tank)
Finally, the average centrifugation step yields from batches 4 and 5 increased by >10% over those of batches 1 and 3 (periodic discharges) (Figure 10). Note that for batch 2 the PCV was 11%; however, the ejection interval was increased manually to eject at an interval that was equivalent to 15.6% theoretical PCV. That caused the centrifuge to eject close to its 120-second interval limit. Although it would be unsustainable, that change was made at the beginning of batch 2, and it did significantly contribute to the improved step yield.
Process Robustness Improved
We modified the skid configuration to allow use of a Westfalia CSD-130 (periodic discharge) or CFD-130 (continuous discharge) in the same centrifugation skid. That enabled the flexibility to process both low- and high-density cell culture feed streams. The CFD-130 design inherently required less frequent discharging because the centrifuge continuously emits the solid stream. Given a roughly equivalent clarification efficiency (CSD Q/Σ= 7 × 10⁹; CFD Q/Σ = 6.2 × 10⁹), the continuous-discharge design ensured that discharge intervals were not reduced beyond the manufacturer’s recommended 120-second minimum.
When using the CFD-130, we noted the following benefits: lowered centrate turbidity, a means of controlling turbidity, improved depth-filter performance, and ultimately increased step yield.
Lower Centrate Turbidity Profiles: The CFD-130 allowed for fewer discharges and thereby less disturbance to the solids space (less frequent solids discharges and centrate turbidity spikes).
Turbidity Control Technology: This technology and control scheme was introduced to compensate for variability in the feed-stream PCV measurement. The control scheme performed a partial discharge whenever centrate turbidity increased above an established baseline.
Superior Depth-Filter Performance: With the CSD-130, the first clinical batch had to be halted before the entire batch could be clarified because the filters downstream of the centrifuge had become fouled due to high solids loading. To prevent that fouling from recurring, we had to perform manual discharges for batches 2 and 3. Batches 4 and 5 using the CFD-130 with turbidity control provided constant flow to the depth filters and demonstrated a reduction in differential pressure, therefore lessening the risk of filter fouling.
Increased Step Yield: The centrifugation step yield was improved by >10% when comparing batches 4 and 5 (continuous discharge) with batches 1 and 3 (periodic discharge).
Through our evaluation described herein, we have shown that continuous solids-discharging centrifugation is a solution to improve mammalian cell culture clarification performance and robustness for high–cell-density large-scale production processes.
Acknowledgments
We are grateful to contributions from Michael J. Rohr (regional sales engineer) and David S. Ireland (senior technical engineer) at GEA Mechanical Equipment US Inc. in Northvale NJ; and to David Brainard (process engineering manager), Tolga Musa (associate director of process engineering), and Matthew Westoby (previous associate director of protein purification development) at Biogen Inc. in Morrisville, NC.
References
1 Liu HF, et al. Recovery and Purification Process Development for Monoclonal Antibody Production. MAbs 2(5) 2010: 480–499; doi:10.4161/mabs.2.5.12645.
2 Shukla A, Kandula JR. Harvest and Recovery of Monoclonal Antibodies from Large-Scale Mammalian Cell Culture. BioPharm Int. 21(5) 2008.
3 Current Developments in Biotechnology and Bioengineering: Foundations of Biotechnology and Bioengineering. Pandy A, Teixeira JA, Ed. Elsevier: Amsterdam, The Netherlands, 2016.
4 Hardwick WA. Handbook of Brewing. Marcel Dekker: New York, NY, 1995; page 348.
5 Westoby M, et al. Effects of Solution Environment on Mammalian Cell Fermentation Broth Properties: Enhanced Impurity Removal and Clarification Performance. Biotechnol. Bioeng. 108(1) 2011: 50–58; doi:10.1002/bit.22923.
6 Ambler CM. The Theory of Scaling Up Laboratory Data for the Sedimentation Type Centrifuge. J. Biochem. Microbio. Technol. Eng. 1(2) 1959: 185–205; doi:10.1002/jbmte.390010206.
7 Shpritzer R. Evaluation of a Continuous Disc Stack Centrifuge for the Clarification of Mammalian Cell Cultures. 225th ACS National Meeting, 24 March 2003, New Orleans, LA. American Chemical Society: Washington, D.C.
8 Iammarino M, et al. Impact of Cell Density and Viability on Primary Clarification of Mammalian Cell Broth: An Analysis Using Disc-Stack Centrifugation and Charged Depth Filtration. BioProcess Int. 5(10) 2007: 38–50.
Ardarion Richardson is a process engineer III, and corresponding author Joshua Walker is a senior engineer in the engineering and technology department of Biogen Inc., 5000 Davis Drive, Morrisville, NC 27560; [email protected], [email protected].
You May Also Like


