Characterization of Postcapture Impurity Removal Across an Adsorptive Depth FilterCharacterization of Postcapture Impurity Removal Across an Adsorptive Depth Filter
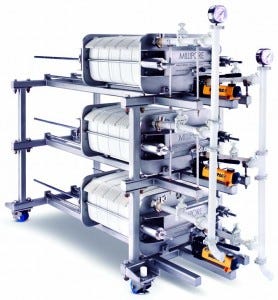
EMD MILLIPORE (WWW.EMDMILLIPORE.COM)
In the manufacture of monoclonal antibodies (MAbs), the first purification step following harvest clarification is normally protein A affinity chromatography because of its high selectivity for IgG and high process yield (1, 2). At this stage, a MAb is eluted from a protein A ligand at low pH and then held or adjusted to a low pH (pH ≤ 3.8) for a given amount of time before pH adjustment, usually ≥30 minutes, in a virus inactivation (VI) step targeted at retroviruses (3, 4). After VI, product pools are adjusted to a pH that is appropriate for further downstream unit operations, which may include one or several additional modes of chromatography, virus filtration, and final formulation (5).
During the VI and subsequent pH adjustment steps, operators commonly observe a significant amount of precipitation and turbidity in their product pools (2). Precipitants require larger sterilizing-grade filter areas after VI. Components that are generally responsible for precipitation at low pH (or during pH adjustment) include product-related species such as high– molecular-weight aggregates and process-related molecular impurities such as host-cell proteins (HCPs) and DNA (3, 6). Increased process-related impurities such as HCPs and DNA can be related to cell type (e.g., bacterial/yeast lysate will produce more impurities than will Chinese hamster ovary (CHO) cells) (7). It also can come from increased cellular debris that can be attributed to excessively low cell viability at the time of harvest (8).
Reported solutions to the precipitation problem include increasing the surface area of the sterilizing-grade filter and using inline prefiltration (6). However, because of potentially slow kinetics, the end point of a precipitation event may be difficult to characterize, thus leading to unpredictability of filter-area requirements and even possible filter failure (6).
Another option is using adsorptive depth filtration (ADF) containing diatomaceous earth (DE) to remove precipitants in pH-adjusted protein A eluates. Kandula et al. cautioned that such DE use in downstream processing following protein A may be viewed as unfavorable because of the potential for leachables introduction to process streams (6). However, that concern is minimal for processes in which a bind– elute chromatography or ultrafiltration/ diafiltration (UF/DF) step is used downstream of ADF. Those steps should be able to effectively clear small leachate species (that are not already removed by ADF flushes) by the bind–elute flow-through action or UF/DF permeation (9).
The capacity of depth filters to remove turbidity and protect sterilizing filters has been demonstrated, as have the ability of depth filters to reduce soluble process-related impurities. Yigzaw et al. thoroughly investigated the ability of depth filters to reduce the amount of HCP in a MAb process through optimization of the harvest clarification step (10). For that study, turbidity (measured by UV absorbance at 410 nm) was used to monitor the effectiveness of ADF in reducing HCP. The work showed an ability of depth filtration to reduce HCP in cell-culture harvest fluid. In terms of molecular impurity removal downstream of the protein A capture step, Haverstock et al. characterized varying levels of HCP removal from pH-adjusted pools as a function of pH (11).
We initially investigated ADF to supplement removal of HCPs in a MAb purification process, adding a depth filter to the existing process along with the normal sterilizing-grade filter following VI. Additional testing of the depth filter helped us characterize the reduction of other process-related impurities, including residual CHO DNA and residual protein A ligand. We performed these tests at both laboratory (10 L) and production (1,000 L) scales. Upon implementing ADF into this process, we also investigated the feasibility of removing a subsequent column step.
Materials and Methods
Monoclonal antibodies A (pI 8.15– 8.65) and B (pI 8.6–8.9) are IgG1 MAbs produced by CHO cells.
Cell Culture: CHO cells producing either MAb-A or MAb-B were cultured, expanded, and inoculated into 10-L to 2,000-L bioreactors with proprietary media free of animal- derived components. We clarified the 10-L cultures using ADF and sterile filtration and supernatant from 130-L, 1,000-L, and 2,000-L reactors using centrifugation, ADF, and sterile filtration. All reactors were harvested on day 15 after inoculation and/or within 24 hours of cell viability falling below 70%.
Purification: Following clarification, MAb-A and MAb-B cell culture supernatants were loaded onto a MabSelect SuRe protein A affinity chromatography column from GE Healthcare. We eluted both MAbs at low pH. Then we adjusted the pH of MAb-A eluates using 2 M acetic acid to 3.7 and held them for an hour for VI of enveloped viruses before adjusting pH to 6.5 (unless otherwise specified) using 2 M tromethamine (Tris). We adjusted the pH of MAb-B eluates to 5.0 using 2 M Tris immediately upon elution from protein A, then stored them at 2–8 °C and later adjusted pH to 6.5, 7.0, or 7.5.
Adsorptive Depth Filtration: Following pH adjustment, the MAbs were loaded onto either a Millistak+ D0HC ADF prefilter or a Millstak+ X0HC ADF terminal filter (both from EMD Millipore) at a flux of 100 L/m2/h (LMH) (unless otherwise specified) to a target loading of 100 L/m2 (unless otherwise specified) based on the area of the X0HC filter. We used device areas of 23 cm2 for small-scale trials and 270 cm2, 540 cm2, or 1.1 m2 device areas for intermediate- and process-scale confirmations. During depth filtration, differential pressures were monitored as a function of loading, and we calculated filter resistance as the ratio of differential pressure to flux. Figure 1 shows our experimental set-up for these ADF experiments.

Figure 1: Diagram of experimental set-up used to assess adsorptive depth filtration (ADF) in MAb-A and MAb-B processes following protein A; in this diagram “ADF” refers to either the terminal ADF, ADF prefilter, or a filter train consisting of an ADF prefilter and ADF in series. Unless otherwise specified, flux onto an ADF is standardized to 100 L/m2/hour.
Anion-Exchange Resins and Membranes: Anion-exchange (AEX) resin 1 consisted of quaternary amine ligand on a highly cross-linked agarose base matrix. AEX resin 2 consisted of a quaternized polyethyleneimine ligand on a cross- linked poly(styrene-divinylbenzene) base matrix. AEX membrane 1 is a stabilized reinforced cellulose membrane with a quaternary ammonium ligand. AEX membrane 2 is an ultrahigh–molecular-weight polyethylene membrane with a primary amine ligand.
Host-Cell Protein: Unless otherwise specified, we determined HCP concentrations by immunoassay with a third-generation CHO HCP enzyme- linked immunosorbent assay (ELISA) kit from Cygnus Technologies, carrying out the ELISA method according to the manufacturer’s protocol. For Experiment 3, we used a sandwich ELISA to measure CHO HCP. Capture antisera bound the HCP, which was then detected using biotinylated antisera and extravidin–horseradish peroxidase. This method used ABTS as a chromogenic substrate. Samples of unknown HCP concentration were interpolated from a standard curve.
Residual Protein A Ligand: We measured residual protein A concentration by ELISA as well, with a MabSelect SuRe kit from Repligen. Briefly, a capture antibody bound MabSelect SuRe protein A, which is then detected using biotinylated rabbit antibodies against protein A and streptavidin–horseradish peroxidase. We used tetramethyl benzidine (TMB) as the chromogenic substrate. Samples of unknown concentration were interpolated from a MabSelect SuRe protein A standard curve.
Residual CHO DNA: For Experiment 3, our procedure for determining residual CHO DNA concentration was based on quantitative polymerase chain reaction (qPCR) and an ABI PRISM 7900HT sequence detection system. The CHO qPCR assay was designed to detect a CHO retroviral sequence that may be present in CHO cell-line products. The amount of CHO DNA present in each sample was interpolated from another standard curve.
For Experiment 6, our procedure for determining residual CHO DNA concentration was based on the PrepSeq DNA sample preparation kit and resSEQ quantitative CHO DNA kit from Life Technologies. For real- time PCR analyses, we use an oligonucleotide probe containing both a fluorescent reporter dye and a quencher. When the probe is intact, the fluorescence is quenched. If a target sequence is present, the probe anneals and the reporter dye is subsequently cleaved from the probe by the 5′-nuclease activity of Taq DNA polymerase as the associated primer is extended, generating a fluorescence signal. In each run, we generated a standard curve from known amounts of CHO DNA and calculated the amount of residual CHO DNA in our samples from that standard curve.
Results and Discussion
Experiment 1 — Initial Characterization of ADF for MAb-A:
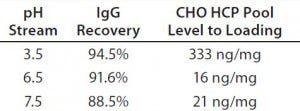
Table 1: IgG recovery and host-cell protein (HCP) level at an adsorptive depth filter (ADF) volumetric loading of 160 L/m2 as a function of supernatant pH
We loaded protein A eluate of MAb-A (after adjusting to pH 3.5, 6.5, or 7.5) onto a terminal ADF to ≥160 L/m2 and took in-process samples across these filtrations at 20-L/m2 intervals. At all loading levels, process streams adjusted to pH 6.5 and 7.5 contained lower HCP levels than the pH 3.5 stream (Figure 2), which is probably the result of more negatively charged impurities adsorbing to the ADF filter media. IgG recovery levels increased with decreasing feed pH, which is also consistent with the existence of an interaction with the positive charge contained in the ADF filter (Table 1).
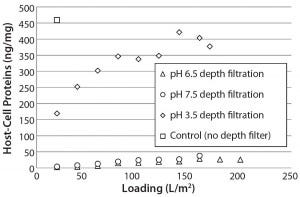
Figure 2: Host-cell protein (HCP) content in adsorptive depth filtrate samples remains lower at higher supernatant pH, which is consistent with an interaction between negatively charged HCP and positively charged ADF. Control uses only 0.2-µm membrane filtration.
Experiment 2 — Scale-Up Confirmation of MAb-A ADF: We performed a series of three ADF experiments using intermediate-scale devices. The first such experiment used a 270-cm2 terminal filter alone; however, due to increased turbidity of the feed material (because of increased IgG and impurities concentration in the protein A eluate), the ADF reached an excessively high differential pressure (>20 psi) and could not be loaded beyond 66 L/m2 (compared with 160 L/m2 previously). We took in-line samples at 20-L/m2 intervals during this experiment.
In the second experiment, we mitigated the pressure increase by using a looser-grade prefilter, which enabled removal of larger particles and reduced plugging on the denser terminal ADF filter. During this trial, we loaded both the prefilter and terminal ADF filter to 93 L/m2 and took in-process samples at 20-L/m2 intervals. We observed a modest pressure increase with this filter combination, but it was well within processing tolerances. In our third experiment, we loaded starting material across a 23-cm2 ADF prefilter device alone (at 238 L/m2) to demonstrate the capacity of the ADF prefilter.
Figure 3 illustrates resistance as a function of loading for all three trials using these ADF filter trains. We measured HCP across all three filtrations, and Figure 4 shows the results. Starting HCP levels and conductivity (16 mS/cm, 6 mS/cm) in the ADF load material were higher in the scale-up run than in the previous small-scale experiments, so the sample fraction HCP levels also were higher. However, we confirmed HCP content in the depth-filtered fractions to be lower than that measured using dead-end (0.2-µm) filters alone (Figure 4). We observed little difference in HCP as a function of loading with the addition of the ADF prefilter. Additional analyses showed that very little HCP was removed across the ADF prefilter alone, as expected, because of the lower charge density of that protective filter. We did observe a difference in HCP content between our starting loading material and the 0.2- µm only control, which may be related to assay variability or removal of precipitation caused by adjustment to pH 6.5.
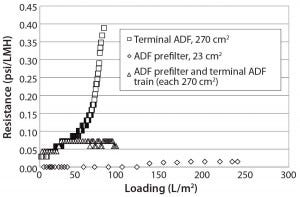
Figure 3: Resistance as a function of loading for terminal adsorptive- depth filtration (ADF), ADF prefilter, and ADF filter train shows that terminal ADF alone reaches higher pressure than when a prefilter is added in-line
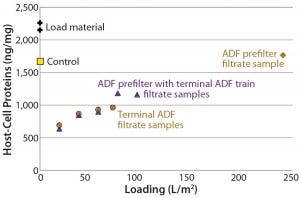
Figure 4: Plot of host-cell protein (HCP) content in adsorptive depth filtrate samples shows that the terminal ADF reduced HCP content relative to that of starting load material, non-ADF (0.2-µm filter only) control, and ADF prefilter alone.
Experiment 3 — Process-Scale Verification of ADF for MAb-A: Here, we implemented the ADF process demonstrated at intermediate scale above for pilot-scale manufacturing in a 130-L bioreactor. For small-scale verification of the planned larger-scale depth filtration, we filtered a sample of protein A eluate across the ADF prefilter (23 cm2), then pooled the results and filtered them across a terminal ADF (23 cm2) to a loading of 223 and 233 L/m2 for each filter, respectively.
We depth filtered the remaining bulk of the eluate pool using a 270-cm2 ADF prefilter, pooled the results, and then filtered them using a 540-cm2 terminal ADF filter. Filters operated at fluxes of 186 and 93 LMH and to loadings of 238 and 119 L/m2 (for the prefilter and terminal filter, respectively) without observable pressure increases across either filter. We took samples at intervals throughout this process and found that all in-line and pooled ADF samples exhibited HCP levels below the level of detection (LOD) of our assay. The ADF prefilter and terminal ADF filter reduced the CHO DNA levels from 34.6 pg/mg to 0.8 pg/mg. Residual protein A was reduced from 1.14 ng/mg to a level below the LOD (0.4 ng/mg) of the assay.
We found DNA, residual protein A, and CHO HCP in the ADF pool to be very similar to that of the pool from the subsequent AEX flow-through (FT) step: 0.8 pg/mg, <0.4 ng/mg, and <38 ng/mg for ADF; <0.8 pg/mg, <0.4 ng/mg, and <28 ng/mg, respectively for AEX FT. Based on this observation, we designed and executed follow-up experiments to assess whether the AEX column would be necessary for removal of these impurities in a MAb-A purification process that included ADF after protein A capture.
Experiment 4 — MAb-A Process Comparison With and Without Depth Filtration: We designed another set of experiments to determine the contribution of the ADF train in removal of impurities in MAb purification. First we split the adjusted protein A eluate into two separate process streams, one including ADF and the other without ADF. We loaded the stream with ADF (including a prefilter at a 1:1 ratio) to 126 L/m2 and filtered the stream without ADF with a 0.2-µm filter alone. Both streams were processed separately through subsequent downstream AEX FT and bind–elute (BE) polishing chromatography steps. We sampled pools from all process intermediates.
HCP levels were lower throughout the process in the stream containing ADF and were 0.87 log10 lower following the final polishing step than for the process without ADF (Table 2). We estimated the level of MAb-A recovery across the X0HC depth filter in this experiment to be 94%.

Table 2: Host-cell protein (HCP) profile through a MAb-A purification process with and without adsorptive depth filtration (ADF)
Experiment 5 — MAb-A Process Comparison With and Without an AEX Column: We loaded adjusted protein A eluate material across a terminal ADF filter to 98 L/m2, this time splitting the ADF pool into two streams to compare processes with and without an AEX FT step. We took pool samples after the remaining steps of the purification process for both streams and measured MAb-A recovery across the depth filtration to be 83.6%. We attributed that low recovery level to an early termination of the recovery flush through the ADF filter.
Table 3 shows that the ADF step removed 2.6 log10 of HCP, whereas the subsequent AEX FT step had negligible impact on HCP removal. The final HCP values after BE polishing chromatography were almost identical across the streams both with and without AEX FT. We observed a similar trend for residual protein A when tracking that throughout the process. These results suggest that using an ADF operation after protein A capture rendered the use of a subsequent AEX chromatography step redundant for clearing residual CHO HCP and residual protein A ligand impurities.

Table 3: Comparing residual Chinese hamster ovary (CHO) host-cell protein (HCP) and protein A levels for processes that either include or omit anion-exchange flow-through chromatography, both having an adsorptive depth filter (ADF) following pH adjustment, virus inactivation (VI), and pH adjustment
Experiment 6 — MAb-A 1,000-L Scale-Up Process Verification: From a 1,000-L scale run, we filtered an adjusted protein A eluate using a 0.55-m2 ADF prefilter (to 112.4 L/m2) and a 1.1-m2 ADF filter (to 56.2 L/m2). To verify the results obtained in Experiment 5 at a larger scale for HCP, residual CHO DNA, and residual protein A ligand removal in a MAb-A process, we tested material from a 1,000-L purification process according to Figure 5. Table 4 shows that all levels were reduced across the ADF and that including an AEX step had a negligible effect on those impurity levels.
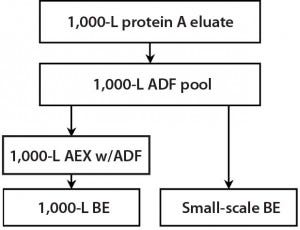
Figure 5: During a 1,000-L bioreactor purification run, material was taken for small- scale experiments to demonstrate the effect of ADF on impurities removal in the MAb-A process both with and without AEX.

Table 4: Residual CHO DNA, protein A, and HCP assay results from 1,000-L bioreactor processing
Experiment 7 — Comparison of ADF with AEX Resins and Membranes in MAb-B Process: For a second antibody (MAb-B), we compared a purification process that included a terminal ADF step with processes including either AEX chromatography or an AEX membrane filtration following the capture step. We purified protein A eluates adjusted to pH 6.5, 7.0, or 7.5 over one of the following matrices: ADF, AEX Resin 1, AEX Resin 2, AEX Membrane 1, or AEX Membrane 2. Table 5 lists the resulting ADF/AEX matrix volumes, loading/flush flow rates, loading levels, and recoveries. Figure 6 shows assay results from in-line samples taken during the load and recovery flush. Pool recovery is based on an IgG mass balance.

Table 5: Comparing run parameters for adsorptive depth filter (ADF) and anion-exchange (AEX) matrices
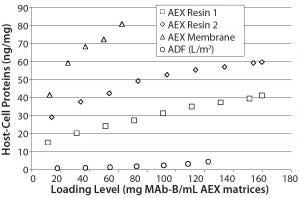
Figure 6: ADF showed higher clearance of residual CHO HCP than two AEX resins and membrane adsorbers; because scale could not be normalized to match other datasets, data from AEX membrane 2 is not shown here (at pH 7.5 with 634 mg MAb-B/0.08-mL membrane, CHO HCP was measured at 66 ng/mg).
Those results show that terminal ADF provides greater HCP reduction than the other matrices tested. Recovery levels across the ADF filter at pH 7.5 were similar to those seen for both AEX resins and slightly lower than those measured for both AEX membranes. Such levels of clearance (about one additional log of HCP ng/mg clearance for most comparisons) are similar to MAb-A clearance levels in Table 3.
Discussion
The levels of process-related impurity removal we measured for residual CHO HCP, residual CHO DNA, and residual protein A ligand in samples following ADF were at least as low as (or lower than) those seen in AEX flow-through samples for two MAbs. These results suggest that adding a depth filter postcapture to a MAb purification process could make the AEX step redundant for removal of those impurities.
Observed recovery levels across the depth filter were slightly lower than those seen across the AEX resins used in both MAb-A and MAb-B processes. This is expected: In addition to the common charge interactions for both technologies, depth filtration can bind IgG or process-related impurities through hydrophobic interactions, which could be responsible for additional IgG adsorption (10).
Because of developmental time constraints and our objective to limit the extent of change from the original process, we did not optimize pH of the protein A eluate or pH and ionic strength of the buffer used for equilibration and recovery flushing in depth filtration for the terminal ADF step of MAb-A. Additional improvements in recovery and/or HCP reduction might be realized if those parameters are characterized more fully. We considered only 100 L/m2 loading levels on the terminal ADF filter at a 100-LMH flux to maximize impurity removal. Additional gains in efficiency and productivity could be realized at higher levels of loading and flux, as shown by Haverstock et al., who found little change in HCP across higher flux levels (11).
Virus Safety Considerations: In addition to molecular impurity clearance of molecular species such as CHO HCP and DNA, AEX FT often is used to support virus safety in MAb processes. Our work demonstrates that ADF is suitable for removal of CHO HCP, CHO DNA, and residual protein A ligand; however, fully replacing AEX with ADF presents many challenges for viral clearance. With all other technologies that are claimed as virus-removal strategies (as opposed to virus inactivation), associated integrity tests must indicate the ability of a device to perform the virus removal function. For example, membrane filters have a corresponding postuse integrity test. And for chromatography columns, associated preuse specifications for asymmetry and height equivalent to a theoretical plate (HETP or plate height) indicate that flow distribution is uniform through the media and no resin-bed cracking is present to cause bypass of the fluid stream through those media.
If ADF were to be claimed in a viral-safety strategy, it would need a similar approach to ensuring virus- removal functionality. Current ADF manufacturing technology ensures that the filters can remove large particulates from relatively impure streams, where the effects of variability among device lots is minimal. Manufacturing technologies for virus-removal media are designed to much higher standards, however, and include rigorous lot- release testing specific to viral clearance. By contrast, no virus- removal claims are made for ADF. Providers of ADF media would need a testing strategy to ensure consistent virus clearance. The potential utility of ADF to remove viruses in a MAb process has been demonstrated (12, 13), but because of these challenges, the responsibility would be on end users to ensure that acceptable strategies are in place to test, validate, and confirm integrity within their own processes.
In a recent study, Iskra et al. (14) demonstrated the ability of ADF to lower HCP levels in a protein A pool and enhance removal of xenotropic murine leukemia virus (xMuLV) across a downstream AEX chromatography step. Their work demonstrates that even if ADF cannot be validated for virus removal, it could increase robustness of the downstream virus-removal capabilities of an AEX step.
Scalability: We demonstrated scalability of ADF filters from bench to pilot scale (1,000 L) during our initial phases of testing, with similar levels of recovery and CHO-HCP removal across the depth filtration steps at each scale. No immediate scale-up issues were observed, but future verification will be necessary. For example, recovery flush volume is one parameter that could affect recovery levels and thus will need to be optimized for future larger-scale runs.
Different Molecules: We have demonstrated the utility of ADF after VI for two MAb molecules to date. Our initial data suggest that an ADF process could be used as a replacement for an AEX FT step for removing HCP, residual protein A, and residual CHO DNA in MAb processes. Future studies will characterize and investigate not only additional molecules, but also the critical parameters for the ADF unit operation. Once those parameters are identified, a more in-depth characterization of the design space will help establish and quantify the levels of risk associated with an ADF step.
Leachables/Extractables: We have also considered the risk of introducing leachables into product streams. Leachables and extractables that have been characterized for depth filtration include organic carbon, metals, inorganic salts, and fibers (9). Upon discussion and risk assessment, we concluded that transmission of those leachables through the downstream process into final drug products was unlikely because
the recommended initial flush volume for the depth filter specified in our purification process is predicted to remove a majority of leachables (15)
both MAb-A and MAb-B ADF steps are followed by both BE chromatography and UF/DF steps.
The low-pH hold occurs early in a typical MAb purification process, which could allow most manufacturers the option of adding a depth filter. But the risk of leachables transmission through the process probably will be molecule and/or platform specific.
Promising Results, More Work to Do
We demonstrated the usefulness of terminal ADF to remove HCP, residual CHO DNA, and residual protein A ligands after the capture step in a MAb process for two molecules at multiple process scales. Our data suggest that adding terminal ADF to a MAb purification process could eliminate the need for AEX FT in that process. However, further characterization and verification of the ADF step will be necessary, and some outstanding questions will need to be addressed in future experiments.
References
1 Low D, O’Leary R, Pujar NS. Future of Antibody Purification. J. Chromatogr. B 848, 2007: 48–63.
2 Shukla AA, et al. Downstream Process of Monoclonal Antibodies: Application of Platform Approaches. J. Chromatogr. B 848, 2007: 28–39.
3 Shukla AA, et al. Strategies to Address Aggregation During Protein A Chromatography. BioProcess Int. 3(5) 2005: 36–45.
4 Brorson K, et al. Bracketed Generic Inactivation of Rodent Retroviruses By Low pH Treatment for Monoclonal Antibodies and Recombinant Proteins. Biotechnol. Bioeng. 82(3) 2003: 321–329.
5 Shukla AA, Thommes J. Recent Advances in Large-Scale Production of Monoclonal Antibodies and Related Proteins. Trends Biotechnol. 28(5) 2010: 253–261.
6 Kandula S, et al. Design of a Filter Train for Precipitate Removal in Monoclonal Antibody Downstream Processing. Biotechnol. Appl. Bioc. 54, 2009: 149–155.
7 Yavorsky D, et al. The Clarification of Bioreactor Cell Cultures for Biopharmaceuticals. Pharmaceut. Technol. March 2003: 62–76.
8 Hogwood C, et al. The Dynamics of the CHO Host Cell Protein Profile During Clarification and Protein A Capture in a Platform Antibody Purification Process. Biotechnol. Bioeng. 110(1) 2013: 240–251.
9 Viresolve Prefilter®: Extractables Characterization. EMD Millipore: Billerica, MA, 2012.
10 Yigzaw Y, et al. Exploitation of the Adsorptive Properties of Depth Filters for Host Cell Protein Removal During Monoclonal Antibody Production. Biotechnol. Progr. 22, 2006: 288–296.
11 Haverstock R, et al. CHOP Removal By Depth Filtration Post- Protein A Capture. Abstr. Pap. Am. Chem. Soc. 2010.
12 Zhou JX, et al. Viral Clearance Using Disposable Systems in Monoclonal Antibody Commercial Downstream Processing. Biotechnol. Bioeng. 100(3) 2008: 488–496.
13 Tipton B, et al. Retrovirus and Parvovirus Clearance from an Affinity Column Product Using Adsorptive Depth Filtration. BioPharm Int. September 2002: 43–50.
14 Iskra T, et al. The Effect of Protein A Cycle Number on the Performance and Lifetime of an Anion Exchange Polishing Step. Biotechnol. Bioeng. 110(4) 2013: 1142–1152.
15 Millistak+® Pod Disposable Depth Filter Performance Guide. EMD Millipore: Billerica, MA, 2013.
Corresponding author John Schreffler, PhD, is a group leader, Tom Klimek is a process scientist, Pam Maisey is a researcher, Xun Zuo is a group leader, and Eric Routhier is a director at Eisai, 210 Welsh Pool Road, Exton, PA 19341; 1-610-423-6557; [email protected]. Corresponding author Matthew Bailley is a process development scientist, Peter Agneta is an account manager, and Michael Felo is a single-use product manager at EMD Millipore, 900 Middlesex Turnpike, Billerica, MA; 1-610-299-5171; [email protected]. W. Erick Wiltsie is an associate scientist at GlaxoSmithKline.
You May Also Like


