Apparent Matrix Effects in an Iduronate 2-Sulfatase Specific Activity AssayApparent Matrix Effects in an Iduronate 2-Sulfatase Specific Activity Assay

Figure 1: Reactions in the SHP631 I2S activity assay: In the first step catalyzed by I2S, the substrate (IdoA2S-4MU) is hydrolyzed to IdoA-4MU and sulfate. In the second step, 4MU is released by the action of IDUA. Fluorescence quantitation of 4MU product is carried out following a high-pH quench.
The recombinant fusion protein SHP631 consists of a chimeric monoclonal antibody binding to human insulin receptor and iduronate-2-sulfatase (I2S). This product is being developed as an enzyme replacement therapy to treat cognitive symptoms of Hunter’s syndrome. Because the current therapy (idursulfase, brand name Elaprase from Shire) cannot cross the blood–brain barrier (BBB), SHP631 is being developed to do so, enabling the presence of I2S in the brain. The enzymatic activity of this molecule is measured using the substrate 4-methyl umbelliferyl-α-L-idopyranosiduronic acid 2-sulfate (IdoA2S-4MU). The measured specific activity of SHP631 in-process samples tends to be lower when measured at lower dilution factor (DF) in the assay, indicating an apparent matrix effect. So assay results are difficult to compare among different SHP631 in-process samples. Here, we identify possible sources of inhibition and describe a method to correct activity values for the observed inhibition.
Materials and Methods
Carbosynth custom synthesied IdoA2S4MU, and Shire generated α-L-iduronidase (IDUA). We obtained 4-methyl-umbelliferone (4-MU) sodium salt from Sigma-Aldrich and Opti CHO culture medium from Thermo Fisher Scientific. We measured I2S activity in SHP631 using a two-step plate-based method with fluorescence detection as described by Voznyi et al. (1) with slight modification. We initiated the first reaction catalyzed by SHP631 by mixing equal volumes of substrate solution and the diluted in-process sample; the substrate IdoA2S-4MU is hydrolyzed to 4-methyl-umbelliferyl-α-Lidopyranosiduronic acid (IdoA-4MU) and sulfate. In the second reaction, we achieved a complete conversion of IdoA-4MU to 4MU by adding excess amount of IDUA (Figure 1).
Routine Assay of SHP631 I2S Activity: The reaction is carried out in 96-well polymerase chain reaction (PCR) plates with a temperature controlled thermocycler. We initiated the reaction by mixing 20 μL each of 2 mM IdoA2S-4MU substrate solution and 5 ng/mL SHP631 sample solution in 2× assay buffer. That generated a 50 mM acetate-buffered reaction mixture, pH 5.2, containing 0.03 mg/mL of bovine serum albumin (BSA), which was incubated for one hour at 37 °C. We added 40 µL of 25 µg/mL IDUA in McIlvaine’s buffer (0.40 M sodium phosphate, 0.20 M citrate, 0.02 % sodium azide, pH 4.5) to arrest the I2S reaction.
The second-step reaction with IDUA was incubated for an additional hour at the same temperature. We quenched the second-step reaction by adding 200 µL of 0.5 M sodium carbonate solution, pH 10.7. Finally, we measured the observed fluorescence of 4-MU at λex and λem of 365 and 450 nm, respectively.
Buffers |
|---|
The following in-process buffers were tested for inhibition of SHP631 enzymatic activity. |
Buffer 1: [50 mM sodium citrate, pH 3.6 + 3-vol (2M Tris base)] (final pH 5.5) |
Buffer 2: 25 mM MES-Tris, 1.5 sodium chloride, pH 7.0 |
Buffer 3: SHP631 drug substance formulation buffer [20 mM sodium phosphate, 140 mM sodium chloride, pH 6.0] |
Buffer 4: OptiCHO medium (Thermo Fisher Scientific) |
Buffer 5: 25 mM Tris, 25 mM sodium chloride, 5 mM ethylenediaminetetraacetic acid (EDTA), pH 7.1 |
Buffer 6: 25 mM MES, 150 mM sodium chloride, pH 5.5 |
We modified the above assay as necessary to understand matrix interference. The “Buffers” box above lists buffers tested for the matrix effect in the study.

Equations
Determination of Km: We carried out the reaction in the same way as the routine assay with SHP631 sample, except the final substrate IdoA2S-4MU concentration was varied. The substrate solution was serially diluted before mixing with SHP631 to give concentrations of 31.25–2,000 µM in the final reaction mixture. We determined the Michaelis-Menten constant Km by fitting the dependence of the observed activity on substrate concentration [S] to the Michaelis-Menten equation (Equation 1).
Assay in the Presence of Buffer Matrix: To assess the buffer matrix effect, we mixed a fixed amount of SHP631 with different diluted in-process buffers. Exactly 10 µL each diluted buffer solution and substrate solution were mixed with 20 µL of enzyme solution in 2× assay buffer to start the first-step reaction. The assay proceeded as described in the “Routine Assay” section above. The final enzyme concentration in the reaction was 2.5 ng/mL.
Plots of enzyme specific activity (v/ [E]) — where v is rate of reaction and [E] is enzyme concentration — and inverse of dilution factor (1/DF) were fitted to the equation for rapid equilibrium mixed inhibition as per Equation 2 (2) using a value of Km = 386 µM determined from Michaelis–Menten analysis of SHP631 as described above. In Equation 2, [C/DF] is the apparent concentration of inhibitory components in the reactive mixture, Kis is the inhibition constant for inhibitor binding to the free enzyme, and Kii is the inhibition constant for inhibitor binding to the ES complex.
When the substrate concentration is fixed, parameters Kii and Kis become redundant. So the same fit curve can be obtained regardless of whether the inhibition is competitive, noncompetitive, uncompetitive, or mixed. Once we determined the necessary parameters from the fit, the same inhibition-free activity (v0/[E]) can be calculated using Equation 3, regardless of which inhibition modes are operating. In that equation, v0 is the catalytic rate in the absence of inhibitory component.
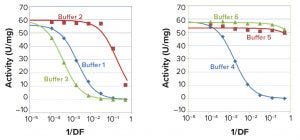
Figure 2: I2S activity of 2.5 ng/mL SHP 631 at different buffer concentrations
Simplification of the Data Treatment By Linearization of the Rate Equation 2: Inhibition-free activity also can be calculated using the linearized Equation 4, which can be simplified to Equation 5. Thus, activity in absence of inhibitors can be calculated after fitting data to the linear Equation 6. Note, however, that in simple linear fitting of the reciprocal plot, smaller values of v/[E] with larger random errors are heavily weighted and could distort results. Therefore care must be taken to prevent this by applying an appropriate weighting factor to data points or by simply omitting extremely low values from the fit.
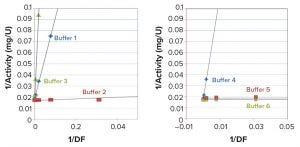
Figure 3: Least-squares fit to the linearized Equation 4
Results and Discussion
The I2S specific activity assay of SHP631 in-process samples are carried out routinely by diluting the samples to a target concentration of 2.5 ng/mL for activity measurement. However, we noticed that the measured specific activity for different in-process samples can depend on the concentration of the diluted sample used in the assay, with higher concentrations (lower dilution factors) of sample in the assay giving lower specific activity values. We performed further experiments to determine whether that effect is caused by inhibition by in-process sample buffer matrix as described below.
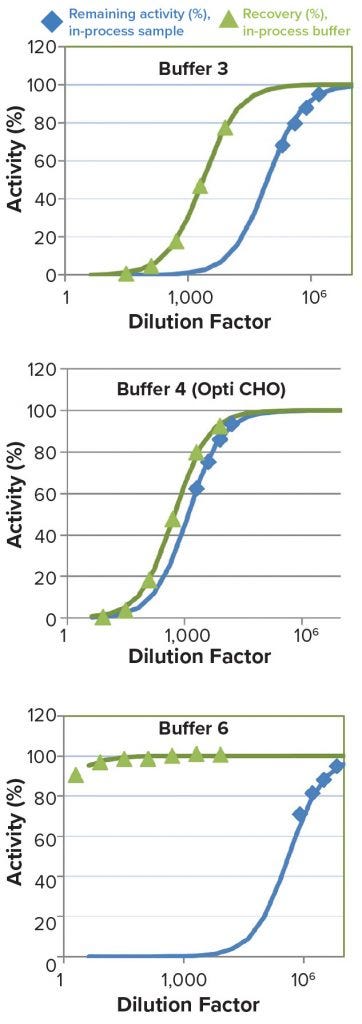
Figure 4: Examination of the dependence of observed specific activity on dilution of buffer matrix at constant enzyme concentration (green) or dilution of actual in-process sample (both E and buffer matrix are being diluted) (blue).
To assess the effect of buffer matrix on measured specific activity values, we carried out the assay with a fixed concentration of SHP631 in different concentrations of six in-process buffer solutions (Table 1a and 1b). Specific activity decreased at higher buffer concentration with buffers 1–4. Specific activity had a smaller decrease with buffers 5 and 6. Figure 2 shows the results.
Values of matrix-free activity (v0/[E]) and parameters (Kis/C, with Kii = ∞) can be determined from the fit of the plot of observed specific activity (v/[E]) and DF to Equation 4 for each in-process sample buffer (Table 1a). Once parameters from the nonlinear fit are known, matrix-free activity v0/[E] can be determined using data from a single concentration point using the same equation. Values of inhibition-free activity determined from single concentration points were consistent, regardless of dilution factor. The exception is the case of high inhibition (low specific activity), where relative random errors are larger. Matrix-free activity also can be determined by fitting data to the linearized Equation 5 if low activity values are omitted because of high random error (Figure 3). Calculated matrix-free activity values were comparable with those from nonlinear fit (Table 1a).
Experimental data for buffers 3, 4, and 6 were overlaid with results of corresponding real in-process sample serially diluted in water across the dilution range indicated in Figure 4. Results show that for buffers 3 and 6, inhibition is much stronger for real in-process samples than for buffer alone (constant [E]). Results indicate that observed inhibition in real samples in buffers 3 and 6 is not attributable to buffer-matrix alone.
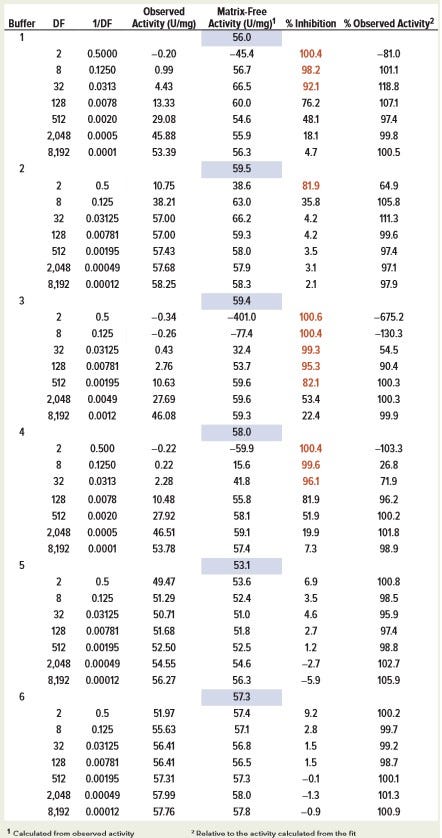
Table 1a: Calculated matrix-free activity (v0/[E]) of SH631 in different buffers by nonlinear fit of enzyme-specific activity measured at constant enzyme concentration (2.5 ng/mL) and varying in-process buffer concentration (C/DF); the values in blue-shaded boxes represent activity calculated from curve-fitting of all data points. Numbers in red represent %inhibition values >80%.
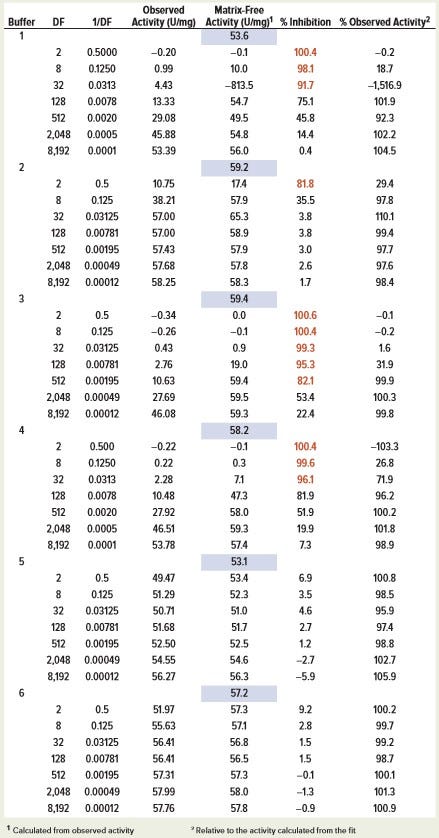
Table 1b: Calculated matrix-free activity (v0/[E]) of SH631 in different buffers by linear fit of enzyme-specific activity measured at constant enzyme concentration (2.5 ng/mL) and varying in-process buffer concentration (C/DF); the values in the blue-shaded box represent the activity calculated from the curve-fitting of all the data points. The numbers in red represent %inhibition values >80%.
Possible sources of additional inhibition observed in real in-process samples, beyond what is attributable to buffer matrix alone, are
Substrate depletion — more substrate is consumed at smaller DF (higher enzyme concentration), thereby reducing v/[E].
Product inhibition — at lower DF of in-process samples, enzyme concentration is higher, so more product is generated, which causes greater inhibition.
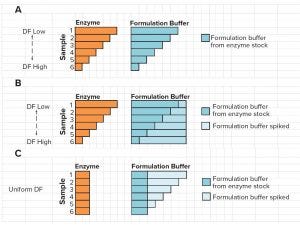
Figure 5: Representation of experiment with buffer 3 to separate the effects of matrix and enzyme concentration on measured specific activity; Set A = regular assay with serially diluted sample; Set B = sample set to assess the product inhibition (and possible substrate depeletion) effect; Set C = sample set to assess the matrix effect of in-process buffer.
To investigate further the source of inhibition effects, we created three sets of samples with Buffer 3 (SHP631 drug substance formulation buffer). Set A had varied enzyme and buffer concentrations. Set B had varied enzyme concentrations and a constant buffer concentration. Set C had a constant enzyme concentration and varied buffer concentrations (Figure 5).
Substrate depletion is unlikely to have caused the observed inhibition because the amount of substrate converted to product under conditions used in these studies was <6%, so substrate concentration [S] ≈ [S]initial (Figure 6).
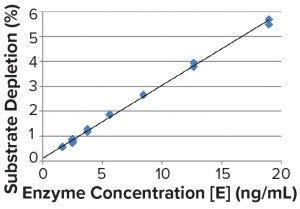
Figure 6: Substrate depletion in the experiment to separate the inhibition effects shown in Figure 5; depletion of the substrate was calculated from the detected concentration of 4MU and the initial concentration of the substrate.
Data from sample sets A (varied [E], varied [buffer]) and B (varied [E], constant [buffer]) indicate a stronger dependence of specific activity on concentration (proportional to 1/DF) than in set C (constant [E], varied [buffer]). Results in Figure 7 show that for samples in SHP631 drug substance formulation, buffer-matrix inhibition is not caused by matrix alone but probably can be attributed to product inhibition.
Our results indicate that both matrix and product can cause inhibition (decreased specific activity of SHP631 at lower sample dilution factor). For SHP631, we demonstrated that in some in-process sample types, product inhibition is the dominant source of inhibition observed. The relative importance of matrix and product inhibition is determined by the nature of the matrix and dilution factor used in the assay.
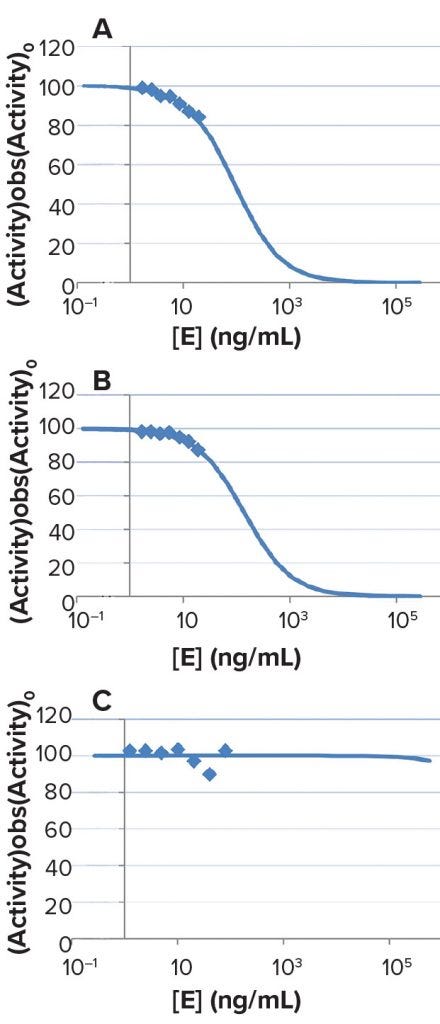
Figure 7: Results of experiments to measure SHP631 specific activity in DS formulation buffer matrix under three sets of conditions: (A) regular serial dilution, with varied [E] and varied [buffer]; (B) product inhibition, with varied [E] and constant [buffer]; and (C) matrix effect, with constant [E] and varied [buffer]
Proposal of Novel Method
Our study shows that the decreased specific activity at lower dilution factors of SHP631 in-process samples can be attributed to a combination of matrix inhibition and product inhibition. That was shown by performing separate experiments to demonstrate inhibition by matrix components (varying buffer matrix concentration and constant enzyme concentration) compared with inhibition by product (varying enzyme concentration and constant buffer matrix concentration).
Based on our study, we propose the following method to determine inhibition-free specific activity of in-process samples when enzyme concentration is sufficiently high and matrix effects are insignificant (e.g., when product inhibition is expected to be the dominant source of inhibition):
Determine dependence of specific activity on [E] using purified SHP631. Perform a linear fit of a plot of [E]/v and 1/DF to obtain slope (a from Equation 4).
Measure specific activity (v/[E]) of in-process sample at a single defined dilution factor.
Calculate inhibition-free specific activity (v0/[E]) using Equation 6 andthe slope a from the first step.
For in-process sample types in which the source of inhibition has not been identified, inhibition-free specific activity can be determined by assaying at different dilutions, plotting [E]/v and 1/DF and extrapolating to infinite dilution (1/DF = 0). That would allow for direct comparison of enzyme activity values across different in-process sample types.
Acknowledgments
This research was funded by Shire. All authors are employees of Shire and hold stock and/or stock options in Shire.
References
1 Voznyi YV, Keulemans JLM, van Diggelen OP. A Fluorimetric Enzyme Assay for the Diagnosis of MPS II (Hunter Disease). J. Inherit. Metab. Dis. 24(6) 2001: 675–680.
2 Segel IH. Enzyme Kinetics. John Wiley & Sons: New York, NY, 1975.
Corresponding author Takayuki Nakano is senior development specialist, Brenda Kellogg is senior scientist, and Kannappan VeeraRagavan is head of method development at Shire Pharmaceuticals, 300 Shire Way, Lexington, MA 02421; [email protected].
You May Also Like


