Validation of Controlled Freezing and Thawing Rates: A 16-L–Bag StudyValidation of Controlled Freezing and Thawing Rates: A 16-L–Bag Study
May 11, 2016
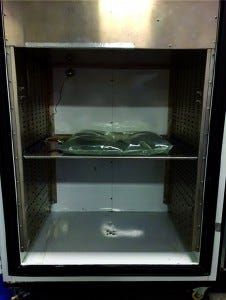
Photo 1: Standard one-bag position in chamber
It is well understood that freeze– thaw processes affect the product quality of biopharmaceuticals (1–3). It has been reported that there is no consistent method of controlled freezing and thawing rates for biological formulations (4). Traditionally, ultralow temperature storage chambers that were not designed for freezing have been used to provide an energy state for the environment surrounding the product with very little excess capacity to change the state of the product.
This study details a consistent method for controlled-rate freezing and thawing. It also includes the effect of load and container position on freeze rates. The freeze–thaw controlled-rate chamber used in this study was a model 4002 manufactured by Farrar Scientific. It permits rapid, uniform bulk freezing and/or thawing of products with temperature ranges from +40 °C to –80 °C. It has a minimum of 1.7 kW of net cooling and heating capacity over the entire temperature range and offers the flexibility of programmable profiles.
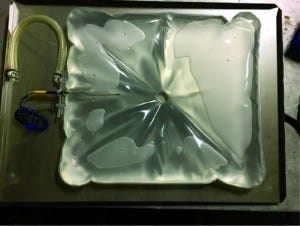
Photo 2: Thermocouple placement in bag
Experimental Procedure
We explored the effect of the program temperature profile on the rate of product freezing and thawing. Testing various temperature profiles helped determine the best profile for uniformly controlling the freezing rate to the first phase transition (0 °C) and the cooling rate from the first phase transition to –35 °C. The target product cooling rates from –5 °C to –35 °C were 0.13–0.94 °C/min. The target thaw rate was to be as fast as possible without overshooting a particular temperature.
Using tap water simulated a waterbased biological formulation. Bags with 16-L fill capacity were used in this study, with each bag placed on a stainless steel shelf. For Test 1, the bag was filled with 16 L of water and arranged to maximize air flow to the entire outer surface as uniformly as possible (Photo 1). A thermocouple was placed in the middle port with the tip located halfway between the bag midpoint (hole) and the edge (Photo 2). The end of the thermocouple is also equal distance from the upper to the lower bag surface (z direction). This is the expected last point to freeze.
Test 1 |
|---|
To meet the freezing requirements, the controlled-rate chamber was set up with the following program:Step 1: Timed event to –20 °C in 10 sStep 2: Wait for processStep 3: Soak bags for six hoursStep 4: Timed event to –40 °C in 10 sStep 5: Wait for processStep 6: Soak for 12 hoursStep 7: Timed event to –80 °C in 10 sStep 8: Wait for processStep 9: Soak for six hoursStep 10: Wait for event |
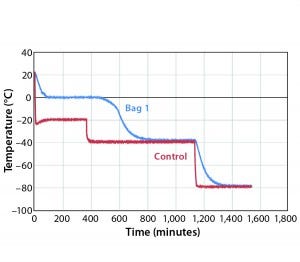
Figure 1: Controlled-rate freeze, Test 1 (one 16-L bag)
Controlled Freeze Rate Results and Discussion
Figure 1 shows results for controlled-freeze Test 1. Notice that it took 472 minutes to break from the phase change and 732 minutes to reach –35 °C. Table 1 shows cooling rates from –5 °C to –35 °C. The cooling rates are controlled at 0.08 °C/min to 0.30 °C/min. The cooling rate is at its slowest rate from –30 °C to –35 °C because the difference in air temperature (–40 °C) and product temperature is so small. Therefore, Test 2 was conducted where the second plateau
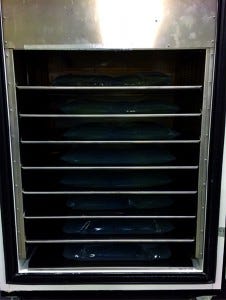
Photo 3: Standard eight-bag positions in chamber
temperature was changed from –40 °C to –50 °C (Figure 2). Table 2 shows those cooling rates, which fall within the target range of 0.13 °C/min to –0.94 °C/min throughout the entire temperature range from –5 °C to –35 °C.
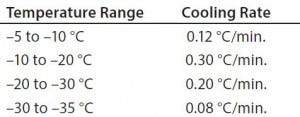
Table 1: Test 1 cooling rates
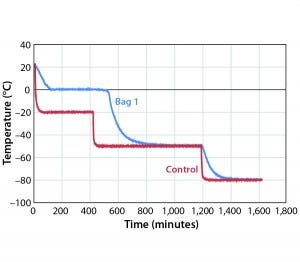
Figure 2: Controlled-rate freeze, Test 2 (one 16-L bag)
Because the correct temperature profile was determined with one bag, the next test (Test 3) used the same temperature profile with eight bags. For the eight–bag test, the bag’s positions were set to maximize air flow to the surface of all bags as uniformly as possible (Photo 3). The bags were numbered one to eight in consecutive order from top (Bag 1) to bottom (Bag 8).
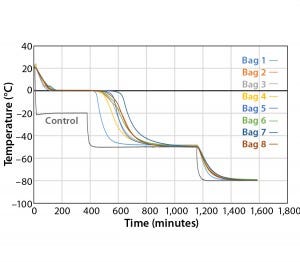
Figure 3: Controlled-rate freeze, Test 3 (eight 16-L bags)
Figure 3 and Table 3 show the cooling rates of each bag. The eight bags break from the phase change in the range of 429 to 555 minutes. The one 16-L bag (Test 2) broke from the phase change at 499 minutes — within the range of the eight bags. This shows that the freezing rate is independent of product load. The cooling rate from 5 °C to 35 °C ranged from 0.13 °C/min to 0.73 °C/min. All bags had cooling rates within the target range. These results show that the cooling rate is not dependent on bag position in the chamber or load.
The top bag (Bag 1) was the fastest to break from the phase transition and the fastest to cool from –5 °C to –35 °C.
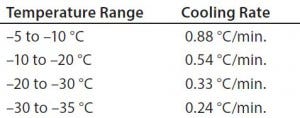
Table 2: Test 2 cooling rates
This is to be expected because the air flow enters the chamber from the top left corner and flows down and out of the left duct toward the right side. What we did not expect was that the bottom bag was not the slowest to break from the phase transition. Bag 7 was the slowest to break from the phase transition. Even though the bottom bag has very little air flow underneath it, it apparently has a higher velocity air flow in contact with the top side of the bag compared that of Bag 7. Bag 2 had the slowest cooling rate from –5 °C to –35 °C even though it was the second to break from the phase transition. It appeared that the other bags that were still warmer slowed Bag 2’s cooling rate until they also reached a lower temperature.

Table 3: Test 3 bag cooling rates

Table 4: Test 4 bag cooling rates
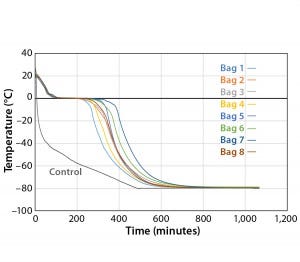
Figure 4: Controlled-rate freeze, Test 4 (eight 16-L bags)
To determine whether the cooling rates could be increased without exceeding the maximum (0.9 °C/min) target, Test 4 decreased the temperature as quickly as possible (to –80 °C in 10 seconds). Figure 4 and Table 4 show those cooling-rate results. All bags had cooling rates from –5 °C to –35 °C that were in the target range (0.13–0.94 °C/min). These results show again that the cooling rates were controlled to the desired target range independent of bag position in the chamber. In addition, the temperature at which each bag breaks from the phase transition ranges from 209 minutes (Bag 2) to 291 minutes (Bag 7). These results also show that freezing rates were controlled to a reasonable level.
Test 5 |
|---|
Step 1: Timed event to –15 °C in 10 sStep 2: Wait for processStep 3: Soak bags for eight hoursStep 4: Timed event to –56 °C in 10 sStep 5: Wait for processStep 6: Timed event to –80 °C in four hours and 26 minutesStep 7: Wait for processStep 8: Soak for 11 hStep 9: Wait for event |
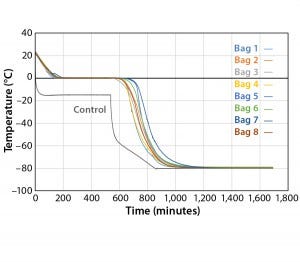
Figure 5: Controlled-rate freeze, Test 5 (eight 16-L bags)
Another test was conducted (Test 5) to extend the time before bags break from the phase transition. The temperature profile had a plateau at –15 °C for eight hours before plunging to –80 °C. Figure 5 and Table 5 show Test 5 controlled-cooling results. The temperature at which each bag breaks from the phase-transition ranges from 562 minutes (Bag 3) to 652 minutes (Bag 7). It took 353 more minutes for the first bag to break from the phase transition and 361 more minutes for the last bag to break from the phase transition compared to the results of Test 4. The cooling rate for all bags from –5 °C to –35 °C were again within the target range.

Table 5: Test 5 bag cooling rates
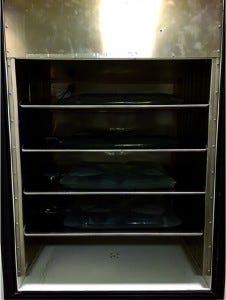
Photo 4: Standard four-bag positions in chamber
Because the correct temperature profile was determined with eight bags, Test 6 used the same temperature profile with four bags. For this test, bags were arranged to maximize air flow to the surface of all bags as uniformly as possible (Photo 4). The bags were numbered one–four in consecutive order from top (Bag 1) to bottom (Bag 4). The temperature profile was programmed to match the actual temperature profile of Test 5 (see box above).

Table 6: Test 6 bag cooling rates
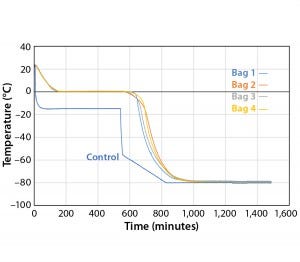
Figure 6: Controlled-rate freeze, Test 6 (four 16-L bags)
Figure 6 and Table 6 show the cooling rates of each bag in Test 6. The temperature at which each bag breaks from the phase transition ranges from 575 minutes (Bag 2) to 618 minutes (Bag 1). This is within the range reported in Test 5. This again shows that the freezing rate is independent of product load. In addition, all bags had cooling rates from –5 °C to –35 °C within the target range. These results show that the cooling rate was not dependent on bag position in the chamber or load.
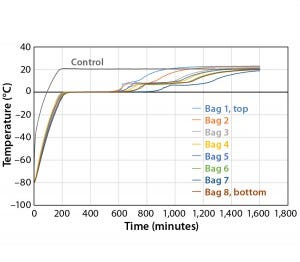
Figure 7: Controlled-rate thaw, Test 7 (eight 16-L bags)
Controlled Thaw Rate Results and Discussion
Fast thaw rates are advised for preventing damage to biological formulations (1). However, most biological formulations are temperature sensitive. This study shows how the maximum temperature of the product as well as controlled-thaw rates could be controlled. The thaw test temperature profile starts with product temperatures at –80 °C and ramps up to +20 °C as quickly as possible. For the purpose of this study, the time it took for each bag to reach +2 °C is recorded as the thaw time. Figure 7 details Test 7 thaw results in which the eight bags reached +2 °C in the range of 599 minutes (Bag 2) to 890 minutes (Bag 7). As was the case with the slower freezing of Bag 7, its position in the chamber provides for the least amount of air flow. Seven out of the eight bags show tight thaw-rate control with only 124 minutes separating the first bag from the seventh bag to thaw.
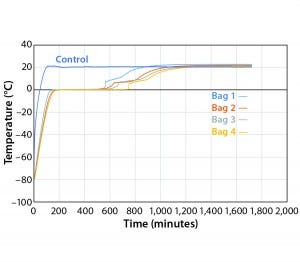
Figure 8: Controlled-rate thaw Test 8 (four 16-L bags)
To test the effect of load, thaw Test 8 was conducted with the same conditions using four bags (Figure 8). They reached +2 °C in the range of 557 minutes (Bag 1) to 749 minutes (Bag 4). Only Bags 1 and 2 thawed a little faster than any of the eight bags in Test 7. However, this is still a relatively good thaw-rate control regardless of load. In addition, the thaw rate was controlled independent of the bag position in the chamber.
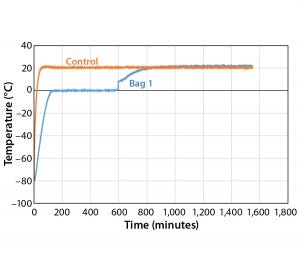
Figure 9: Controlled-rate thaw, Test 9 (one 16-L bag
To further test the effect of load, thaw Test 9 used the same conditions with one bag (Figure 9). The bag reached +2 °C in 597 minutes, which is within the range of all 4 bags in Test 8. This shows that thaw rate was controlled independent of load.
Freezing and Thawing Biological Formulations
A method was successfully developed to control the desired freezing and thawing rate using a controlled–rate freeze–thaw chamber. It was validated with different loads (one, four, and eight bags) and product positions in the chamber. A program was developed that a client can use to reliably and uniformly bulk freeze and thaw its biological formulation.
References
1 Cao E, et al. Effect of Freezing and Thawing Rates on Denaturation of Proteins in Aqueous Solutions. Biotechnol. Bioeng. 82(6) 2003: 684–690.
2 Radmanovic N, et al. Understanding the Freezing of Biopharmaceuticals: First-Principle Modeling of the Process and Evaluation of Its Effect on Product Quality. J. Pharma. Sci. 102(8) 2013: 2495–2507.
3 Reinsch H, et al. Examining the Freezing Process of an Intermediate Bulk Containing an Industrially Relevant Protein. Enzyme Microb. Tech. 71(4) 2015: 13-19.
4 Puri M, et al. Evaluating Freeze–Thaw Processes in Biopharmaceutical Development: Small–Scale Study Designs. BioProcess Int. 2015: 1–16.
Jerry King is a senior scientist at Farrar Scientific, 30765 State Route 7, Marietta, OH 45750; [email protected], 1-740-374-8300.
You May Also Like

