Improved Fluorescent Labeling Efficiency of N-Linked, High-Mannose Oligosaccharides: Using 8-Aminopyrene-1,3,6-Trisulfonic Acid (APTS) for Analysis of GlycoproteinsImproved Fluorescent Labeling Efficiency of N-Linked, High-Mannose Oligosaccharides: Using 8-Aminopyrene-1,3,6-Trisulfonic Acid (APTS) for Analysis of Glycoproteins

WWW.PHOTOS.COM
Glycosylation of proteins, including monoclonal antibodies (MAbs), is recognized as important for the efficacy, immunogenicity, antibody-dependent cell-mediated cytotoxicity (ADCC), and complement-dependent cytotoxicity (CDC) of biotherapeutics (1–6). So research and development of protein candidates is increasingly focused on the effects of glycosylation and how its pathway is affected in the Golgi system of cells involved in biosynthetic processes (7). Such attention on glycosylation has helped advance analytical technologies such as high-pH anion-exchange chromatography (HPAEC) (8); normal-phase chromatography (NP- HPLC), hydrophilic-interaction chromatography (HILIC) (9), and reversed-phase chromatography (RP-HPLC) (10–13); capillary electrophoresis (CE) (14–19); and microfluidics (20–21). Often those are coupled with sensitive detection methods such as fluorescence and laser-induced fluorescence using a number of labeling dyes for profiling N-linked glycosylation.
During MAb drug development, N-linked glycosylation on the antibodies’ heavy chains is a major focus. Typically, each heavy chain has a single glycosylation site at an asparagine contained within a consensus site (22). The nature of the glycan species attached at that site may have biological effects, such as in relation to drug-clearance pharmacokinetics (PK) (23), ADCC (1–6), and CDC (1–6). So the overall glycan profiles and percentages of each glycan species are monitored during early and later-stage process development of glycoprotein products.
A glycoprotein’s N-linked glycan profile is traditionally determined by releasing glycans from the protein through enzymatic treatment with an exoglycosidase such as PNGase F. The released glycan solutions are then subjected to processing steps that may include protein removal, derivatization, concentration, and buffer exchange. Analysis may be performed using HPAEC, NP-HPLC, RP-HPLC, HILIC, and/ or capillary zone electrophoresis and laser-induced fluorescence (CZE-LIF) with detection most commonly achieved by derivatizing the reducing end of each oligosaccharide with a fluorescent label. Popular dyes include 2-aminobenzamide (2-AB) (8, 10), 2-aminopyridine (2-AP) (24), 2-aminobenzoic acid (2-AA) (9, 13), and APTS (14–19). Each option has advantages and disadvantages regarding throughput, sensitivity, and cost of goods. When considering cost effectiveness during process development in terms of both labor and reagents, along with the need for high-throughput capability, CZE-LIF with APTS labeling offers clear advantages (14–19). The technique is highly sensitive because it uses LIF detection, whereas other labeling chemistries — using 2-AB, 2-AA, or 2-AP — are typically detected by a conventional fluorescent detector. LIF detectors are generally hundreds of times more sensitive than regular fluorescent detectors. CZE-LIF method is a high-throughput method because it requires no removal of excess APTS. Total hands-on sample preparation time is significantly reduced to <1.5 hours, and an assay can be complete in one day.
Sample preparation typically begins with enzymatic removal of N-linked glycans from the polypeptide backbone of antibodies, which is followed by derivatization with APTS using heat at the reducing end of the sugar. The APTS label was first introduced for glycan analysis and CZE profiling in the 1980s (14–15). Numerous advancements in the past 30 years have improved not only separation of the glycan species, but also the ease with which those species can be characterized. Analytical tools allow for matrix-assisted, laser-desorption ionization (MALDI) analysis (16) and direct coupling of CZE glycan separation with mass spectrometry for online detection (25–27).
Despite those advances in detection and characterization technologies, sample preparation is the critical aspect (14, 28–31). Theoretically, a single APTS molecule is attached to each oligosaccharide molecule, thus enabling a quantitative approach to analysis. The underlying assumption is that labeling efficiency is identical for all oligosaccharides (32). However, the released bianternary complex N-glycans are heterogeneous. Recently we found that, using previously reported APTS labeling conditions are used (14, 28–32), the labeling efficiency of oligomannose 5 (Man5) and other high-mannose species deviates from that of the other major glycans.
High-mannose, N-linked oligosaccharides are parts of the biosynthesis pathway in the Golgi system (7). Recent reports suggest that high mannose may enhance FcγRIIIa binding and improve ADCC activity (1–6) and affect drug PK (23). In addition, the distribution of high- mannose species and overall glycan profiles are indications of process consistency. Therefore, equal labeling efficiency is important for all glycan profiling methods. Here, we report on labeling parameters that affect labeling efficiency for high-mannose proteins, and we describe conditions in which equal APTS labeling efficiency is achieved for high-mannose and complex glycans in MAbs.
Materials and Methods
Materials: We purchased PNGase F from New England Biolabs and specialty chemicals (sodium cyanoborohydride 1M in tetrahydrofuran, hydroxypropyl- methylcellulose, glacial acetic acid, lithium hydroxide, e-aminocaproic acid, and RNase B) from Sigma Aldrich. The fluorescent labeling dye, 8-aminopyrene-1, 3, 6-trisulfonic acid (APTS), an LIF calibration performance test mixture, and coated polyvinyl alcohol (PVA) capillaries came from Beckman Coulter. (MicroSolves Technology Corp. can supply alternative PVA-coated capillaries.) Glycan standards for A2G0F; asialo-, agalacto-, bi-antennary, and core substituted with fucose; oligomannose 5 (Man5), and oligomannose 9 (Man9) came from Glyco Inc. We purchased a fluorescent 2-aminobenzamide (AB) labeling reagent from Prozyme Inc.
Recombinant MAbs were produced by Chinese hamster ovary (CHO) cells and purified at Amgen in Washington and California. After several chromatographic steps, MAbs were formulated at 30 mg/mL in a pH 5 buffer (stored at under –20 °C).
Equipment: We bought a Proteome Lab PA 800 capillary electrophoresis system with LIF detection, 32 Karat software (version 7.0), and a capillary cartridge from Beckman Coulter. And we used a Waters UPLC system equipped with a fluorescence detector and a 4.0 × 250 mm, 3-µm particle size Thermo Electron Hypersil ODS (C18) column, (P/N 30103-254030) for reversed-phase (RP)-HPLC separations.
CZE-LIF Oligomapping Procedure Using APTS: We treated a 120-µg aliquot of MAb with 2 µL of PNGase F in a digestion buffer (PBS pH7.5) to a final volume of 30 µL and a final pH of ~7.5 with a 1× PBS buffer-salt concentration. After incubating the mixture at 37 °C for two hours, we purified the released N-glycans using ethanol precipitation: Briefly, the mixture is diluted at a ratio of 1:3 with ice-cold ethanol (e.g., for 100 µL digested mixture, add 300 µL cold ethanol) to remove proteins/MAbs. Then, the supernatant is dried at 35 °C in a vacuum desiccator. Typically, a clear or slightly opaque spot is then visible on the bottom of each tube.
We mixed dried glycans with different amounts of acidic APTS labeling solution (5 mg of APTS in 48 µL of 15% acetic acid) and 2 µL of 1 M sodium cyanoborohydride, then heated the solutions at different temperatures. Afterward, we used water to bring each solution to 100 µL to quench the reaction mixture. Our “Results” section below includes a detailed examination of these labeling reaction parameters.
After diluting a 20-µL aliquot of labeled glycan solution with 80 µL of water (1:5 ratio), we separated it by CZE: A PVA neutral capillary was filled with running buffer of 30 mM EACA and 0.25% HPMC at pH 4.2; the capillary was flushed with that running buffer before each sample injection for two minutes at 50 psi. We kept capillary and sample temperatures at 10 °C and 20 °C, respectively. Injection time was 10 seconds at 0.5 psi. Finally, a reversed polarity of 16.8 kV was applied to the capillary for 17 minutes to separate all APTS-labeled glycans. LIF detected the migrated glycan species at an excitation of 488 nm and an emission of 520 nm.
RP-HPLC Oligomapping Procedure Using 2-AB: After glycans were released, we labeled them with 2-AB, then removed excess 2-AB before drying and reconstituting the free glycans according to Prozyme protocols. We loaded a 20-µg aliquot of 2-AB–labeled glycan solution for separation by RP-HPLC in a 40 °C column at a 10-µL injection volume. Mobile phase A was 0.1% acetic acid in water, and mobile phase B contained 0.1% acetic acid and 10% acetonitrile in water. The separation used a flow rate of 0.2 mL/minute and a gradient of 70% to 30% over 140 minutes, followed by clean-up and reequilibration of the column, in a total run time of 170 minutes. We monitored the migrated glycan species using a fluorescence detector at excitation of 330 nm and emission of 420 nm.
Results and Discussion
Comparing APTS Labeled CZE-LIF and 2-AB Labeled RP-HPLC: With the shortened CE analysis time and no need for clean-up, the APTS-labeled CZE-LIF method is useful for routine monitoring of glycan species. With increasing visibility of high-mannose glycan species in drug development, companies need to quantify those glycans and the overall glycan profiles of such products. Doing so requires comparing CZE-LIF results with those of previous orthogonal HPLC methods such as RP-HPLC.
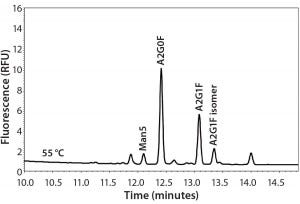
Experimental results for the major glycan species are comparable among all those techniques. However, the minor species (especially the high- mannose type) of glycans appear lower in the APTS-labeled CZE method than with the 2-AB labeled RP-HPLC method. Analyzing three MAb samples by two methods side by side suggested that the percentages of high- mannose glycans are underestimated by CZE-LIF analysis for such molecules. Mammalian cells do not typically express proteins with high percentages of high-mannose species. So a 2–4% variation between these analytical methods may be significant when measuring high mannose levels. Therefore, an extensive study was needed before implementing the APTS CZE-LIF glycan method. Figure 1 shows a typical MAb glycan profile electropherogram.

Figure 1: Typical electropherogram of a MAb glycan profile labeled with APTS and separated by CZE-LIF
Because the LIF detection technology is unlikely to be the cause of underreported low-level species, we focused our investigation on the labeling reaction. In both techniques, glycans are released from 120 µg of MAb, then derivatized with either 2-AB or APTS. The major differences between the techniques are labeling temperatures and chemicals. The labeling temperature for 2-AB is 65 °C, whereas 55 °C is a typical labeling temperature for APTS.

Table 1: Percentage of Man5 from CZE-LIF at three different labeling temperatures.
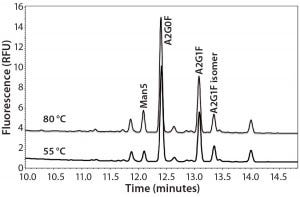
Labeling Temperature Effect on Man5 Percentage: We assessed the effects of labeling temperature by preparing released and dried glycans from three MAbs by adding 2 µL of APTS acidic solution (acidified by acetic acid) and 2 µL of 1 M sodium cyanoborohydride heated at 55 °C, 65 °C, or 80 °C for 120 minutes. We kept the other experimental conditions the same as described in the “Materials” section above. Table 1 displays integrated percentages of Man5 from those experiments, and Figure 2 shows the related electropherograms.

Figure 2: Overlay of MAb glycan profiles labeled at 55 °C and 80 °C
We observed a 2–3% increase in % Man5 from overall glycan profiles when the labeling temperature was elevated from 55 °C to 80 °C for three molecules. A 42.4% relative increase in labeling efficiency was achieved in total Man5 labeled, which suggests that higher temperature improves Man5 labeling efficiency.
Labeling Temperature Effect on Glycan Standards: We concluded that the labeling temperature affects the apparent percentage of Man5, which suggests possible differential labeling between high-mannose type and the major glycans, with higher temperature favoring the high-mannose reaction with APTS. Interpretation of the data from the released glycans can be difficult because there are so many glycan peaks. So we used glycan standards for this study.
We added a 30-µL aliquot of water to each vial containing 10 µg of glycan standards. Two glycan standard mixtures were made separately by aliquotting 5 µL of Man5 with 5 µL of A2G0F to one vial, and 5 µL of Man9 with 5 µL of A2G0F to another. One mixture contained 50% of Man5 and A2G0F; the other mixture contained 50% of Man9 and A2G0F. We then reacted those glycan mixtures with APTS separately at 55 °C or 80 °C for 120 minutes and analyzed the results with CZE-LIF.

Table 2: Effects of labeling temperature on APTS labeling efficiency on glycan standards
Table 2 lists measured percentages of Man5, Man9, and A2G0F. For the combination of Man5 and A2G0F standards, the percentage of Man5 increased from 23.4% to 36.8% when the labeling temperature increased from 55 °C and 80 °C. Conversely, the % A2G0F decreased from 63.6% to 50.9%. Similarly, when the Man9 standard was blended with A2G0F, Man9 increased from 32.2% to 45.6%, whereas A2G0F decreased from 58.2% to 45.9%. Both samples theoretically have equal parts of the high-mannose form and the A2G0F. The experimentally determined percentage of Man5 form is lower than that of A2G0F even at 80 °C, which could be due to a lower-than-expected concentration of Man5 in the original vial. However, Man5 and Man9 increased by 13.0% for both blends at elevated temperature, which suggests that labeling efficiency for Man5 and Man9 exhibit the similar rate. Overall, these results demonstrate that the labeling efficiencies for the high- mannose species themselves are equivalent at 80 °C.
Labeling Temperature Effects on Different High-Mannose Species: To answer directly the question of whether APTS equally labels the high-mannose family (including Man5–9), we used a high-mannose– only glycoprotein, RNase B(33–34), in our study. The N-linked high- mannose species — predominantly Man5 and Man6 — were released and labeled by APTS, then analyzed by CZE-LIF. The Man5 and Man6 percentages are about 57.5% and 42.5%, respectively, and do not change at different temperatures. This again suggests that Man5 and Man6 react with APTS at similar rates.
Up to this point, we have studied and reported the relative labeling efficiency of high-mannose species. But the absolute fluorescence intensity of glycans was neither discussed nor disclosed. With LIF detection, the relative fluorescence unit (RFU) is recorded and graphed as the y-axis against time. Each time a new capillary cartridge is inserted, the LIF detector is calibrated by flushing a fluorescein/ water solution through it. Because of the physical positioning of the capillary to the detection window, the RFU is not always the same even after each calibration. Therefore, our experiments were based on the RFU from the same- day analysis for direct comparison.
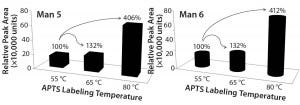
Figure 3 plots Man5 and Man6 peak areas from the RNAase B experiment against the labeling conditions. We observed a total increase of 306% and 312% in intensity Man5 and Man6, respectively, when labeling temperature was elevated from 55 °C to 80 °C. In combination with the data from Table 2 regarding changes in the percentages of Man5 and A2G0F and of Man9 and A2G0F, we can conclude that APTS labels the high-mannose family with equal efficiency.

Figure 3: Significant effect of temperature on labeling high mannose: (left) Man5 and (right) Man6
Better Results, Better Characterization
We have demonstrated that APTS reaction efficiency is not always equal for glycans such as A2G0F and high-mannose species. The result of such differential labeling efficiency is that the percentages of high-mannose species are underreported at certain reaction conditions, which can be minimized by temperature elevation. We have shown that raising the temperature from 55 °C to 80 °C can increase the labeling efficiency of Man5 by 42.4%. In addition, the overall peak areas of labeled high-mannose glycans are significantly increased. However, no differential labeling seems to occur within the high-mannose species. What’s more important to know is that if the labeling temperature is properly maintained, the glycan profiles of regular glycans and high-mannose species obtained from APTS will be representative for these MAbs.
Acknowledgments
We thank Melissa Schwartz, Xinfeng Zhang, Amy Guo, Jennifer Liu, Bob Bailey, and Mike Treuheit for critical feedback and constant support.
References
1 Goochee CF, et al. The Oligosaccharides of Glycoproteins: Bioprocess Factors Affecting Oligosaccharide Structure and Their Effect on Glycoprotein Properties. Nature Biotechnol. 9(12) 1991: 1347–1355.
2 Jefferis R. Glycosylation As a Strategy to Improve Antibody-Based Therapeutics. Nature Rev. Drug Discov. 8, 2009: 226–234.
3 Walsh G. Biopharmaceutical Benchmarks 2010. Nature Biotechnol. 28, 2010: 917–924.
4 Marino K, et al. A Systematic Approach to Protein Glycosylation Analysis: A Path Through the Maze. Nature Chem. Biol. 6(10) 2010: 713–723.
5 Jiang X, et al. Advances in the Assessment and Control of the Effector Functions of Therapeutic Antibodies. Nature Rev. Drug Discov. 10, 2011: 101—111.
6 Putnam WS, et al. Pharmacokinetic, Pharmacodynamic and Immunogenicity Comparability Assessment Strategies for Monoclonal Antibodies. Trends Biotechnol. 28(10) 2010: 509–516.
7 Varki A, et al. Essentials of Glycobiology. Cold Spring Harbor Laboratory Press: New York, NY, 1999.
8 Routier FH, et al. Quantitation of the Oligosaccharides of Human Serum IgG from Patients with Rheumatoid Arthritis: A Critical Evaluation of Different Methods. J. Immuno. Meth. 213(2) 1998: 113–130.
9 Ruhaak RL, et al. Hydrophilic Interaction Chromatography-Based High-Throughput Sample Preparation Method for N-Glycan Analysis from Total Human Plasma Glycoproteins. Anal. Chem. 80(15) 2008: 6119–6126.
10 Chen X, Flynn GC. Analysis of N-Glycans from Recombinant Immunoglobulin G By On-Line Reversed-Phase High-Performance Liquid Chromatography/Mass Spectrometry. Analyt. Biochem. 2007, 370(2) 2007: 147–161.
11 Saba JA, et al. Investigation of Different Combinations of Derivatization, Separation Methods and Electrospray Ionization Mass Spectrometry for Standard Oligosaccharides and Glycans from Ovalbumin. Mass. Spectrom. 36(5) 2001: 563–574.
12 Takegawa Y, et al. Simultaneous Analysis of 2-Aminopyridine-Derivatized Neutral and Sialylated Oligosaccharides from Human Serum in the Negative-Ion Trap Mass Spectrometry. Anal. Chem. 2005, 77, 2097-2106.
13 Prien JM, et al. Mass Spectrometric- Based Stable Isotopic 2-Aminobenzoic Acid Glycan Mapping for Rapid Glycan Screening of Biotherapeutics. Anal. Chem. 82(4) 2010: 1498–1508.
14 Evangelista RA, Liu M, Chen FA. Characterization of 9-Aminopyrene-1,4,6- Trisulfonate-Derivatized Sugars By Capillary Electrophoresis with Laser-Induced Fluorescence Detection. Anal. Chem. 67, 1995: 2239–2245.
15 Guttman A. High-Resolution Carbohydrate Profiling By Capillary Gel Electrophoresis. Nature 380, April 1996: 461–462.
16 Suzuki H, et al. Analysis of 1-Aminopyrene-3,6,8-Trisulfonate-Derivatized Oligosaccharides By Capillary Electrophoresis with Matrix-Assisted Laser Desorption/ Ionization Time-of-Flight Mass Spectrometry. Anal. Chem. 69, 1997: 4554–4559.
17 Ma S, Nashabeh W. Carbohydrate Analysis of a Chimeric Recombinant Monoclonal Antibody By Capillary Electrophoresis with Laser-Induced Fluorescence Detection. Anal. Chem. 71, 1999: 5185–5192.
18 Raju TS, Briggs JB, Borge SM. Species- Specific Variation in Glycosylation of IgG: Evidence for the Species-Specific Sialylation and Branch-Specific Galactosylation and Importance for Engineering Recombinant Glycoprotein Therapeutics. Glycobiol. 10(5) 2000: 477–486.
19 Gennaro LA, Salas-Solano O. On-Line CE-LIF-MS Technology for the Direct Characterization of N-Linked Glycans from Therapeutic Antibodies. Anal. Chem. 80, 2008: 3838–3845.
20 Briggs JB, et al. An Analytical System for the Characterization of Highly Heterogeneous Mixtures of N-Linked Oligosaccharides. Analyt. Biochem. 389(1) 2009: 40–51.
21 Primack J, Flynn GC, Hai P. A High- Throughput Microchip-Based Glycan Screening Assay for Antibody Cell Culture Samples. Electrophoresis 32, 2011: 1129–1132.
22 Hossler P, Khattak SF, Li Z. Optimal and Consistent Protein Glycosylation in Mammalian Cell Culture. Glycobiol. 19(9) 2009: 936–949.
23 Goetze AM, et al. High-Mannose Glycans on the Fc Region of Therapeutic IgG Antibodies Increase Serum Clearance in Humans. Glycobiol. 21(7) 2011: 949–959.
24 Fan JQ, Huynh LH, Lee YC. Purification of 2-Aminopyridine Derivatives of Oligosaccharides and Related Compounds By Cation-Exchange Chromatography. Analyt. Biochem. 232, 1995: 65–68.
25 Mechref Y, Novotny MV. Glycomics and Gycoproteomics By Capillary Electrophoresis-Mass Spectrometry. Mass Spec. Rev. 28, 2009: 207–222.
26 Kabel MA, et al. Capillary Electrophoresis Fingerprinting, Quantification and Mass-Identification of Various 9-Aminopyrene-1,4,6-Trisulfonate-Derivatized Oligomers Derived from Plant Polysaccharides. J. Chromatogr. A 1137(1) 2006: 119–126.
27 Mittermayr S, Bones J, Guttman A. Unraveling the Glyco-Puzzle: Glycan Structure Identification By Capillary Electrophoresis. Anal. Chem. 85, 2013: 4228–4238.
28 Evangelista RA, Guttman A, Chen FT. Acid-Catalyzed Reductive Amination of Aldoses with 8-Aminopyrene-1,3,6- Trisulfonate. Electrophoresis 17(2) 1996: 347–351.
29 Chen FT, Evangelista RA. Profiling Glycoprotein N-Linked Oligosaccharide By Capillary Electrophoresis. Electrophoresis 19, 1998: 2639–2644.
30 Chen FT, Dobashi TS, Evangelista RA. Quantitative Analysis of Sugar Constituents of Glycoproteins By Capillary Electrophoresis. Glycobiol. 8, 1998: 1045–1052.
31 Szabo Z, et al. Improved Sample Preparation Method for Glycan Analysis of Glycoproteins By CE-LIF and CE-MS. Electrophoresis 31(8) 2010: 1389–1395.
32 Guttman A, et al. High-Resolution Capillary Gel Electrophoresis of Reducing Oligosaccharides Labeled with 1-Aminopyrene-3,6,8-Trisulfonate. Analyt. Biochem. 233(2) 1996: 234–242.
33 Guttman A, Pritchett T. Capillary Gel Electrophoresis Separation of High-Mannose Type Oligosaccharides Derivatized By 1-Aminopyrene-3,6,8-Trisulfonic Acid. Electrophoresis 16(1) 1996: 1906–1911.
34 Guttman A, Herrick S. Effect of the Quantity and Linkage Position of Mannose (Alpha 1,2) Residues in Capillary Gel Electrophoresis of High-Mannose-Type Oligosaccharides. Analyt. Biochem. 235(2) 1996: 236–239.
Corresponding author Yuling Zhang is a senior scientist, Philip Campbell is a senior associate scientist, Ashley Bell was an associate scientist (now an associate scientist II at ZymoGenetics), and Weichun Wang is a scientific director, in process and product development at Amgen Inc., 1201 Amgen Court West, Seattle, WA 98119; 1-206-265-8664, fax 1-206-217-5529; [email protected], yulingzhang@ chemalum.berkeley.edu. Robert Hong is a senior associate scientist, and Katariina M. Hutterer is a senior scientist in analytical sciences at Amgen Inc., Amgen Drive One, Thousand Oaks, CA 91320, USA.
You May Also Like


