Reducing Variability in Cell-Specific Productivity in Perfusion Culture: A Case StudyReducing Variability in Cell-Specific Productivity in Perfusion Culture: A Case Study
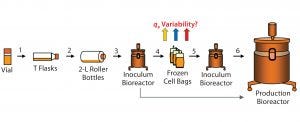
Figure 1A: Flow schematic of the cell expansion process; see text for details regarding process steps (numbered 1–6). Colored (upward-pointing) arrows indicate location (between steps 4 and 5) where variability in qP was observed.
Variation in bioproduction is recognized in the industry and often attributed to one or more of four sources: raw materials (including consumables), operational inputs (measurements, methods, personnel, equipment), environmental factors, and biological variation inherent to living cells (1). Variability can occur even among replicate units regardless of production mode (e.g., fed-batch or perfusion), and it can manifest as variability in productivity, cell metabolism, and/or product quality (2–4).
In commercial biomanufacturing, meeting all product quality attributes is a requirement for regulatory compliance as well as for safe and effective patient treatment. However, a robust and well-controlled production process also must yield consistent titers.
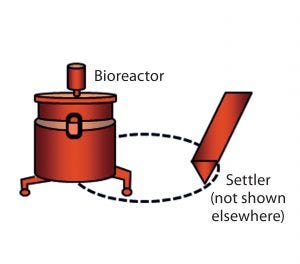
Figure 1B: Setup of bioreactor and settler (cell retention device) and the recirculation loop (stippled) in perfusion cell culture; because of space limitations, the settler is not included in Figures 2, 3, and 5–7, but it (with its ancillary equipment) is an integral part of the perfusion system used in this work and thus is represented by the bioreactor icon.
Production of complex, labile proteins such as recombinant factor VIII (rFVIII) often calls for use of perfusion as the culture-mode of choice because continuous harvest facilitates product stabilization. In a perfusion cell culture process such as the one we use, productivity/titer can be influenced by differences in cell density or cell-specific perfusion rate (CSPR). Thus it is important to measure variability in productivity performance as cell-specific productivity (qP), which incorporates all three factors (titer, cell density, and CSPR). A perfusion system is distinct from other culture systems in that it consists of not only a bioreactor, but also a cell retention device such as the settler we use (Figure 1B) that retains cell biomass in the bioreactor as product is harvested continuously. In modern continuous cell culture processes, perfusion bioreactor systems also maintain constant cell density. As described below, however, initial process expansion steps usually do not operate in continuous mode.
Cell expansion (Figure 1A) always uses the same cell source (the master cell bank) and follows the same process, so why would specific productivity vary? The process begins with thawing a vial from the master or working cell bank and inoculating a T-flask (step 1). Upon meeting certain inoculation criteria (such as a minimum percent viable cell density, %VCD), cells are expanded further and transferred into roller bottles (step 2) followed by an inoculum bioreactor (step 3).
The inoculum bioreactor cells can be used to inoculate a production bioreactor directly (Figure 1A, bottom arrow) or to generate cell bags (step 4). Those bags are stored frozen as a process intermediate to allow bypassing the earlier expansion process steps 1–3 for higher efficiency (5, 6). Frozen cell bags can be used at a later time (as an expanded cell source) to inoculate an inoculum bioreactor (step 5), which in turn can be used to inoculate a production bioreactor (step 6). The problem we focus on here is identifying the cause for qP variability among different bags after they are thawed (step 5).
Methods
Cell Expansion Process (Vial to Inoculum Bioreactor): First we need to produce a sufficient quantity of viable cells for an inoculum bioreactor. A frozen ampule of the manufacturer’s working cell bank (MWCB) is thawed in a water bath at 37 °C, then added to a tissue-culture flask (T-flask) with culture media (Figure 1, step 1). The T-flask is incubated at 33–38 °C in 5% (nominal) CO2 for two to five days, depending on cell count and viability. Then the culture is expanded into more and/or larger T-flasks from a starting minimum cell density of 1.5 × 10⁵ cells/mL and incubated using culture media under the same conditions. During that process, media can be replaced or added (depending on the culture growth rate and viability).
When sufficient T-flask cultures have accumulated, they are transferred to roller bottles (Figure 1, step 2), with fresh media added. Roller bottles are closed and incubated at 33–38 °C on a rotating apparatus. After two to five days, each roller bottle is split into additional roller bottles, and additional media can be added. This process continues until sufficient cells are obtained to inoculate the bioreactor (Figure 1, step 3) at a sufficient volume to obtain a minimum starting density of 2.5 × 10⁵ cells/mL.
Freezing Cells in Bags: Cells from the initial seed-train in the bioreactor can be collected, frozen, and stored for later use (Figure 1, step 4). Cell suspension from a bioreactor is transferred to a sterile transfer vessel, which is cooled to 2–8 °C while cells are agitated to remain in suspension. Under aseptic conditions, sufficient freezing medium containing sterile dimethyl sulfoxide (DMSO) is added to give a final concentration of 10% in the cell concentrate.
Media components and DMSO help to stabilize the cells and their membranes in the frozen state during storage. However, DMSO can be harmful to cells before freezing and after thawing, so contact time is minimized during these transitions by rapid freezing and washing/diluting while thawing cells. After aseptic connections are made within a biosafety cabinet, aliquots are dispensed into sterile ethylene vinyl acetate (EVA) bags. Samples are taken at this point for determination of cell density, viability, and sterility. The cell-containing bags are placed inside a metal cassette and frozen before they go under vapor into a liquid-nitrogen freezer for long-term storage.
Seeding Bioreactors from Bags: When frozen cells are to be used (Figure 1, step 5), the bags are removed from storage and thawed in a water bath at 33–38 °C, and the cells are washed in media to remove DMSO. Cell density and viability are measured before the culture is used to inoculate a bioreactor under standard starting conditions: minimum cell density of 2.5 × 10⁵ cells/mL, with a minimum volume of media in the bioreactor to allow submersion of probes for pH, temperature, and oxygen. When sufficient cell density is reached in the bioreactor, the culture can be used to inoculate a larger scale production unit (Figure 1, step 6).
Bioreactor Cell Cultures: Steady state is defined herein as the period when cell density counts are maintained at 12 × 106 viable cells/mL or higher under continuous perfusion after the initial cell accumulation stage. Temperature is maintained by a heat-exchanger jacket or heat blanket, oxygen concentration with tube aeration and/or sparging, and pH through addition of CO2 gas to lower it or sodium bicarbonate (NaHCO3) solution to raise it.
Statistical Methodology — Orthogonal Partial Least Squares (OPLS) Projections to Lateral Structures: Also known as projections to latent structures, OPLS is a multivariate technique used to examine relationships among input variables (x space) and one or more output variables (y space). We used this method to investigate the relationship between process parameters (x) and bioreactor qP (y).
OPLS modeling offers several advantages over methods such as partial least squares (PLS) and traditional multiple linear regression (MLR). OPLS models are easier to interpret than PLS because noncorrelated variation in the x space is separated from correlated variation in the x–y joint space. OPLS takes into account potential multidimensional correlations among variables in the x space. That is not achievable using MLR because the degrees of freedom would be completely exhausted by adding higher-order interactions. The “Standard Diagnostic Tools” box lists details specific to cumulative fitness and variable importance of projection plots, model fit and performance, data exclusion, and software we used for data analysis.
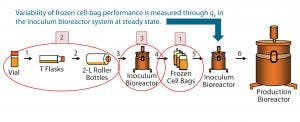
Figure 2: Investigation of three process phases (circled in red) as potential sources for qP variability in the inoculum bioreactor, observed after thaw of frozen cell bags (step 5)
Identification and Ranking Sources of Variability
Excluded Variables: We began by investigating the possibility that variability was introduced through raw materials (chemicals, biologicals, and disposable materials) used in the process. For compounded materials such as cell culture media, we investigated the possibility of secondary-source variability (from the suppliers of our media suppliers). However, no raw materials could be linked to variability in qP (none were associated with cases of either high or low productivity following bag thaw). That contrasts with previous reports (2–4) of culture media (including chemically defined) serving as a major contributor to process and cell metabolism inconsistencies.
Next we investigated operations: equipment, personnel (human error), and procedures (including sampling and testing). Again, no correlation could be established to the variability in qP. In addition, we found no problems with bioreactor (or other system) process controls. Neither could environmental conditions (e.g., shifts in room temperature within normal range) be linked to the variability in qP.
Investigation of Process Steps: Because the MWCB (frozen vials stored under strictly controlled conditions) is common to all batches of frozen cell bags, the observed variability in qP among bag batches must arise from operations occurring during the cell expansion process. So we focused specifically on process inputs that could introduce variability to the performance of bag-frozen cells when cultivated in the inoculum bioreactors.
We prioritized possible process steps that could introduce qP variability at the inoculum bioreactor as follows: (1) the cell freezing process; (2) early phase of the process (cell expansion from vial thaw through roller bottles), and (3) inoculum bioreactor operating conditions (numbers circled in Figure 2). And we analyzed each process step for its potential to introduce qP variability.
Investigation Process |
|---|
A systematic approach was taken to identify potential sources of variability in the cell expansion process and correlate them with titer performance: |
Assembling a crossfunctional team of experts from operations, manufacturing sciences, quality assurance, operational excellence, and quality engineering groups |
Reviewing the technical process — de novo, standard operating procedures (SOPs), and risk assessments |
Breaking down the process flow into a limited number of key steps |
Assessing each step in detail for its potential contribution to titer variability and determining the list of associated parameters |
Selecting (as a team) process variables (input parameters) based on their potential effects on titer following thaw of frozen bags |
Performing detailed statistical analyses as described herein |
Deriving conclusions, including identifying potential corrective and preventive actions (CAPAs) for mitigating the risk (reducing variability). |
Reporting findings. |
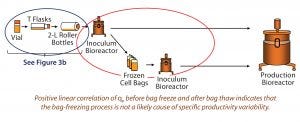
Figure 3A: Bag-freezing process has no effect on variability in qP, and vial thaw through roller bottle steps were excluded as a source of qP variability. Circled in red are process phases before and after cell-bag freezing, and circled in blue are early phases of the cell expansion process.
Step 1 — Freezing Cells: To test the impact of the bag freezing process on qP variability (Figure 3A, circled in red), we determined the average qP from when cells reached (VCD based) steady state until bag freeze. We also determined qP (for the corresponding cell sources) upon bag thaw for a similar period (about 10 days) once cells had reached steady state. Then we plotted the average steady-state period qP values for each cell source (Figure 3B), discovering a positive linear correlation (slope = 1) for those before bag freeze (x axis) and after bag thaw (y axis).
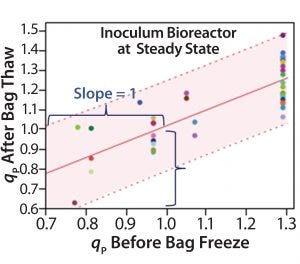
Figure 3B: Bivariate plot shows correlation between average inoculum-bioreactor steadystate titer before bag freeze and average inoculum-bioreactor steady-state titer after bag thaw; each colored data point represents a different cell source. The red line is the linear regression fit, and the shaded region represents the 95% prediction interval boundaries. Positive linear correlation of qP before bag freeze and after bag thaw indicates that the bag-freezing process is not a likely cause of specific productivity variability.
We saw no significant difference in qP before cells were frozen in bags or after they were thawed. Cell sources with low qP before freezing also had low qP after thawing; cells with high qP before freezing also had high qP after thawing. That rules out the bag-freezing process as a likely cause of specific productivity variability.
Step 2 — Early Phase (Cell Expansion from Vial Thaw Through Roller Bottles): Next we investigated process inputs into early steps of the cell expansion process. This phase of the process serves to provide an adequate number of viable cells for the inoculum bioreactor (Figure 3A, circled in blue). We deemed three categories of variables to be important:
Process parameters during cell expansion (cell densities, viabilities, metabolites, pH, pCO2, pO2, and temperature)
Cell age (defined as the number of doublings before bioreactor inoculation) reflecting growth duration
Growth rate (the average specific growth rate of cells derived from the cell-expansion process) reflecting the state of the cells.
Thus, we evaluated each category systematically for its potential impact on qP in the inoculum bioreactor.
We applied OPLS analysis to cell-expansion process parameters at the T-flask and roller bottle (RB) stages of cell expansion (Figure 3A, circled in blue) both together and independently. The models showed poor fitting for these stages (T-flask and RB, both together and each alone, respectively). Poor fit and predictability thus did not permit definitive conclusions about relationships between T-flask and roller-bottle input process parameters and the steady-state bioreactor qP. It may be that the process at this stage operates with narrow ranges of control parameters (e.g., CO2 incubator inputs) or that the parameters of these (manually intensive) early stages of cell expansion are not cumulatively as influential as those in the (controller-operated) inoculum bioreactors.
We calculated cell age (the number of cell doublings) from vial thaw to bioreactor inoculation for each batch, matching the number of cell doublings to their corresponding bioreactor batch average steady-state qP. After analyzing a simple correlation (using SAS/JMP software), we found it not to be statistically significant, indicating that cell age does not contribute to variability in qP.
We also assessed growth rate (from vial thaw through T-flasks and RBs) for its potential impact on bioreactor qP. In rFVIII-expressing cells, a good positive correlation between cell-specific growth rates and qP has been demonstrated (7). Considering the nature of the product expressed by those cells and the mode of cultivation, that’s not surprising.
When one protein expressed by recombinant cells makes up a significant proportion of the total expressed cellular output, high growth rates can come at the expense of high specific productivities (and vice versa). That is often the case with monoclonal antibodies (MAbs) expressed at several grams per liter. However, expression levels of rFVIII are orders of magnitude lower than those of a classical MAb (7), limiting that tradeoff somewhat. Also, steady state perfusion culture is unlike batch culture, in which conditions that promote (or induce) productivity often do not result in substantial increase of maximum expressed protein concentration because they suppress cell growth (8). But no such induction/stress conditions are applied in perfusion production of rFVIII.
Therefore, we performed a correlation study to assess the potential impact of cell-specific growth rate during cell culture expansion (in T-flasks and RBs) on qP in the inoculum bioreactor at steady state. Statistical analysis (using SAS/JMP software) revealed that average specific cell-growth rate does not significantly correlate with bioreactor qP, suggesting that variation in growth rate during earlier stages of cell expansion does not explain the observed variability in qP.
In summary, our analyses of early steps in cell expansion provided no practical insights into sources of variability in specific productivity at steady-state inoculum bioreactors. This makes sense considering the lower level of process control (compared with a bioreactor) and time gap between this phase of the process and the inoculum bioreactor phase, when qP variability is observed.
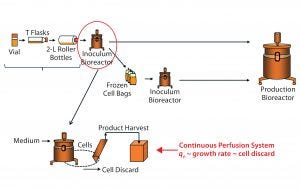
Figure 4: Bioreactor operation parameters evaluation as a potential source of qP variability; inoculum bioreactor process inputs (circled in red) were investigated as a potential source of variability in qP (top). In our continuous perfusion system, correlation between qP, specific growth rate, and cell discard rate, allows us to use the latter as a surrogate for qP (bottom).
Step 3 — Inoculum Bioreactor Operating Conditions: Having excluded both the bag-freezing process and early phases of cell expansion as sources of variability in qP, we finally investigated the potential impact on bioreactor qP at steady state of operational inputs into the inoculum bioreactor before bag freeze (Figure 4, circled in red). This bioreactor process phase is the most directly controlled of all cell-expansion unit operations and thus we prioritized it last in our investigation process.
Variables here included dissolved oxygen (DO), DO partial pressure, dissolved CO2 partial pressure, bioreactor temperature, pH, cell viability percentage, base medium addition rate (volume/day), specific lactate production rate, specific glucose consumption rate, cell age from vial thaw, qP, supply pressure, back pressure, settler temperature, settler return flow rate, and cell-discard rate (volume/day). We didn’t consider parameters that are held at a constant value and not subject to feedback control (e.g., agitation rate) because they cannot contribute to variability. Using OPLS analysis, we examined the relationships among bioreactor process parameters (at steady state) listed above (x) and cell discard (y) serving as a surrogate for qP, as explained below.
Our initial analysis revealed poor correlations among those process variables and qP in the inoculum bioreactor at steady state. Initially, we attempted to correlate bioreactor qP at steady state directly with the bioreactor process parameters. However, during steady state all parameters (including cell density and metabolites) are tightly controlled within a narrow range. That combined with the low resolution of the potency assay we used to calculate qP (precise only to the first decimal point — results are reported in 0.1 increments) (Figure 3B) makes it difficult to identify correlations among variables’ operational parameters. This was evident by the poor correlations (according to our OPLS analysis) between the process parameters listed above (x) and bioreactor qP (y) at steady state. Indeed, statistical analysis showed that model fit and predictability were very low, indicating poor model validity (data not shown).
Cell-Specific Growth Rate Correlates with qP: Cell-specific rFVIII productivity is closely associated with cell growth in perfusion systems (7). Therefore, we explored the correlation of qP with cell-specific growth rate through analysis of the bioreactor’s process parameters. However, cell-specific growth rate cannot be determined explicitly in this system because it requires measurements of cell density in the discard stream, which normally is not determined when cells are purged from the system and not used (bottom of Figure 4). Nevertheless, cell discard rate can be used as a reliable surrogate.
Cell Discard Rate Is an Appropriate Surrogate for Cell Growth: Cell discard rate is a reliable measure of cell growth in perfusion bioreactors systems at steady state because cell discarding is how these systems are designed to keep a constant biomass (bottom of Figure 4). To keep the cell density in the bioreactor at a target level, cells must be purged occasionally (cell-discard stream) as they multiply continuously. Cell loss during harvest is minimal because most cells are returned to the bioreactor through a cell-retention device, and viability typically is very high, so cell discarding offsets growth. Therefore, as growth rates increase, discard rates must increase proportionally.
We thus used cell discard as a surrogate for growth rate to assess the potential influence of several inoculum-bioreactor parameters on qP (bottom of Figure 4). Another advantage of using cell-discard rate is that it is a continuous (rather than a categorical) output, affording greater resolution both in the precision of values measured and over time. With cell discard used as a surrogate for qP, our model’s validity was much better, with improved fit and predictability (not shown). Thus, we could proceed by performing all model diagnostics with cell discard as y.
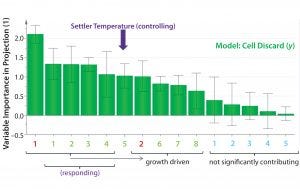
Figure 5: Orthogonal partial least squares (OPLS) multivariate analysis (MVA) variable importance in projection (VIP) plot; with the exception of settler temperature, variables of high importance in projection (>0.8) represent a response to an increase in cell growth rates and/or increased demand for oxygen (see text). Settler temperature is an exception because it affects (rather than responds to) cell-specific growth rate and productivity. Positive (green): (1) Base addition; (2) pCO2; (3) supply pressure; (4) dissolved oxygen (DO); (5) settler temperature; (6) specific glucose consumption; (7) total cell age; (8) pO2 Negative (red): (1) Backpressure; (2) bioreactor pH Uncertain (cyan): (1) Bioreactor temperature; (2) % viability; (3) qP; (4) return flow rate; (5) specific lactate production
OPLS Analyses: For multivariate analysis (MVA), we used the OPLS method to account for the effects of all bioreactor variables measured on the response of interest, namely cell discard volume (as a surrogate for qP). We generated a variable importance in projection (VIP) plot to rank input variables (x) according to their relative contribution in explaining variability in qP (y, given by cell discard) (Figure 5). Each of the 15 process variables was correlated with cell discard, and the direction of that correlation was determined as either positive (green) or negative (red). Variables with loading error bars that cross 0 (and/or with a VIP coefficient <0.8) were determined statistically as “uncertain” (blue, exhibiting neither positive nor negative correlation or not significant). Input variables with a VIP coefficient of ≥0.8 were considered to have a significant contribution to explaining the cell-discard volume variability. We ranked the magnitude of each variable’s contribution from left (high contribution) to right (low contribution) (Figure 5) to explain that variability.
Of the top five input parameters that contribute positively to variability, settler temperature is the only “controlling” parameter. The other four represent a response to increased cell growth rates. All O2 parameters (supply pressure, back pressure, and DO) are driven by higher growth rate, as is the NaHCO3 base addition. All respond to culture pH drop and resulting pCO2 liberated from the NaHCO3 under mildly acidic culture conditions. Specific glucose consumption and cell-discard rates also increase in response to a rising growth rate. Under steady-state conditions of continuous perfusion, it is unlikely that older cells would have higher specific productivities. Indeed, total cell age ranked very low and only borderline significant by its VIP coefficient. Thus, settler temperature is the top contributing (to explaining the model) parameter that affects (rather than responds to) an increase in growth rate and/or qP.
Univariate Analyses and Confirmation of MVA Statistical Predictions: Next we analyzed 17 scale-up campaigns at steady state. Because the OPLS analyses suggested that settler temperature is the primary parameter affecting variability in cell-discard rate, we performed a univariate analysis to investigate that correlation directly (Figure 6 (left)). Regression analysis showed that cell discard demonstrates a statistically significant correlation with settler temperature. As expected, campaigns operating with higher average settler temperatures demonstrated higher average cell-discard rates. A higher settler temperature implies a higher average temperature of cells in the bioreactor–settler loop, which would lead to a higher average growth (discard) rate. Considering the myriad potentially confounding input parameters in our inoculum bioreactor system, a noisy (yet significant) correlation makes sense.
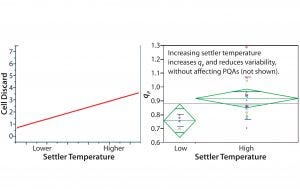
Figure 6: Univariate analyses; cell discard (y axis) correlates positively with increase in settler temperature (x axis); steady-state values were averaged for 17 independent cell expansion campaigns (left). Upon grouping these cell expansion campaigns into low and high temperaturerange groups, the latter demonstrated both a higher and less variable qP (right).
Next we directly tested the correlation between settler temperature and qP. We grouped our 17 campaigns into “low” and “high” categories based on the average settler temperature for each campaign, with the middle temperature range (spanning 3 °C) serving as the dividing point. As shown in Figure 6 (right), operation at a higher end of the settler temperature range caused higher qP and reduced variability (the vertical distribution of green diamonds). Those results corroborate the predictions made by OPLS modeling and confirm that increasing the settler temperature increases qP and lessens campaign-to-campaign variability. No product quality attributes were affected within the tested range of settler temperature (data not shown).
Standard Diagnostic Tools Used to Interpret the Results |
|---|
Cumulative Fitness Plot R2(Cum): provides a measure of fit, cumulative percent of variation of the y space explained by the model after the last component is added Q2(Cum): provides a measure of prediction, cumulative percent of variation of the y space predicted by the model after the last component is added R2(Pred): correlated variation in the x–y joint space R2(Ortho): uncorrelated x space variation to the y space R2x(Cum): total systematic variation of the x space, the sum of R2(Pred) and R2(Ortho) Variable Importance in Projection (VIP) Plot: ranks all variables in the x space in relation to one another in order of their contributions to explain the variation of variables in the y space |
Model Fit and Performance Cross-validation: used to determine the number of components that optimizes R2(Cum) and Q2(Cum) to provide the most informative model with respect to goodness of fit and predictability Data Exclusion Excluded all data with missing output values or input variables that would have been necessary for calculation excluded (~1% of the inoculum bioreactor steadystate data); also excluded batches with documented procedural deviations Software Used for Data Analysis Orthogonal partial least squares (OPLS) modeling performed with Umetrics SIMCA-13.03 software. SAS JMP software (version 9.0.1) was used for other analyses and graphing as indicated in the text. |
Discussion
Our breakthrough in investigating the sources of variability in this process came when we identified settler temperature as the top contributor to qP variability through the systematic statistical analysis described above complemented by process understanding. Upon ruling out the process of freezing cells in bags as well as earlier steps of the cell expansion process, we used OPLS on the inoculum-bioreactor process parameters to identify settler temperature as the most likely source of qP variability. Confirmation of that prediction followed upon univariate analyses of 17 cell-expansion campaigns (Figure 6). Yet statistics alone would have been insufficient without a deep process understanding that suggested cell-discard rate as a surrogate to cell growth and knowledge of the latter’s correlation (in this rFVIII production perfusion system) with specific productivity.
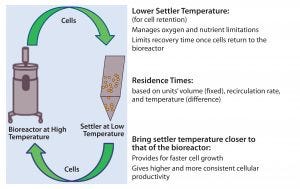
Figure 7: In a perfusion system, cells constantly shuttle between the bioreactor and the settler, the latter being controlled at >20 °C, lower than the former. Lower settler temperature reduces the cells’ metabolic rate to help them cope with conditions in the settler, which are not optimized for cell culture. However, recovery time (and cells’ performance once they return to the bioreactor) depends on both the temperature difference between the two unit operations and the two units’ operational volumes (which are fixed) and return rates (controlled to maintain target cell-specific perfusion rate, CSPR).
In a perfusion culture system, cells constantly shuttle between the bioreactor and cell-retention device (settler). Operational conditions of the bioreactor target optimal cell growth and productivity, whereas settler operation is optimized for effective cell retention. Therefore, the bioreactor is typically controlled at >20 °C higher than the settler is (Figure 7); the latter’s lower setting is intended to reduce the metabolic rate of settled cells. Growth rates and cellular metabolism are temperature dependent. In the settled state, cell density is very high (3–5× that of suspended cells). In such a dense cell mass, oxygen and nutrients can be consumed very rapidly, and local zones of anoxic or nutrient-depleted conditions could lead to altered metabolic states. A low settler temperature serves to mitigate those possibilities by reducing the cells’ metabolic rate.
However, our analyses suggest that the current settler temperature setting may be too low for a different reason. The lower that temperature, the longer will be the recovery period cells undergo as they transition between the settler and bioreactor (note residence-time dependence on unit operation volume and recirculation rates in Figure 7) (10). This understanding made a corrective action apparent: namely, adjusting the settler temperature closer to that of the bioreactor to lower variability in specific productivity while increasing productivity with no impact to product quality (or settler function).
The influence of bioreactor temperature on rFVIII production-culture performance was established at Bayer years ago, showing that both specific productivity and specific growth rate are higher at higher temperatures and that lowering the temperature reduced both growth rate and productivity — and that the effects are reversible. Such effects may depend on the nature of a given recombinant product, the expressing clone, and specific operational conditions. However, interplay between temperature, cell growth, and recombinant protein production have been reported with perfusion systems (11).
Our results (with variability primarily a result of operational parameters) are distinct from other reports assigning variability to biological attributes and/or variability in raw materials (4). No carry-on of variability from cell expansion (sometimes referred as n – 1 in fed-batch processes) into production scale (n) was observed in this case. Our results also differ from cases that identified technical variance (instrument, sample preparation, and so on) as the top contributor (9). But they are in line with a (somewhat unexpected) relatively low contribution of biological variability in the same report (9).
Our work focused on cell expansion, an early preproduction process phase (serving to generate an inoculum). However, given the use of bioreactor and cell-retention systems similar to (but smaller in scale than) those used in manufacturing, our findings regarding the importance of settler temperature control are applicable in the context of a continuous production perfusion system such as that used for production of rFVIII.
A general lesson from this work relates to the importance of additional considerations beyond engineering and biochemical ones (e.g., potential impact on unit operation performance and product quality/stability) in setting operational parameters. Specifically, it is critical to consider cellular biology because of the potential influence of unit operation settings on cell culture performance. Moreover, statistical tools such as MVA facilitate the investigation process by ruling out some to focus on the most likely sources of variability. This work demonstrates how complementing process knowledge with thorough statistical analysis can improve process understanding and allow for significant continuous improvements, including to legacy processes.
Acknowledgments
We thank Paul Wu and Steve Garger for their critical review of the manuscript. Special thanks go to Munira Jamil and Liliana Dogaru for their support and for providing a most pleasant work environment.
References
1 Hutchinson N. Understanding and Controlling Sources of Process Variation. BioProcess Int. 12(9) 2014: 24–29.
2 Gilbert A, et al. Investigation of Metabolic Variability Observed in Extended Fed Batch Cell Culture. Biotechnol. Prog. 29(6) 2013: 1519–1527.
3 Gilbert A, et al. Identifying and Eliminating Cell Culture Process Variability. Pharm. Bioprocess. J. 2(6) 2014: 519–534.
4 Rillera N. Efforts to Reduce Impact of Media Variability on Product Quality for a Commercial Perfusion Process. Cell Culture Engineering XV. Kiss R, et al, Eds. ECI Symposium Series: New York, NY, 2016.
5 Heidemann R, et al. A New Seed-Train Expansion Method for Recombinant Mammalian Cell Lines. Cytotechnol. 38(1–3) 2002: 99–108; doi:10.1023/A:1021114300958.
6 Heidemann R, et al. Characterization of Cell-Banking Parameters for the Cryopreservation of Mammalian Cell Lines in 100-ML Cryobags. Biotechnol. Prog. 26(4) 2010: 1154–1163; doi:10.1002/btpr.427.
7 Boedeker B. Chapter 19: Recombinant Factor VIII (Kogenate®) for the Treatment of Hemophilia A. Modern Biopharmaceuticals: Recent Success Stories, First Edition. Knäblein J, Ed. Wiley-Blackwell: Hoboken, NJ, 2013: 429–443.
8 Kim TK, et al. Osmoprotective Effect of Glycine Betaine on Thrombopoietin Production in Hyperosmotic Chinese Hamster Ovary Cell Culture: Clonal Variations. Biotechnol. Prog. 16(5) 2000: 775–781.
9 Le H, Jerums M, Goudar C. Characterization of Intrinsic Variability in Time-Series Metabolomic Data of Cultured Mammalian Cells. Biotechnol. Bioeng. 112(11) 2015: 2276–2283; doi:10.1002/bit.25646.
10 WO 2014059035 A1. Shimoni Y, Moehrle V, Srinivasan V (Bayer Healthcare). Methods and Systems for Optimizing Perfusion Cell Culture System. WIPO: Geneva, Switzerland, 17 April 2014.
11 Yoon, et al. Effect of Culture Temperature on Follicle-Stimulating Hormone Production By Chinese Hamster Ovary Cells in a Perfusion Bioreactor. Appl. Microbiol. Biotechnol. 76(1) 2007: 83–89; doi:10.1007/s00253-007-0985-x.
Corresponding author Yuval Shimoni is a principal specialist in quality assurance; Tim Forsyth is a senior scientist in statistics; Venkatesh Srinivasan is director of manufacturing sciences; and Ryan Szeto is a senior quality engineer in projects and technology transfers at Bayer HealthCare LLC, 800 Dwight Way, Berkeley, CA; 1-510-705-5775; [email protected], www.bayerhealthcare.com. Shimoni presented this work at Knect365’s BPI West in March 2017 and at the ACS-BIOT meeting in April 2017 (both in San Francisco, CA).
You May Also Like


