Optimizing and Intensifying ADC Aggregate Removal: A DoE Approach to Membrane Chromatography and Rapid CyclingOptimizing and Intensifying ADC Aggregate Removal: A DoE Approach to Membrane Chromatography and Rapid Cycling
Antibody–drug conjugates (ADCs) represent a growing therapeutic segment of the oncology field. Five such treatments received market approval from the US Food and Drug Administration (FDA) between 2008 and 2018, whereas three were approved in 2019 and two each were approved in 2020 and 2021 (1).
This disruptive technology combines highly potent small-molecule payloads with monoclonal antibodies (MAbs) to improve their specificity as cancer treatment. The antibodies deliver those toxic compounds directly to cancer cells but not to healthy cells, thereby mitigating many of the adverse effects associated with traditional chemotherapy. Once a MAb has bound to its target epitope on a tumor cell, it is internalized to merge with a lysosome inside the cell. Degradation of the resulting ADC–receptor complex releases the cytotoxin into the cell and causes apoptosis through a number of pathways (e.g., microtubule disruption and DNA damage).
Coupling payloads to MAbs requires fully purified antibodies, which are grafted chemically with the cytotoxic agents by linker molecules. The conjugation reaction uses organic solvents as well as toxins, so it must be conducted in a controlled and closed environment.
Payload grafting is either site specific or not. In the latter case, which is the most common among ADCs in development, peptide linkers are conjugated randomly either to lysine or cysteine amino acids on MAb molecules. The efficiency of that reaction defines a drug–antibody ratio (DAR), which expresses the number of cytotoxins that have been grafted onto each MAb. Nonspecific conjugation leads to heterogeneous DAR repartition, which influences the patterns of potency and safety.
Product and Process Impurities: Cytotoxic agents usually have an aromatic structure, which makes them hydrophobic. Conjugation thus strengthens a MAb’s hydrophobicity (2). In addition, using organic solvents in the conjugation reaction can promote aggregation.
Aggregates, free payloads, and both low- and high-DAR species are therefore the main impurities present in ADC process streams. Chromatographic techniques for removal require optimization to yield pure ADCs of acceptable quality. The need to handle highly toxic materials in closed processes have led to a growing trend toward replacing resins and chromatography columns with single-use solutions. Historically, resin productivity has been very low, thus limiting process throughput.
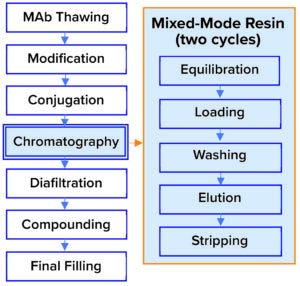
Figure 1: Established downstream process for an antibody–drug conjugate (ADC).
Our goal in this study was to assess a single-use chromatography membrane technology as a potential replacement for resin currently in use. In the established process (Figure 1), a mixed-mode resin is loaded at 20–30 g/L sorbent, with a yield of 98%, clearance of high–molecular-weight (HMW) proteins of 30%, and an overall productivity of 4 g/L sorbent per hour. Our goal was to intensify that process and enhance aggregate clearance without compromising yield.
Membrane-Adsorber Technology: Now increasingly common in the biopharmaceutical industry, membrane adsorbers provide a number of advantages over chromatography resins when used in polishing steps (3–5). Sartobind membranes from Sartorius Stedim Biotech have demonstrated interesting performance for ADC applications already (6). The large membrane pore sizes obviate the need for products to diffuse through resin pores. That enables process flow rates that are typically 10× higher than what is achievable with resin-packed columns while reducing buffer needs through sorbent downsizing. The resulting high productivity can enable a rapid-cycling chromatography (RCC) approach that makes further downsizing possible. Membrane adsorbers are relatively easy to use, with no column packing and unpacking required. Finally, the fully disposable nature of membrane capsules lowers the risk of cross contamination while saving on costs associated with cleaning validation.
Materials and Methods
Laboratory Scale: We conducted small-scale experiments with Sartobind Q Nano capsules: 1 mL of membrane and 4 mM bed height first, then 3 mL of membrane with an 8 mM bed height. All tests used an ADC produced from stochastic conjugation on IgG1.
For our first experiment, we used Sartobind Q 1-mL capsules in flow-through mode at two different pH levels and two different dimethylacetamide (DMAC) solvent concentrations to evaluate the effects of those parameters, with loads up to 60 g/L sorbent. We handled the capsules following manufacturer instructions:
• sanitization with 1M NaOH
• flush with 1M NaCl regeneration buffer
• equilibration with 20 mM phosphate buffer
• pH 7.4 or 8.2 and DMAC 0% or 10%.
Then we loaded ≤60 mg of ADC and flushed with equilibration buffer to recover the ADC before membrane regeneration (1M NaCl). For the 4 mM capsule, the flow rate was 10 membrane volumes per minute (MV/min). Samples were collected regularly during the flow-through process and submitted for analytical testing.
After that first round, we applied a design-of-experiments (DoE) approach to optimize the step and evaluate more precisely the influence of both pH (8.1, 8.3, and 8.5) and conductivity (1, 2, and 4 mS/cm) on membrane performance. We used the same handling procedure and loaded 60 mg, with a starting material concentration of 1 g/L, taking flow-through samples to determine both yield and HMW clearance.
That enabled us to select working conditions for a second DoE study to define the design space in a quality by design (QbD) approach. For this trial, we again used a Sartobind Q Nano 3-mL capsule and 180 mg of ADC, testing pH (8.4, 8.5, and 8.6) and conductivities (3, 4, and 5 mS/cm) . We also evaluated ADC concentration at three levels: 1.0, 5.5, and 10.0 g/L.
Finally, those results informed our selection of working conditions for a study of 10 cycles on the larger membrane. Our goal was to maximize productivity, so we applied a 5-MV/min working flow rate and optimized buffer volumes for each step.
Analytics: We quantified ADC concentration and HMW removal using a NanoDrop spectrophotometer from Thermo Fisher Scientific. DAR was determined using three techniques: UV spectroscopy, size exclusion (SEC) high-performance liquid chromatography (HPLC), and high-resolution mass spectrometry (HRMS). We calculated recovery by comparing the total amount of ADC loaded with that recovered in the flow-through and buffer flush solutions. And we assessed HMW clearance using the same approach.
Data Analysis: We used design wizards in Modde software (version 13) from Sartorius for experimental design and analysis at each phase of screening and optimization. Based on the nature of the factor tested (multilevel) for the screening phase, we chose a D-optimal design. Such designs maximize the determinant of an experimental matrix (which can be considered the maximum experimental volume). For the optimization, we chose a face-centered central composite design. Both designs could support models to account for primary effects, interactions, and quadratic effects.
For model fitting, we used the software’s analysis wizard and removed nonsignificant parameters with a goal to optimize the model’s predictive power, indicated by Q² values. Then we could use the optimized models to decide which process condition was superior based on a contour plot. R² shows how well a generated model is describing the data; Q² shows how well the model can be applied to future data that were not used for the model. The latter value is determined by a leave-one-experiment-out methodology. High values in R² and Q² are targeted, with the maximum value being 1 in each case.
Results
Preliminary Trial: The first trial demonstrated the influence on HMW clearance of working conditions during loading (Figure 2). The membrane was loaded with over twice the load of the column resin (which is used in capture) but was operated in flow-through mode.

Figure 2: Effects of buffer conditions on clearance of high–molecular-weight (HMW) proteins; ADC starting solution was adjusted in four different buffers at a concentration of 1 g/L (2 mS/cm conductivity) and filtered through a Sartobind Q Nano 1-mL capsule (4 mM bed height) at 10 MV/min. Samples went through the loading for assessment of HMW clearance.
Those results showed that it was possible to use anion-exchange chromatography (AEX) to clear aggregates from ADC material. HMW removal was very efficient with a higher-pH buffer: up to 80% at 50 g/L loading, which is better than the established process. However, HMW removal decreased over loading and was compromised by the presence of DMAC. A lower-pH buffer (7.4) also reduced HMW removal for the test ADC, probably because the working pH was below its pI, resulting in an overall positive charge for the aggregates. Yields of 76–92% correlated inversely to HMW removal (higher yields at pH 7.4 and with DMAC present).
Note that a separate experiment demonstrated inefficient aggregate retention at conductivities >6 mS/cm for this ADC on a Sartobind Q adsorber (data not shown).
Screening DoE: With those promising results, we decided to test the influence of pH and conductivity on HMW retention, yield, and DAR. Using a DoE approach we investigated three levels of pH (all above pI) and three levels of conductivity with a D-optimal factorial plan including three repetitions of a center point (Figure 3).
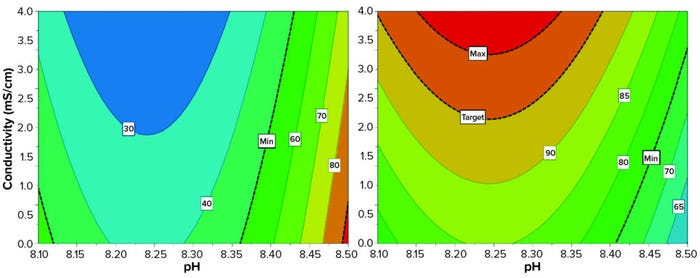
Figure 3: Effects of buffer conditions on HMW clearance and yield using a design-of-experiments (DoE) approach; ADC starting solution was adjusted in nine different phosphate buffers (pH 8.1, 8.3, and 8.5; conductivity 1, 2, and 4 mS/cm). At a starting concentration of 3.6 g/L, the suspensions were filtered through a Sartobind Q Nano 1-mL capsule (4 mM bed height) at 10 MV/min. Yield (right) and aggregate removal (left) were evaluated with UV spectroscopy and size-exclusion (SEC) high-performance liquid chromatography (HPLC), respectively. Minimum aggregate clearance was set at 50%; minimum yield was set at 75%.
For both HMW removal and yield, we identified a significant nonlinear effect. A plateau occurs with the experimental range (e.g., for pH between 8.2 and 8.3) wherein small changes of pH and conductivity do not change HMW or yield. We consider that to be a sign of process robustness. The resulting model quality metric showed acceptable validity, but for HMW the model was not strongly predictive (Q2 = 0.23). Its descriptive power was acceptable for yield (R2 = 0.86) and HMW (R2 = 0.73). The best aggregate clearance was obtained at higher pH (>8.4). The influence of conductivity seemed limited once pH was >8.35 and was stronger below that.
We obtained the highest yields (>90%) by using a slightly lower pH (8.15–8.35) and conductivities in the upper range (>2 mS/cm). DAR remained in the targeted range throughout; nevertheless, we observed that high-DAR species tended to be retained especially at low conductivities. So we target a conductivity >3.4 mS/cm to obtain an acceptable DAR. Lower DAR in the flow-through correlated with stronger HMW removal.
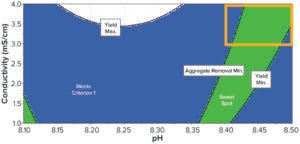
Figure 4: Sweet-spot plot balancing HMW clearance and yield.
As expected, comparing those two plots shows an inverse correlation of both parameters: High yield mostly correlates with low aggregate removal. Consequently, optimal yield and HMW clearance did not overlap. We used the software’s sweet-spot functionality to find the best compromise between those two factors (Figure 4). The acceptable compromise between our two responses was at pH >8.4 and conductivities >3 mS/cm. Those conditions also enabled the process to meet our DAR target. Based on that, we decided to perform a new DoE study centered on the optimal point to assess process performance using a QbD approach (orange zone in the Figure 4).
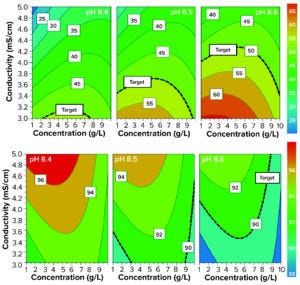
Figure 5: Design space for aggregate removal (top) and yield (bottom) on a Sartobind Q membrane; target aggregate clearance was set at 50% and target yield was set at 90%.
Optimization DoE and Test of the Design Space: Selected pH levels for this DoE study were 8.3–8.5; selected conductivities were 3–5 mS/cm. We added a third parameter: ADC concentrations at 1, 5.5, and 10 g/L. Figure 5 shows the resulting contour plots, with responses for HMW clearance and product yield. The HMW clearance model gave an R2 of 0.88, Q2 of 0.67, and a strong validity (0.66). For the yield model, R2 was 0.77, Q2 was 0.31, and model validity was lower (0.33) but still >0.25 (below which would indicate a lack of fit).
Aggregate removal was higher than what the established column-chromatography process could provide (30%) in most conditions (Figure 5, top row). It was negatively affected by high conductivities, high concentrations (>8 g/L) and lower pH levels (8.4).
Yield was >90% target in most conditions, too (Figure 5, bottom row). It was maximum at lower pH levels and higher conductivities, confirming an opposite trend to that for HMW removal. However, it also seemed to be limited by high ADC concentrations (>8 g/L).
DAR also varied based on the working conditions, but to a lower extent. It was nearest to the starting value when the yield was high and aggregate removal was low. DAR in this study was at most 0.3 units below that observed with the established purification process.
In all cases, the model allowed us to determine that the parameter with the strongest influence overall was conductivity. But the results also suggest that pH needs to be tightly controlled. We concluded that aggregate removal was efficient with the membrane adsorber because our three key attributes almost always met the target specifications. However, this DoE also highlights the need for tight control over both pH and conductivity.
Process Intensification Through Membrane Cycling: With membrane loading identified as a key parameter from the beginning of our study, we expected cycling to bring a strong benefit in footprint and costs. So we decided to run 10 cycles on a Sartobind Q Nano 3-mL capsule as proof of concept for an RCC approach. According to our model, the influence of pH was low within the working range. Therefore, we chose loading conditions to use a central pH from the DoE and maximize HMW clearance while targeting a yield of 90%: phosphate buffer, pH 8.5, conductivity 3.5 mS/cm, and 2 g/L ADC concentration.
The cycling study was successful, with stable pressure and overlapping UV280 peaks for 10 cycles, suggesting no membrane fouling and stable performance (Figure 6, left panel). Yield was comparable to the model’s predicted value (88–90%), ranging 85–91%, and the total pool value was 87% (Figure 6, right panel). We do not consider the observed variations to be significant.
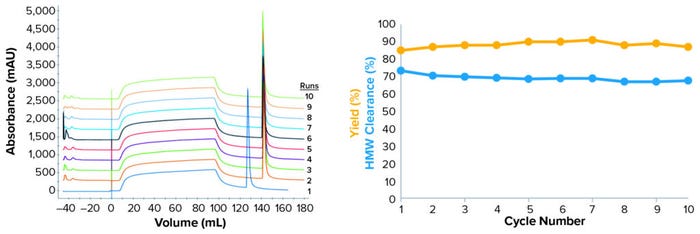
Figure 6: (left) Overlay of chromatograms from 10 cycles; (right) evolution of key quality attributes over 10 cycles; the cycling study used 1 mM phosphate buffer at pH 8.5 and 3.2 mS/cm conductivity. ADC concentration was adjusted to 2 g/L. Suspensions were filtered through a Sartobind Q Nano 3-mL capsule (8 mM bed height) at 5 MV/min. UV280 absorptions were overlapped from the 10 cycles to detect performance issues over reuse (left). Yield and aggregate removal were evaluated using SEC-HPLC, then plotted over the 10 cycles (right).
However, HMW removal was above expectations: 67–73% (a 69% average value from the filtrate pool), with 55–60% predicted by the model. This remained stable over 10 cycles, with a minor trend toward reduction in the clearance, which dropped from 73% for the first cycle to 68% for the final cycle. That could be within the assay variability, but that would need to be confirmed for determining whether the regeneration procedure should be optimized. Nevertheless, HMW clearance results were far better than our initial target of 50% and the resin benchmark of 30%.
Finally, the DAR was slightly below (by 0.3 units) what was observed with the established process but remained within specifications. Note that these results align with the higher expected HMW clearance: DAR was slightly lower in the response surface methodology (RSM) study and remained constant over 10 cycles.
Discussion
We have drawn two conclusions from this study. First, the Modde model predicted the performance of our membrane-adsorption–based process well in terms of yield (for which predictability was the lowest among the three parameters). The real results of HMW removal were higher than the model predicted. Thus, the DoE model can be considered a worst-case scenario.
Our second conclusion was that a rapid-cycling approach maximizes the use of the membrane adsorber without significantly compromising the quality or yield of our ADC end product. Further studies should use a higher number of cycles and possible refinement of the regeneration procedure (only 1 M NaCl was used herein).
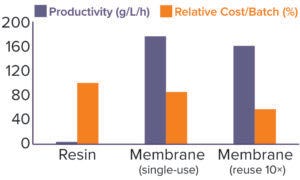
Figure 7: A process modeling tool was used to assess costs of using the current chromatography resin (31.8-L volume, reused for 50 batches) or switching to a single-use Sartobind Q 1.2-L membrane for 20 cycles per batch. The possibility of reusing the membrane for 10 batches also was evaluated. All costs are taken into account here, including working time, column packing once per year, column maintenance, reuse validation, resin lifetime studies, buffers, and hardware investments.
Using process projections, we evaluated the effect of switching from our established column-chromatography process to one based on this membrane-adsorber technology (Figure 7). Based on our cost model tool, the switch could enable us to downsize our process significantly by replacing 31.8-L resin with a 1.2-L membrane. The associated increase in productivity (from 4 to 176 g/L of sorbent per hour), with reductions in both time (from 12 to 6.5 hours) and buffer requirements (saving >800 L), provides a significant cost reduction of 15%. In addition, switching to a membrane process would make it possible to perform this process step in a single work shift, facilitating production planning.
Figure 7 also highlights that, if needed, the membrane could be reused for 10 batches and thus decrease the process costs further (–43% compared with the resin-based process). Further studies would be required to demonstrate the stability of membrane performance over time, but Sartorius has demonstrated reusability of the membrane up to 1,000 cycles.
Our conclusion is that the membrane adsorber can remove HMW species efficiently from ADC product streams. Our results even demonstrated higher aggregate clearance than is obtained using the mixed-mode resin, with acceptable impact on yield and DAR. Note that we chose to maximize aggregate clearance, which reduced the yield, but that a more equilibrated balance also might be found.
The RCC approach enables us to make the best of single-use products by increasing sorbent use within one batch. It brings strong benefits in terms of footprint, processing time, and cost — but also provides for flexibility and agility in manufacturing. Finally, by eliminating some storage costs, reuse validation, and complex resin-lifetime studies, this innovative approach could streamline the clinical phase and ultimately should reduce time to market.
Acknowledgment
We are grateful to Ian Schwartz for his support and advice on this project.
References
1 CDER. New Drugs at FDA: CDER’s New Molecular Entities and New Therapeutic Biological Products. US Food and Drug Administration: Rockville, MD, 27 January 2022: https://www.fda.gov/drugs/development-approval-process-drugs/new-drugs-fda-cders-new-molecular-entities-and-new-therapeutic-biological-products.
2 Mills BJ, et al. Effect of Linker-Drug Properties and Conjugation Site on the Physical Stability of ADCs. J. Pharmaceut. Sci. 109(5) 2020: 1662–1672; https://doi.org/10.1016/j.xphs.2020.01.029.
3 Mothes B, et al. Accelerated, Seamless Antibody Purification Process Intensification with Continuous Disposable Technology. BioProcess Int. 14(5) 2016: 34–58; https://bioprocessintl.com/downstream-processing/downstream-single-use-technologies/accelerated-seamless-antibody-purification-process-intensification-with-continuous-disposable-technology.
4 Miesegaes GR, et al. Viral Clearance By Flow-Through Mode Ion Exchange Columns and Membrane Adsorbers. Biotechnol. Prog. 30(1) 2014: 124–131; https://doi.org/10.1002/btpr.1832.
5 Chon JH, Zarbis-Papastoitsis G. Advances in the Production and Downstream Processing of Antibodies. New Biotechnol. 28(5) 2011: 458–463; https://doi.org/10.1016/j.nbt.2011.03.015.
6 Cordova JC, et al. Development of a Single-Step Antibody–Drug Conjugate Purification Process with Membrane Chromatography. J. Clin. Med. 10(3) 2021: 552; https://doi.org/10.3390/jcm10030552.
Eric Lacoste is head of ADC conjugation development, Audrey Bendelac is a process development engineer, and Benjamin Fabre is a scientist expert in ADC development, all at Sanofi 54-56 Rue la Boétie, 75008 Paris, France; 33-1-5377-4000; https://www.sanofi.fr/fr. Timo Schmidberger is a principal data scientist, and corresponding author Geoffrey Pressac ([email protected]) is a purification application specialist at Sartorius in Lyon, France. Sartobind is a registered trademark of Sartorius AG. NanoDrop is a registered trademark of Thermo Fisher Scientific.
You May Also Like


