Viral Vector Particle Integrity and Purity Analyses in Early Process DevelopmentViral Vector Particle Integrity and Purity Analyses in Early Process Development
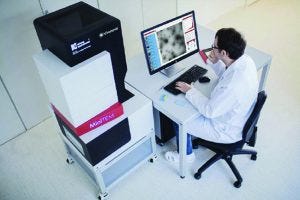
Figure 1: The MiniTEM system is a compact 25-kV transmission electron microscope designed for automated image acquisition and subsequent analysis.
Gene therapy is the transfer of genetic material to a patient’s cells to achieve a therapeutic effect. Therapeutic DNA typically is delivered using a viral vector system, and adenoviruses have been used for this purpose for over 20 years (1–3). Within the past 10 years or so, lentiviruses have shown promise in clinical trials (1–3), and adenoassociated viruses (AAVs) have been used in the first approved gene therapies in the Western world (4).
The number of gene therapy applications based on viral vectors is growing. Consequently, small-scale manufacturing processes increasingly require scaling up to commercial processes. Because some products have been initially manufactured using very simple concentration and purification methods, scale-up also might include process development.
Viral Vector Manufacturing
Viral vector upstream scale-up challenges include addressing the effects of moving from smaller to larger-volume cultures with changes resulting from differences in culture systems, feeding strategies, and mixing (5). Downstream encompasses filtration and chromatography steps for clarification, DNA removal, capture, purification,and polishing (6).
To obtain sufficient purity without disrupting viral vector integrity or losing too much product, several potential hurdles must be negotiated in scaling up to full commercial production. A manufacturing process must be robust and cost effective. Determining the right conditions during process development depends on reliable analytical methods that can be used quickly and easily throughout different process steps or phases (5).
Morphological changes that can take place during a process and affect transgene delivery include viral aggregation, loss of critical surface structures, and partial or complete breakage of viral vector particles. Such situations can be prevented at different stages of a process. For example, aggregation or particle disintegration can happen in absence unsuitable upstream or downstream parameters, but optimal conditions for high yield can compromise the conditions needed to preserve particle integrity. Another typical problem is failure to remove host cell protein (HCP) debris during downstream purification processes. Loss of particle morphology or integrity as a result of unsuitable buffer conditions in a downstream process or unoptimized formulation also can lead to loss of particle integrity over time. All such changes and undesired outcomes can slip through without careful monitoring during process development.
Sometimes such changes and conditions are hard to analyze with routine assays. Virus protein assays do not indicate the number of intact particles and how much viral protein is present in free or aggregated states. Numbers of viral genomes do not provide information about empty particles, and infectivity assays can take a long time, thus lengthening process development time.
Benefits of Using Transmission Electron Microscopy
Transmission electron microscopy (TEM) provides high-resolution images that can reveal most morphological changes, depending on the virus of interest. However, because TEM requires considerable operator skills and special laboratory facilities, it is not usually considered as an option for a routine analytical method during biopharmaceutical process development.
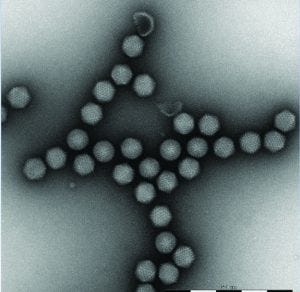
Figure 2: An example of adenoviral vector preparation. MiniTEM provides the necessary resolution and image quality for adenoviral vector analysis.
Vironova’s MiniTEM transmission electron microscopy system has been designed as an accessible method for routine testing in bioprocessing. It has been developed specifically for nanoparticle characterization, with the spatial resolution for detailed viral vector sample characterization. The system is powered by low-voltage electron optics making it vibration tolerant, and the compact design makes it possible for placement close to a standard laboratory process (Figure 1). Through automated image acquisition and particle detection and classification, the system can provide both high-resolution images and reliable quantitative data quickly (Figure 2).
TEM helps users understand what happens with viral particles when changes occur in parameters or process operations or when formulations are modified. Different biomanufacturing process conditions have different effects on particle characteristics, and images that reveal particle morphology together with quantitative analysis can provide a good understanding of and insights about the impact of such process changes.
Automated analysis from a MiniTEM system offers the advantage of removing user variability and enables analysis of a larger number of particles than possible with traditional manual methods. Thus, it is an objective analytical tool that provides statistically significant metrics.
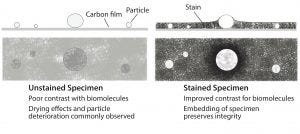
Figure 3: The difference between a stained and unstained virus particles
Sample preparation is a step in which user variability can still affect end results. The MiniTEM software method script has been designed to address this potential problem. When performing electron microscopy analysis, users can follow a simple sample preparation protocol in which a sample is applied to a grid support and primed with a negative staining procedure. Figure 3 shows the difference between a stained and unstained virus particle and indicates how the stain supports virus particles and prevents them from losing morphological characteristics through sample handling (e.g., drying effects).
Sample preparation carries a risk of uneven stain distribution, in which grid areas either have good or poor staining quality. Traditionally with manual evaluation, you must be sure to prevent taking into account virus particles in sample grid areas where particle morphology features caused by poor stain quality might bias the result. The MiniTEM system was designed to circumvent that risk by evaluating the staining quality automatically. The method script screens each grid at multiple positions to select only the areas of good stain quality. It is possible for the software to differentiate among those areas because an embedded virus particle has a halo shape that differs from an unembedded particle, and the contrast between the background and a particle is different for well-stained and poorly stained areas.
By detecting particles in areas of good staining quality, a MiniTEM system produces consistent and reliable results. Hundreds of images at multiple positions of a grid can detect several thousand particles automatically in a couple of hours. Absolute numbers from the on-grid quantitative measurement may not correspond to exact numbers in solution, but the result provides a relative measurement suitable for comparative studies.
TEM for Adenovirus Particles
Adenovirus particles are fragile in some cases, and under particular conditions they may disintegrate and thus be prone to aggregation. Disintegrated particles appear as debris when analyzed. Debris also can be remnant HCPs that have not been removed with downstream purification steps.
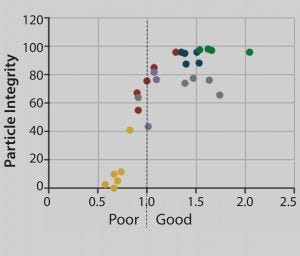
Figure 4: Relationship between internally unstained (intact) adenovirus particles and stain quality; each dot corresponds to a separate region on the grid. Sparsely stained and dried-out areas result in loss of particle integrity. Stain density gradually increases along the x axis. Each dot represents ∼400 adenovirus particles.
Figure 4 shows the correlation between stain quality and loss of adenovirus particle integrity. This correlation has been analyzed both manually by an electron microscopist with a trained eye and automatically with the MiniTEM system with identical results. The graph grid shows areas of poor staining quality with a significant loss of particle integrity. But above a threshold value for stain quality, particle integrity is stable. When that threshold value is set for automatic analysis, an automated system takes into account only particles not affected by sample treatment.
In one case study, analysts compared the purity of different adenovirus preparations. This collaboration between Vironova and FinVector Vision Therapies Oy (a key player in the research and development of viral-based gene therapy products based in Kuopio, Finland) focused on detection of adenovirus particles, particle breakage, and presence of debris.
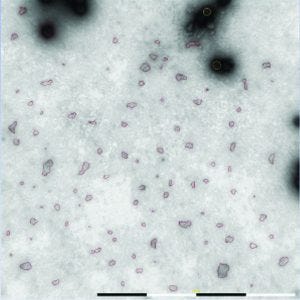
Figure 5: Algorithms in the MiniTEM software are used to automatically detect and differentiate debris and intact adenovirus particles based on size and shape criteria.
Automated operation of the MiniTEM system reduced operator hands-on time and enabled acquisition of a large number of images for automated particle analysis (Figure 5). Comparing total surface area of debris particles in samples of similar titer with that of adenoviruses served as a useful indicator of viral preparation purity. A high number of images and subsequent automated particle detection ensured that the result represented the sample and allowed statistical calculations between samples.
Gathering that information is critical because not all adenoviral structural proteins are incorporated into virions during a production process, and additional viral proteins can be released if vector particles are broken during a process. Those proteins can aggregate or promote aggregation of vector particles unless they are removed by downstream purification.
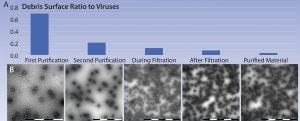
Figure 6: (A–B) Example of partial adenoviral purification process as observed with MiniTEM analysis; the ratio between debris surface area and adenoviruses drops as impurities are removed along the process. According to our experience, debris area is a useful indicator of sample purity.
This study shows that at the current state of native debris and other method-induced issues, adenovirus purity can be measured and compared among different virus preparations during downstream process development using a MiniTEM system (Figure 6). Such analyses are especially valuable during process development, when suitable process parameters and materials such as membranes are evaluated.
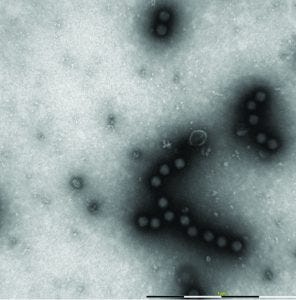
Figure 7: Different process impurities, such as membranous structures, viral capsomers and spikes can be seen by MiniTEM
Resolution of the MiniTEM system allows users to recognize different impurities, including membraneous structures, viral capsomers, and surface proteins known as “spikes” (Figure 7). Some of those impurities can be signs of overharsh purification conditions for some viruses. Such conditions might due to suboptimal buffer formulation, excessive processing pressure, increased liquid–air interfaces, and other shear forces. Aggregation of virus particles (which can occur if viral concentration is too high or for a nonoptimized buffer) can be spotted using TEM. But in this case, the interpretation of results is sometimes challenging because sample preparation steps can cause viruses to form or break close formations. In some cases, viruses need to be seen on several layers (i.e., on top of each other, not just beside each other on a grid surface) to be taken as signs of aggregation tendency.
Detailed characterization in early development provides insight to support both formulation and production. This collaboration study confirmed that a MiniTEM system can be used for observation and analysis of particle integrity and aggregation and purity analysis. It suggests that analytical methods providing information on multiple parameters more rapidly than traditional assays is likely to gain popularity in bioprocessing development.
References
1 Aiuti A, et al. Lentiviral Hematopoietic Stem Cell Gene Therapy in Patients with Wiskott-Aldrich Syndrome. Science. 341(6148) 2013: 1233151; doi:10.1126/science.1233151.
2 Cartier N, et al. Hematopoietic Stem Cell Gene Therapy with a Lentiviral Vector in X-Linked Adrenoleukodystrophy. Science. 326(5954) 2009: 818–823; doi: 10.1126/science.1171242.
3 Biffi A, et al. Lentiviral Hematopoietic Stem Cell Gene Therapy Benefits Metachromatic Leukodystrophy. Science. 341(6148) 2013: 1233158; doi:10.1126/science.1233158.
4 dos Santos Coura R, Beyer Nardi N. Genetics: A Role for Adenoassociated Viral Vectors in Gene Therapy. Genetics Mol. Bio. 31(1) 2008: 1–11.
5 Lesch HP, et al. Process Development of Adenoviral Vector Production in Fixed Bed Bioreactor: From Bench to Commercial Scale. Hum. Gene Ther. 26(8) 2015: 560-571.
6 Nestola P, et al. Improved Virus Purification Processes for Vaccines and Gene Therapy. Biotechnol. Bioeng. 112(5) 2015: 843-857.
Corresponding author Vesa Turkki is a senior scientist at FinVector Vision Therapies Oy, Finland and visiting researcher at the A.I. Virtanen Institute for Molecular Sciences University of Eastern Finland and KCT, Kuopio Center for Gene and Cell Therapy. Hanna P Lesch is research and development director at FinVector Vision Therapies, KCT Kuopio Center for Gene and Cell Therapy, and research director at FKD Therapies, Finland. Martin Ryner is strategic development manager, and Josefina Nilsson is head of business unit, EM Services, at Vironova AB, Gävlegatan 22, 11330 Stockholm, Sweden.
You May Also Like


