October 2018 Featured Report
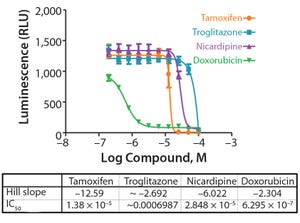
Figure 1: Dose response curves vary significantly when primary pancreatic tumor cells are grown in monolayer cultures (tOP) as compared with 3D cystic organoids (BOttOM). Each curve represents the mean and standard deviation of four replicates per condition.
Cells grown as three-dimensional (3D) spheroids are thought to more closely mimic in vivo physiology in terms of morphology, structural complexity, and phenotype. Being more physiologically relevant, 3D cultures can be highly predictive for compound profiling and evaluating cytotoxicity, a critical step in evaluating chemotherapeutic drug candidates.
Unfortunately, evaluation of drug cytotoxicity traditionally has relied on the use of two-dimensional (2D) cell culture monolayers. When grown in monolayers, cells are not exposed to soluble gradients, are forced into an apical-basal polarity, reside on a continuous layer of matrix with adhesions restricted to an
x–y
plane, and undergo unconstrained spreading and migration in the
x–y
plane. By contras...
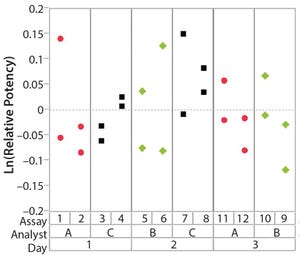
Figure 1: Variability chart showing high analyst-to-analyst variation
During lifecycle development of a biological assay (bioassay), identifying and reducing sources of variability might be required to improve method performance. Here I recommend some statistical and graphical approaches (consistent with USP <1033>) for practitioners to identify variation from experimental results (
1
).
Sources of Variation in a Bioassay
To correctly identify sources of variation in a bioassay, analysts must consider how that bioassay is to be executed. In particular, the experience and technical expertise of each analyst expected to execute the bioassay should be taken into account. If the dataset used in a variability study contains results predominantly from highly trained and experienced analysts, the estimate of precision can be disingenuously better (smaller variation) than with a more diverse level of technical aptitude across the analyst population. Conversely, if analyzed results emanate from inexperienced analy...
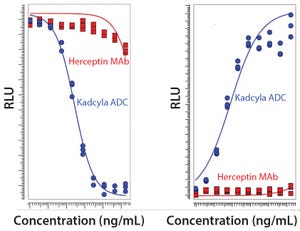
Figure 1: Comparison of unconjugated MAb and ADC in a proliferation assay with luminescence readout based on ATP release (LEFT) and a Caspase 3/7 apoptosis assay with luminescence readout to measure cytotoxicity (RIGHT) (RLU = relative luminescence units)
Seven years ago, the US Food and Drug Administration (FDA) approved the first product in a new class of biologics: antibody–drug conjugates (ADCs). The idea for these products already had been hatched a decade earlier when the promising field of antibody research — touting such molecules as “magic bullets” — had faltered, specifically against oncology-related indications. The early crop of anticancer monoclonal antibodies (MAbs) proved to have only limited efficacy, and interest in developing antibodies as therapeutic agents against cancer had faded. Two different biotechnologists simultaneously suggested that antibodies could be much more effective against cancer — if you could arm them with a chemical warhead — capable of triggering apoptosis in tumor ...
