A Novel 3D Culture System for High-Throughput Hepatoxicity ScreeningA Novel 3D Culture System for High-Throughput Hepatoxicity Screening
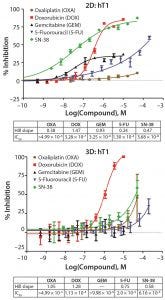
Figure 1: Dose response curves vary significantly when primary pancreatic tumor cells are grown in monolayer cultures (tOP) as compared with 3D cystic organoids (BOttOM). Each curve represents the mean and standard deviation of four replicates per condition.
Cells grown as three-dimensional (3D) spheroids are thought to more closely mimic in vivo physiology in terms of morphology, structural complexity, and phenotype. Being more physiologically relevant, 3D cultures can be highly predictive for compound profiling and evaluating cytotoxicity, a critical step in evaluating chemotherapeutic drug candidates.
Unfortunately, evaluation of drug cytotoxicity traditionally has relied on the use of two-dimensional (2D) cell culture monolayers. When grown in monolayers, cells are not exposed to soluble gradients, are forced into an apical-basal polarity, reside on a continuous layer of matrix with adhesions restricted to an x–y plane, and undergo unconstrained spreading and migration in the x–y plane. By contrast, the three-dimensional (3D) environment replicates the presence of soluble gradients and eliminates a forced, unnatural polarity. Cells interact with discrete matrix fibrils, with adhesions distributed in all three dimensions, and spreading and migration are sterically hindered. In the case of spheroids, distinct populations of cells can be observed, including a proliferating rim, a middle layer of quiescent cells, and a hypoxic core enriched with necrotic cells.
The difference in how cancer cells respond to chemotherapeutic drugs when grown in 2D compared with 3D environments is profound. Figure 1 shows the inhibition of primary pancreatic tumor cell growth in response to known chemotherapeutic agents when cells were grown in monolayers or as spheroids. The difference in response from 2D to 3D can confound efforts to identify potent chemotherapeutics — whether screening for efficacy against the tumor type or off-target toxicity (1).
High-Throughput Requirements
Although the advantages of 3D cell culture are well recognized, conducting cytotoxicity studies at large scales historically has been considered either too low in throughput or too costly to make it easily amenable to high-throughput screening (HTS). An early challenge in developing a high-throughput assay to assess cytotoxicity was the 1,536-well plate itself and the need for compatibility with a fully automated robotic platform — which off-the-shelf designs didn’t offer.
Before developing the hepatotoxicity assay, we implemented and validated use of a customized, ultralow-attachment spheroid plate with 1,536 round-bottom wells (2). This could enable a 3D viability assay to assess the cytotoxic effect of drugs on HT-29 colon carcinoma cells. The novel 3D 1,536-well plate addressed the following requirements and is now commercially available from Corning:
Simplicity of use
Absence of the requirement for an aspiration step during the entire spheroid formation and testing process
Uniformity and reproducibility of spheroid formation in the center of each well, both across each plate and from plate to plate
Enabled visualization of spheroids through clear well bottoms, with black sidewalls to reduce cross-talk and background noise in fluorescent and luminescent-based assays
Compatibility with widespread 1,536-well plate compatible instrumentation.
The cytotoxicity assay using HT-29 spheroids enabled processing of an average of 10 plates per hour. This translates to about 15,000 wells per hour, well within the ultrahigh-throughput parameters of 100,000 test compounds per day. Applying a similar approach, we further developed a 3D primary human hepatocyte culture system using the same 1,536-well plates, enabling high throughput, cost-effective hepatotoxicity determination.
Hepatotoxicity Determination with HTS
Drug-induced liver injury (DILI) is a significant concern for the pharmaceutical industry because it is the leading cause of failure during drug development and a major cause of drug withdrawal. More than 900 drugs, toxins, and herbs have been reported to cause liver injury, with hepatotoxicity accounting for 11–13% of acute liver failure in the United States. Compounds can injure hepatocytes in different ways, including by membrane disruption, blockage of transport pumps, and interference with cytochrome P450 enzymes.
In addition to selecting a 1,536-well plate that would be compatible with a high-throughput assay, choosing a specific cell type is critical when evaluating hepatotoxicity. Although a number of in vitro approaches are used to predict the potential for drug candidates to cause hepatotoxicity, each approach has critical shortcomings. The utility of immortalized cell lines and primary liver cells is compromised by limited throughput, loss of viability, and decreases in liver-specific functionality and gene expression. When cultured in monolayers, primary hepatocytes undergo changes in cell morphology, structure, polarity, gene expression, and liver-specific functions — a process referred to as dedifferentiation. Liver-derived immortalized cell lines do not possess phenotypic characteristics of liver tissue and can have gene expression profiles that vary between passages or differ from primary hepatocytes.
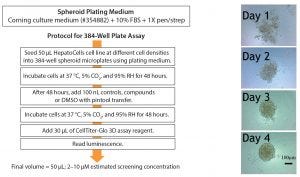
Figure 2: (left) 384-well plate assay protocol and (right) appearance of spheroids
The model system presented here conserves liver phenotype and prolongs viable culture time, two essential requirements for a robust screening method. The system uses cryopreserved Corning HepatoCells and companion medium. They were developed to retain the morphology and physiological properties of primary human hepatocytes but overcome their associated inherent shortcomings such as large interindividual variability and finite supply. The single-use, cryopreserved immortalized cells are derived from primary human hepatocytes, have low lot-to-lot variability, high cell purity (>99% hepatocyte-like cells), and robust activity induction response for major CYP enzymes. With a virtually unlimited supply and consistent performance, HepatoCells offer a reliable in vitro hepatic model for absorption, distribution, metabolism, and excretion/toxicity (ADME/tox) characterizations and other liver research applications.
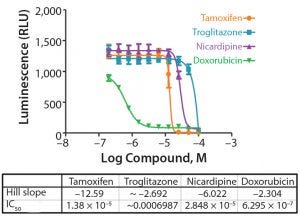
Figure 3: Concentration response curves for drugs tested on the HepatoCells cell line in 384-well format (Table 1); the curve represents the mean and standard deviation of eight replicates per each concentration.
The culture system was first developed and evaluated in 384-well format (Figure 2 [left]). Cells were plated at 50 µL in varying densities to understand hepatocyte spheroid formation and to assess whether the response was linear and to determine the Z-factor (Z′), a tool for comparing and evaluating the quality of high-throughput assays (3). Bright-field images of the wells show uniform, homogeneously rounded spheroids (Figure 2 [right]).

Table 1: Assay statistics over time show Z’ values greater and in some cases significantly >0.5. Twelve replicates per condition were used to determine the statistics. S/B is signal to basal ratio, and 2K/well is 2,000 cells per well)
Following incubation of the cells with test compounds and controls, cell viability was determined using the CellTiter-Glo 3D cell viability assay (Promega Life Sciences). The assay reagent penetrates large spheroids and measures ATP as an indicator of viability, generating a luminescent readout. Figure 3 and Table 1 show the concentration response curves and Z′ values at different time intervals following addition of the CellTiter-Glo assay. Across all time intervals, the Z′ values were excellent, ranging from 0.79 at 15 minutes to 0.90 at 60 and 90 minutes, respectively. A Z′ value ≥0.5 is indicative of compliancy with HTS requirements.
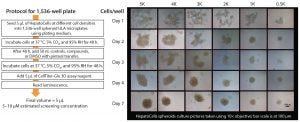
Figure 4: Assay protocol adapted for 1,536-well plates (left) and assessment of HepatoCells spheroids using 10× objective.
The model system was converted to a 1,536-well format (Figure 4 [left]). Plates were monitored over seven days to ensure appropriate formation of spheroids (4 [right]). By day 4, rounded spheroids had formed at lower initial seeding densities; at higher densities, spheroids are more amorphous. Bright-field and Z-stacking images confirmed the wells contained 3D spheroids. Additional studies demonstrated that luminescence readings and spheroid volumes were linear across a range of cell concentrations and that spheroids were homogenous in all wells and centered in each well, important considerations for HTS (data not shown). Z′ values confirmed the robustness of the assay in a 1,536-well format. A cell seeding density of 1,000 cells/well was used in subsequent assays.
Screening NCI and FDA Libraries
The National Cancer Institute (NCI) and Food and Drug Administration (FDA) libraries of approved oncology drugs were screened to assess hepatotoxicity using the developed high-throughput assay. With a nominal starting concentration of 24.8 µM, NCI compounds were tested in triplicate as a 10-point, threefold serial dilution. A compound qualified as a hit if it had a cytotoxic concentration of 50% (CC50) <10 µM. A total of 11 hits were found among this library of 99 compounds. A similar assessment was completed for the FDA library, with compounds tested at a nominal single concentration of 10 µM against ~2,820 oncology drugs approved in the United States, Canada, European Union, and Japan. Results showed a 3.7% hit rate, which is considered high compared with other 3D cytotoxicity assays (1). Hit rates vary between assays and depend on assay sensitivity, but typically we observe a hit rate around 0.5–1.0%.
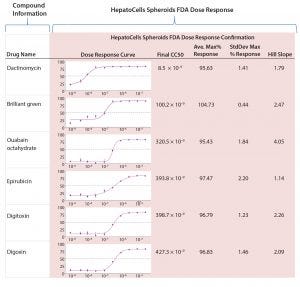
Figure 5: Sample of results from screening FDA library and HepatoCells spheroids in 1,536-well plate assay with dose-response curves
Active hits from the FDA library screening then were tested in a dose-dependent manner for confirmation and potency analysis. Figure 5 summarizes dose-response results along with compound information, promiscuity, response data, and confirmation screening for the five most potent hits from the FDA library. The first compound listed, dactinomycin, is quite potent in terms of cytotoxic profile with an IC50 of 8.5 nM. It has reported clinical cases of severe liver injury, including sinusoidal obstruction syndrome and acute toxic injury to hepatocytes (4).
The Right Model
Having the right model for drug screening is essential for predicting compounds that might cause drug-induced liver injury. The 3D hepatocellular model system described here can offer investigators significant advantages over traditional 2D monolayer cell culture systems in terms of maintaining morphological and functional characteristics of tissue and providing a better representation of in vitro drug toxicity. This high-throughput assay effectively identifies hepatocellular toxic compounds and can provide insight into marketed drugs that may not have appeared initially to be hepatotoxic.
References
1 Hou S, et al. Advanced Development of Primary Pancreatic Organoid Tumor Models for High Throughput Phenotypic Drug Screening. SLAS Discov. 23(6) 2018: 574–584; doi:10.1177/2472555218766842.
2 Madoux F, et al. A 1536-Well 3D Viability Assay to Assess the Cytotoxic Effect of Drugs on Spheroids. SLAS Discov. 22(5) 2017: 516–524; doi:10.1177/247255521668630.
3 Zhang J, Chung T, Oldenburg K. A Simple Statistical Parameter for Use in Evaluation and Validation of High Throughput Screening Assays. J. Biomol. Screen. 4(2) 1999: 67–73; https://data.broadinstitute.org/bbbc/linked_files/Zhang_JBiomolScr_1999.pdf.
4 Farruggia P, et al. Hepatopathy-Thrombocytopenia Syndrome (HTS) After Actinomycin-D Therapy: Report of Three Cases and Review of the Literature. Pediatr. Hematol. Oncol. 28(3) 2011: 237–243.
Corresponding author Timothy P. Spicer ([email protected]) is senior scientific director, Virneliz Fernández Vega is scientific associate, and Louis Scampavia, PhD, is associate professor and a senior scientific director, all in the department of molecular medicine at The Scripps Research Institute, Scripps Florida. Lynsey Willetts, PhD, MBA, is business director, Cell Culture, at Corning Incorporated Life Sciences. Michelle Vessels is product manager, Drug Discovery, at Corning Incorporated Life Sciences.
Research reported in this article is supported by the Scripps Special Funding Proposal under Tim Spicer, through donations from Corning Inc. and the NCI IMAT R33 CA206949.
You May Also Like


