A Statistical Approach to Assess and Justify Potential Product SpecificationsA Statistical Approach to Assess and Justify Potential Product Specifications

WWW.ISTOCK.COM
As stated in ICH Q6B, specifications are critical quality standards that are both proposed and justified by drug product manufacturers. Xiaoyu et al. provide information on several statistically based strategies to establish specification acceptance criteria (SAC) (1). Here we address an alternative approach to relate proposed SAC for quantitative data to relevant lot history. In particular, proposed SAC can be derived in part by using calculated limits for which the lower bound of an approximate 95% confidence interval for the process performance index (Ppk) is ≥1 (2).
This “minimum Ppk” strategy uses a statistical criterion based on manufacturing experience alone. The minimum Ppk approach is not intended to be the sole consideration for the determination of SAC. Other factors such as product stability, analytical procedures, and nonstatistical justifications from a scientific and regulatory perspective should be considered in determining appropriate SAC.
Process Capability Indices
With limited data, assessment of whether a process is in a state of control (stable) and identification of an appropriate probability distribution can be difficult. Both are required for the validity of process capability index (Cpk) estimates. Ppk can be used when a process cannot reasonably be assumed to be stable. Note that if a process is in fact stable, estimates of Cpk and Ppk would be relatively close (2). P ^pk, which is the estimate of Ppk, is calculated using Equation 1, in which x is the sample mean, and s is the sample standard deviation.

Equations
The criterion used in the minimum Ppk approach is that the assessed limit(s) are determined to ensure that the lower bound of an approximate 95% confidence interval on Ppk is at least 1.

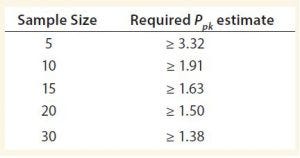
Table 1: Required Ppk estimates to meet criterion
The confidence limit equation for Ppk (3) is shown as Equation 2, in which n is the sample size, and Za/2 with a = 0.05 is approximately 1.96. Table 1 shows the required estimates of Ppk such that the criterion of the lower bound of an approximate 95% confidence interval on Ppk of at least 1 is met for a given sample size.

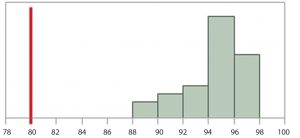
Figure 1: Histogram of results for n = 30 manufactured drug-product lots, hypothetical product quality results for a critical quality attribute; assuming a process is in a state of control and data can be appropriately modeled by a normal distribution. Considering the totality of evidence, a lower SAC has initially been proposed by subject matter experts (SMEs) to be 80.
Illustration of Use
Consider n = 30 manufactured drug product lots that are appropriate to relate the proposed SAC to the manufacturing process. Figure 1 shows the hypothetical product quality results for a critical quality attribute. Assume the process from which the data come is in a state of control, and the data can be appropriately modeled by a normal distribution. Considering the totality of evidence, a lower SAC has initially been proposed by subject matter experts (SMEs) to be 80.

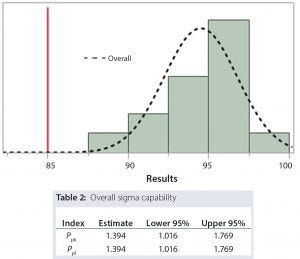
Figure 2: Capability estimate using revised limit
From Table 1, the minimum Ppk requirement is met when the Ppk estimate is at least 1.38. As shown in Figure 2, if a lower SAC limit of 85 is used, then the Ppk estimate is 1.394. Any whole number greater than 85 and less than the average (94.5) results in a Ppk estimate less than 1.38 and will not meet the criterion. Therefore a limit of 85 will both meet the minimum Ppk criterion, and provide a tighter SAC than originally proposed by SMEs. This information can be included into the totality of evidence by SMEs to develop an appropriate SAC.
Application
Herein we provide a statistical framework for relating proposed SAC to manufacturing capability at a given point in a product’s lifecycle. It can be used in conjunction with other statistical and nonstatistical considerations by SMEs to establish appropriate SAC. The primary benefit of this approach is to provide SAC that properly reflect the degree of manufacturing variability with moderate manufacturing history. In particular, the approach may be most useful when the number of lots is small to intermediate, as indicated in Table 1.
References
1 Xiaoyu D, Tsong Y and Shen M. Statistical Considerations in Setting Product Specifications. J. Biopharm.Stat. 25(2) 2015: 280–294.
2 Yu LX, et al. Using Process Capability to Ensure Pharmaceutical Product Quality. Pharm. Engr. 35(2) 2015; 35–43.
3 Montgomery DC. Introduction to Statistical Quality Control, 5th Edition. John Wiley & Sons: Hoboken, NJ, 2005: 345. (Note: substituting Ppk for Cpk without loss of generality; alternative estimate of process standard deviation).
Corresponding author Todd Coffey, PhD, is clinical assistant professor of statistics at Washington State University and formerly principal CMC statistician at Seattle Genetics, Inc. Keith M. Bower, MS, is principal CMC statistician at Seattle Genetics, Inc.
JMP v12 software was used to generate graphs and capability calculations.
You May Also Like


