Comparing SDS-PAGE and CE-SDS for Antibody Purity AnalysisComparing SDS-PAGE and CE-SDS for Antibody Purity Analysis
Antibody-purity analysis is critical to successful development of monoclonal antibody (MAb) biopharmaceuticals. Their manufacture involves processes of protein purification, formulation, and stability evaluation. All those processes need highly accurate and reproducible analytical results to support decisions made by product developers and manufacturers.
A common technology for antibody-purity analysis is sodium-dodecyl sulfate polyacrylamide gel electrophoresis (SDS-PAGE). In this technique, a polypeptide chain binds SDS proportionally to its relative molecular mass. The detergent nature of SDS denatures proteins by disrupting their noncovalent bonds, thereby simplifying the molecular structure. Negatively charged SDS also acts to coat proteins consistently, allowing for electrically driven separation toward an anode (a positively charged electrode). With an SDS–protein constant-weight binding ratio of 1:1.4, intrinsic polypeptide charge becomes negligible. So the final separation of such proteins depends entirely on differences in the relative molecular mass of their denatured polypeptides.
PRODUCT FOCUS: MONOCLONAL ANTIBODIES
PROCESS FOCUS: MANUFACTURING
WHO SHOULD READ: ANALYTICAL, PRODUCT DEVELOPMENT
KEYWORDS: ELECTROPHORESIS, IGGS, DETERGENTS, GLYCOSYLATION
LEVEL: INTERMEDIATE
Because of its automated, quantitative nature, capillary electrophoresis (CE) technology is commonly used for antibody-purity analysis as well. In this technique, an antibody sample is mixed with a replaceable SDS-gel buffer and then electrophoresed through an SDS-gel filled capillary. To accomplish that, samples are injected into the capillary inlets capillary using high voltage. Protein migration through the separation matrix occurs in an anodic direction, and quantitative detection occurs near the distal end of the capillary using a UV absorbance detection system.
It is well known that CE provides high-resolution, quantitative analysis relative to SDS-PAGE. However, direct comparison of the two technologies is difficult unless standardized samples are used. Here we describe our direct comparison of CE and SDS-PAGE based on evaluating the same sample in both a normal and a heat-stressed state by both methods.
Experimental
SDS-PAGE: We used an Invitrogen NuPAGE Mini-Gel electrophoresis system (Life Technologies) with 4–12% Bis-Tris gel and GelCode Blue stain to analyze a human IgG antibody sample and the same sample again after heat stress for 14 days at 45 °C. Samples were diluted to 0.2 mg/mL with water and further diluted to 0.15 mg/mL with 4× Invitrogen NuPAGE LDS sample buffer (Life Technologies). We conducted gel preparation, sample loading, and analysis all according to the gel-manufacturer's suggested procedure (included in the box). Using Alpha View integration software (ProteinSimple), we imaged the resulting gel to quantify percent area for each band and assess molecular weight.
CE-SDS: We used a PA 800 plus capillary electrophoresis system (Beckman Coulter) to analyze the same samples as above, performing sample preparation and system operation as suggested by the system manuals. Antibody samples were diluted to 1.0 mg/mL with SDS sample buffer, and nonreduced samples were heated at 70 °C for three minutes before injection into a bare, fused-silica capillary at 5 kV for 20 seconds. The machine separated proteins in an electric field of 500 V/cm for 35 minutes. No gel staining or destaining was necessary, and UV detection at 220 nm recorded the amount of protein passing through the capillary window. Beckman Coulter 32 Karat software determined sample quantitations and migration times.
Results and Discussion
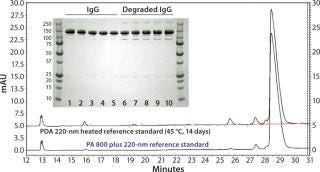
Figure 1 compares the SDS-PAGE and CE-SDS analyses. In the gel image, lanes 1 and 12 are molecular-weight markers, lanes 2–6 are normal IgG samples, and lanes 7–11 are heat-stressed IgG samples. Normal IgG samples show a single major band at 150 kDa and a minor band at 130 kDa. Heat-stressed IgG samples show a major band at 150 kDa and four minor bands at 300, 130, 90, and 25 kDa. By comparison, CE-SDS results for both IgG and degraded IgG easily show high-resolution separation allowing for easy quantitation of degradation species attributable to a high signal-to-noise ratio.

Figure 1:
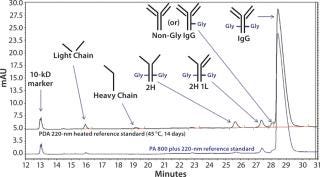
Using an IgG standard, the PA 800 plus 32 Karat software can make peak assignments for CE-SDS electropherograms (Figure 2). As shown in the bottom electropherogram, the major impurities of normal IgG are a single light chain (LC) and a combination of two heavy chains and one light chain (2H 1L). As shown in the top electropherogram, the major impurities of degraded IgG are LC, two heavy chains (2H), 2H 1L, and nonglycosylated IgG.

Figure 2:
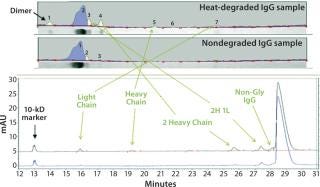
Figure 3 shows band assignments based on molecular-weight markers for the SDS-PAGE separation compared with CE results. These data illustrate that signal-to-noise ratios for impurities seen from heat-stressed IgG are much lower in the scan from the gel than corresponding peaks in the CE-SDS electropherogram. It was difficult to perform autointegration for the SDS-PAGE impurity bands using the Alpha View software.

Figure 3:
Figure 3 indicates that the CE-SDS also can detect nonglycosylated IgG easily, whereas SDS-PAGE cannot detect that species. This is a significant advantage of CE-SDS because glycosylated and nonglycosylated IgG often are functionally different, so these species must be separated from one another for accurate analysis. Other automated separations techniques — including chromatography methods — often are unable to effect such separations.
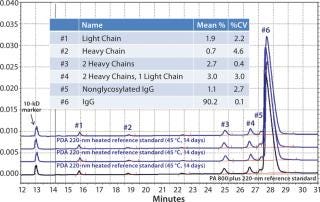
Assay reproducibility is a key attribute of analytical separations for quality control (QC) purposes, which are necessary for both interlab and intralab comparability documentation. Figure 4 shows reproducibility among four consecutive analyses of degraded IgG, which illustrates good overall reproducibility across the various fragments for the CE method.

Figure 4:
A Superior Technology for IgGs
We found CE-SDS technology to be a much higher-resolving analytical separation option than SDS-PAGE for separation of a normal and heat-stressed IgG samples in purity determinations. We observed a significant difference in peak resolution and signal-to-noise ratio between the two methods. CE-SDS could detect nonglycosylated IgG, which was not resolved by SDS-PAGE. Because glycosylation is very important to IgG function, that separation capability of CE-SDS is significant enough to qualify the technique as a replacement for SDS-PAGE in this application, given the difficulty of quantitating nonglycosylated IgG by other methods.
Author Details
Dahai Dong ([email protected]) is a senior scientist, and Jichao Kang is director ([email protected]) of the department of analytical and formulation development at Gallus Biopharmaceuticals LLC, 201 College Road East, Princeton, NJ 08540; 1-609-919-3300; http://gallusbiopharma.com.
You May Also Like


