Implementation of the BPOG Extractables Testing Protocols: Comparing USP and BPOG Extractables Data for Autoclaved Polyethersulfone FiltersImplementation of the BPOG Extractables Testing Protocols: Comparing USP and BPOG Extractables Data for Autoclaved Polyethersulfone Filters
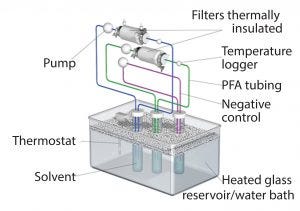
Figure 1: Filter extraction set-up (PFA = perfluoroalkoxy alkane)
Benefits of single-use technologies over traditional stainless-steel solutions in biopharmaceutical manufacturing include reductions in set-up times, cleaning/cleaning validation costs, elimination of cross-contamination risks, and smaller operating footprints. But despite increasing adoption of such systems, concerns remain about extractable and leachable (E&L) compounds from plastic single-use systems (SUS) components with the potential to compromise the efficacy and safety of final drug products. Such concerns are magnified by the growing number of SUS suppliers and the complex supply chain for SUS and components.
Although all equipment used for the manufacture of biologic drug substances and drug products must meet current good manufacturing practice (CGMP) requirements (1) and be free of materials that can lessen safety or efficacy of a drug product (2), no specific regulatory guidelines or industry standards pertain to the performance of E&L studies for SUS.
To address the industry’s need for a standardized method for conducting E&L studies for SU components, the BioPhorum Operations Group (BPOG) — an industry trade group of leading biopharmaceutical manufacturers (SUS end users) — published a standardized extractables testing protocol in November 2014 (3). Since that publication, numerous industry discussions ensued regarding the costs, technical issues, and scientific merit of some of the test conditions, culminating in June 2016 in a competing proposal from the US Pharmacopeia <665> workgroup (4). Whereas the BPOG protocol requires six solvents and three to four time points per component, the USP <665> protocol segregates components according to application risk, requiring three solvent extractions with single time points for components falling into the high-risk category.
One key challenge in assessing the relevance of the different proposed extraction conditions and time points is an extremely limited degree of publicly available information describing the relevancy of different extraction solvents, as well as the degree to which the different solvents and time points can be considered to generate unique or orthogonal data. Many SUS suppliers are concerned about the increased work that would be required if the different standards are not interchangeable. Herein, we compare the results obtained for autoclaved polyethersulfone (PES) filters using the BPOG protocol with other protocols obtained by following the USP guidelines and share our findings from testing multiple components per the BPOG protocol.
Extraction Setups and Protocols
Following sterilization either by gamma irradiation (50 ± 5 kGy with five weeks of extraction) or autoclaving at the upper bound of the typical range, filters were connected to PTFE air-driven pumps using perfluoroalkoxy alkane (PFA) tubing and then thermally insulated to help maintain the temperature. Test fluid was recirculated from a clean glass reservoir through the filters at a flow rate of ~2 L/min. We controlled the temperature of the test fluid using a thermostat-controlled water bath (Figure 1) and continuously monitored that parameter immediately downstream of the filter capsule. We generated a negative control under the same extraction conditions as the test article to determine background and system-related signals.
The BPOG protocol requires six extraction solvents – water, 5M NaCl, 0.1M H3PO4, 0.5N NaOH, 50% ethanol/water, and 1% polysorbate 80 (PS80) – at two different temperatures and four different time periods: −25 °C for 30 minutes and 40 °C for 24 h, 21 days, and 70 days. The USP guidelines propose three solvents for organic extractables analyses: a KCl/HCl solution at pH 3, a phosphate buffer solution at pH 10, and 50% ethanol.
We optimized existing analytical methods (columns, instrument parameters, sample pretreatment procedures, and internal standards) to improve specificities and achieve detection limits close to the reporting thresholds for the two protocols. Where necessary, we used alternative system suitability standards for the semiquantification of extractables, primarily because of selection criteria specific to our company.
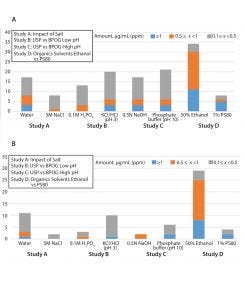
Figure 2: (A) Number of extractables detected from autoclaved PES filter; (b) unique compounds detected from each component in water, 5M NaCl, and 1% PS80
Results
Figures 2A and 2B summarize results of the comparison between USP and BPOG solvents from the autoclaved PES filter extractions.
Low pH — Comparing KCl/HCl (pH 3) and 0.1M H3PO4: Extractables profiles for filters treated with KCl/HCl (pH 3) and 0.1M H3PO4 were generally in good agreement, with all compounds above 0.5 ppm and >75% above 0.1 ppm. Notably, >75% of the compounds detected in the 0.1M H3PO4 solution (pH ~1.6) also were found in the KCl/HCl (pH 3) extracts. However, because of the pH difference and incorporation of a oneminute solvent delay period in the LC/PDA/MS method (to minimize instrument wear and tear) for the KCl/HCl (pH 3) extracts, we saw some subtle differences in the profiles:
PEG-related compounds were detected at higher levels (~2×) in the USP solvent than in 0.1M H3PO4.
Early eluting peaks such as triethylene glycol (PEG n = 3) and 4-hydroxy-2,2,6,6-tetramethyl-piperidine-1-ethanol) (HTPE), which elute at ≤1 min, were not detected in the KCl/HCl (pH 3) extracts because of the one-minute cut-off time, which was introduced to divert nonvolatile salts into waste.
Although the total quantities of HTPE-related compounds detected in both extracts were similar, their compounds exhibited minor differences. That was because fully esterified HTPE derivatives were detected only at pH 3 because of their enhanced stability under such conditions.
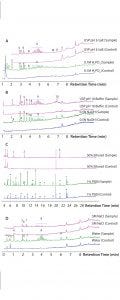
Figure 3: (A) Representative overlaid LC/MS (ES+) total ion chromatograms of the USP pH 3/salt and 0.1M H3PO4 extracts and the corresponding negative controls; (B) representative overlaid LC/MS (ES+) total ion chromatograms of the USP pH 10 buffer and 0.5N NaOH extracts and the corresponding negative controls; (C) representative overlaid direct-injection GC/MS total-ion chromatograms of the 50% ethanol and 1% polysorbate 80 extracts and the corresponding negative controls; (D) representative overlaid LC/MS (ES+) total-ion chromatograms of the water and 5M NaCl extracts and the corresponding negative controls
Figure 3A shows representative overlaid chromatograms of the two low-pH profiles.
High pH — Comparing Phosphate Buffer (pH 10) and 0.5N NaOH: In general, the extractables profiles for the phosphate buffer (pH 10) and 0.5N NaOH solutions were similar, with >80% of the compounds detected above 0.1 ppm in both. Of note is that >80% of the compounds detected in the 0.5N NaOH solution (~13.5) also were found in the phosphate buffer (pH 10) extracts. However, because the pH of the 0.5N NaOH solution was higher than that of the USP solvent, some differences were observed:
HTPE-related compounds were detected at higher levels in the pH 10 extracts because of their better stability at lower pH. At pH 13.5 the ester derivatives of HTPE are expected to hydrolyze.
Very low levels of phenol were not detected in the 0.5N NaOH solutions because phenol exists predominantly as its conjugate base (phenoxide) under highly alkaline conditions.
The 0.5N NaOH solution was found to be 4× more effective at extracting 1,3:2,4-bis(3,4dimethylbenzylidene) sorbitol. Figure 3B shows representative overlaid chromatograms of the two high-pH profiles.
Organic Solvent — Comparing 50% Ethanol and 1% PS80: Several challenges in correlating USP and BPOG profiles in ethanol and PS80 arose because of analytical interference from PS80-related peaks. To alleviate detection issues, the extractables information from the 50% ethanol extraction was used specifically to target potential extractables in the 1% PS80 extracts. As expected, coelution and ion suppression prevented meaningful correlations in chromatographic regions where PS80 and its related compounds eluted. As a result, it was not possible to differentiate between PEG-related compounds from PS80 degradation and those from a test article. In total, fewer overall extractables were detected in the PS80 solutions. Of the eight extractables detected in 1% PS80, six compounds were common between the two solvents. The two unique compounds were detected at >1 ppm (a C6H14O5 polyol and an HTPE degradation product). In some cases the PS80 data provided the worst-case quantity (e.g., 3:2,4-bis(3,4-dimethylbenzylidene) sorbitol). Figure 3C shows representative overlaid chromatograms of the two high-pH profiles.
Impact of Salt — Water vs. 5M NaCl: The water extracts contained higher levels of extractables than the NaCl extracts, indicating that in this case water represents the worst-case extraction medium. Two compounds unique to the 5M NaCl samples were observed in low levels (<0.5 ppm). One of those compounds was detected using headspace gas chromatography/mass spectrometry (GC/MS), and it might be related to enhanced sensitivity in the matrix. Both compounds also were detected in other solvents. Figure 3D shows representative overlaid chromatograms of profiles obtained with 5M NaCl and water.
Time Point Considerations: Based on the data generated at the 30-min, 24-h, and seven-day contact periods, the 24-h data generally provided the most representative extractables profile of the autoclaved PES filters: >90% of extractables were detected. However, note that for the seven-day time point, most extractables detected generally were found at higher concentrations after prolonged exposure. Of the two volatile compounds (2-propanol and cyclohexane) detected at the 30-minute time point, one was unique (cyclohexane), and the concentration of >90% of the extracted substances increased with time and temperature.
Overall USP and BPOG Profiles: Over 90% of the extractables detected in the water, 5M NaCl, and 1% PS80 extracts were also detected in the 0.1M H3PO4, 0.5N NaOH, and 50% ethanol extracts and the USP solvents.
Extractables Studies on Single-Use Components
To drive rapid adoption of single-use technology, a key goal is to establish the value of each extraction solvent and time point across a diverse range of single-use components.
Thus, as part of the project to evaluate different extraction protocols, we carefully considered the types of molecules extracted using different solvents and time points. Most of the organic substances extracted in aqueous media were trace-level polar molecules such as poly (ethylene glycol) (PEG), HTPE derivatives, and residual solvents (e.g., acetone, 2-propanol, 2-methyl-2-propanol, ethyl acetate, and tetrahydrofuran (THF)), which tend to solubilize readily in aqueous matrices. As anticipated, higher levels of light stabilizers such as HTPE and its derivatives were detected in the 0.1M H3PO4 extracts because of this solvent’s propensity to extract amine-based additives. Extractables in the 0.5N NaOH samples included not only polar organic compounds and residual solvents, but also low levels of phenolic breakdown products from antioxidants.
High pH conditions generally improved the solubility of phenolic compounds and induced degradation of additives to produce unique extractables. The extractables profiles from the 50% ethanol and 1% PS80 extraction included predominantly nonpolar short- to medium-chain hydrocarbons related to polyolefin (low-density polyethylene (LDPE) or polyprolylene (PP)) degradation, polar and nonpolar residual solvents, siloxanes, PES degradation products, photoinitiators and their degradation products, and various plastic additives and related substances — in addition to the polar substances detected in the aqueous extracts (e.g., PEG and HTPE-related compounds).
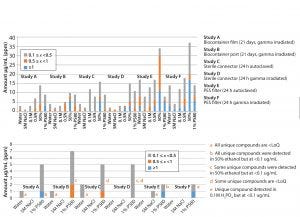
Figure 4: (top and bottom) Number of extractables detected from each component
Figure 4 summarizes results for the six different BPOG extractables studies performed on four types of single-use components, including films, ports, connectors, and filter capsules.
Impact of Added Salt: In general, most extractables found in the 5M NaCl extracts also were detected in the water extracts. The water extracts contained higher levels of extractables, as is expected. For the filter capsule with a hydrophilic PES membrane, water clearly provided the worst-case extractables profile because polar substances related to the PEG from the filter membrane and the HTPE-based light stabilizers formulated into the PP hardware were extracted more effectively with this medium.
Across these six studies, we saw one unique compound in salt at a low level (<0.5 ppm) as detected by headspace GC/MS. In general, differences between salt- and water- extraction profiles appeared related to enhanced detection limits in the presence of salt. For example, residual solvents such as 2-propanol and tert-butyl alcohol exhibited lower limits of detection (LoDs) in 5M NaCl. So we detected them in measurable amounts in 5M NaCl but below their limits of quantification (K >100) into the headspace. Thus, the difference in this case is most likely to be attributable to matrix effects associated with the analytical detection method rather than the polarity of the extraction medium.
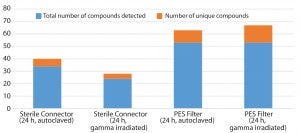
Figure 5: Number of unique compounds in autoclaved and gamma-irradiated components
Effect of Sterilization: The BPOG protocol requires that sterilization of SUS be performed before testing for extractables. Gamma irradiation and autoclaving involve use of ionizing radiation and high heat, respectively, which influence the chemistry of test materials differently. The extractables profiles generated for autoclaved and gamma-irradiated components were different (Figure 5).
All light-sensitive compounds such as HTPE-based light stabilizers and related compounds (filter capsules) and UV-curable materials and photoinitiators (connectors) were detected at much lower concentrations in the extracts from irradiated components. We attribute this to their poor stability under gamma-irradiation conditions. The lower concentration of PEG-related compounds in extracts from the gamma-irradiated filter capsule may be attributed to their degradation under the irradiation conditions.
Gamma-irradiation conditions encourage oxidative degradation (breakdown products from antioxidants). Thus, we detected more volatile and semivolatile organic compounds, including oxidative degradation products (e.g. aldehydes, ketones), in the extracts from the gamma-irradiated materials.
Effect of Contact Time and Temperature: In general, concentrations of most extracted substances increased with time and temperature. In addition, >90% of the extracted substances detected at 30 minutes also were seen in the extracts from later time points. Unique compounds detected at the 30-min time point were predominantly volatile compounds such as residual solvents (cyclohexane, 2-propanol, isopropyl formate, methyl ethyl ketone) and low–molecular-weight hydrocarbons from gamma-irradiated compounds. As expected, the concentrations of many volatile compounds tended to peak at earlier time points.
Based on the results of our studies, the following time points for each component generally provided the most comprehensive extractables profile because >80% of the extracted substances were observed:
biocontainer film/port, 21 days
connector, 24 hours
PES filter, 24 hours.
However, in all cases, longer durations still represent worst-case profiles because most extractables were detected at higher levels under such conditions.
Elemental Impurities: We did not detect ICH Q3D Class 1, 2a, and 2b elements in any samples, but we saw trace levels of Class 3 elements such as Ba and Mo and Cr at no more than 50 ppb in the water and 5M NaCl extracts, respectively. In addition, we detected no ICH Q3D elements in the 50% ethanol and 1% PS80 extracts at ≥20 ppb (BPOG reporting threshold for elemental impurities) nor from any samples at ≥50 ppb. Based on our findings, the 0.1M H3PO4 data appear to be sufficient to provide elemental impurity profiles for most cases, and particularly for processes in which elemental impurities at ≥50 ppb in the drug product do not pose patient-safety concerns. In addition, sterilization had no significant impact on the elemental impurity profiles of the tested components.
Comparable, with Some Caution
Based on the overall results of this comprehensive study of the BPOG and USP extraction protocols for SUS components, we conclude that the BPOG and USP protocols provide comparable results. However, it is critical to evaluate the compound-specific profiles detected in each of the six BPOG solvents for four different single-use components. That will help users to understand the driving-mechanisms, importance, and risk impact of compounds unique to any of the BPOG and USP solvents.
References
1 Code of Federal Regulations, Title 21, Food and Drugs (Government Printing Office, Washington, DC), Part 211.65(a).
2 Code of Federal Regulations, Title 21, Food and Drugs (Government Printing Office, Washington, DC), Part 600.11(b).
3 Weibing D, et al. Standardized Extractables Testing Protocol for Single-Use Systems in Biomanufacturing. Pharm. Eng. 34(6) 2014.
4 Plastic Components and Systems Used in Pharmaceutical Manufacturing. USP <665>USP Guideline PF 42(3), May–June 2016.
Corresponding author Gilbert Tumambac, PhD, is a senior principal scientist, SLS regulatory and validation consulting Group, Pall Life Sciences, gilbert_tumambac@pall. com. Benben Song, PhD, is a principal scientist, Xiaoxiang Li is lab supervisor, Gang Li, PhD, is a senior scientist, Wenan Lu, PhD, is a scientist II, Lin Liu is a scientist II, Chien-Ju (Cherry) Shih, PhD, is a senior scientist, and James Hathcock, PhD, is a senior director at Pall Life Sciences.
You May Also Like


