- Sponsored Content
- PAT
- Process Monitoring and Controls
Seamless Integration of Glucose Control: Using Raman Spectroscopy in CHO Cell CultureSeamless Integration of Glucose Control: Using Raman Spectroscopy in CHO Cell Culture
Sponsored by Eppendorf
The process analytical technology (PAT) and quality by design (QbD) guidelines promoted by the US Food and Drug Administration (FDA) and the European Medicines Agency (EMA) support the idea that quality cannot be “tested into” a biologic product but must instead be part of its process design. Seamless integration of analytical data with bioprocess monitoring and control is crucial to understanding a process and overcoming manufacturing challenges that arise in the course of development.
Monitoring of product quality attributes (PQAs) is a key element of QbD. Protein glycosylation, for one, affects important characteristics such as stability and immunogenicity. Thus, it is considered to be a critical quality attribute (CQA) ensuring the safety and potency of biopharmaceutical products submitted for regulatory approval.
Maintaining steady levels of glucose concentration in production bioreactors is key to control and optimization of process yields and product quality (1, 2). Manual bioreactor sampling and feeding can be costly, both in terms of labor and increased risk for contamination each time a sterile boundary is penetrated.

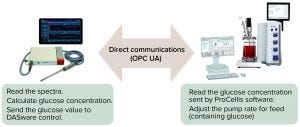
Figure 1: In this experimental setup, the analyzer communicates directly with the bioprocess control system to send the glucose concentration read from the bioreactor;
OPC UA = open-platform communications united architecture.
At Resolution Spectra Systems, we integrated our ProCellics Raman analyzer through open-platform communications united architecture (OPC UA) connectivity with DASware control software (Eppendorf) to optimize a bioprocess controlled by a BioFlo 320 bioreactor control system (Eppendorf). DASware control provides for easy integration of third-party devices. OPC UA facilitates its independent implementation into a process while being safer, more stable, and more flexible than older OPC systems (3). Along with the accuracy of the Raman analyzer, our ability to program complex feedback loops as functions of different parameters enables us to obtain stable glucose concentrations in the bioreactor without need for human interaction.
Material and Methods
Media: We used Gibco FreeStyle CHO-S cells cultivated in Gibco CD-CHO medium (Thermo Fisher Scientific) with 8 mM glutamine, 1% Gibco anticlumping agent, and 0.5% penicillin/streptomycin.
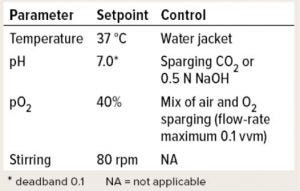
Bioreactor Control System and Process Parameters: For Chinese hamster ovary (CHO) cell cultivation, process monitoring, and control, we used an Eppendorf BioFlo 320 bioprocess controller and a water-jacketed 3-L glass bioreactor equipped with a ring sparger and a pitched-blade impeller. To control the experiment, we used DASware control software, version 5.4.1. Cells were inoculated into the bioreactor at a density of 0.4 × 10⁶ cells/mL, with a starting volume of 2 L. Table 1 lists the bioreactor process-control settings. To prevent background effects on Raman measurements, the bioreactor was shielded against external light.

Table 1: Process parameters and cultivation conditions
Feeding Strategy: The culture was fed with 15% v/v Gibco EfficientFeed B (Thermo Fisher Scientific) on day zero. Glutamine was added when the glucose concentration dropped <4 mM. On day three, constant glutamine feeding began. For glucose feeding, a control loop was programmed based on glucose concentration read by the ProCellics Raman probe to control the pump rate of feed B (containing glucose) through a DASware control 5 normal law and maintain a concentration of 5 g/L. The communication was integrated through OPC UA.
Model Building for Raman Monitoring: For ProCellics monitoring, a model-building step is needed to correlate reference values obtained by a BioProfile Flex2 analyzer (Nova Biomedical) and the ProCellics analyzer. Spectra were preprocessed on ProCellics software to create a dataset: standard normal variate (SNV) on the water region, Savitzky Golay derivative with 3 points (15 cm–1, polynomial order, second and first derivative) and spectral selection (350–1,775/cm + 2,800–300/cm).
Reference values were linked to their corresponding spectra automatically. Chemometric models for this monitoring were based on four standard fed-batch cultures (totaling 103 points). A partial least squares (PLS) model was computed for each monitored parameter using soft independent modeling by class analogy (SIMCA) software (Sartorius Stedim Biotech). We modeled viable cell density (VCD), total cell density (TCD), glucose, glutamic acid, ammonium, and lactate.
Raman Monitoring: The ProCellics in-line analyzer acquired and preprocessed Raman spectra and calculated process parameters including glucose concentration. Scheduled measurements were taken every 30 minutes. Following the above-described loop settings, the pump rate was adjusted based on those measurements, also every 30 minutes.
Third-Party Sensor Integration: Connectivity between the ProCellics Raman analyzer and the DASware control software was implemented using OPC UA.

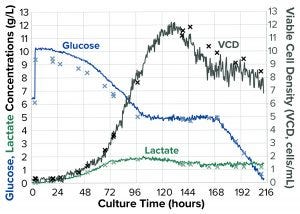
Figure 2a: Evolution of cell-culture parameters; × denotes an off-line measurement; solid lines trace Raman spectrometric monitoring results
Results and Discussion
Until day 4, glucose was consumed by the cells until a minimum set value of 5 g/L was reached. Then the programmed feedback loop (Figure 2a) precisely maintained glucose concentration at 5 g/L for three days. In parallel, glucose concentrations were measured off-line using a Flex2 process analyzer to confirm that the Raman analyzer accurately measured glucose concentrations. Feeding ceased when the maximum vessel volume was reached. The culture ended when glucose concentration in the vessel dropped <1 g/L.

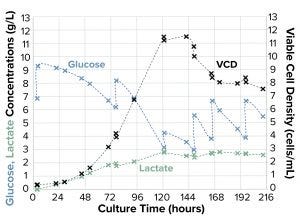
Figure 2b: Evolution of cell-culture parameters; all values are from off-line measurements.
For a control, we also performed a classic fed-batch run with manual glucose additions (Figure 2b). Cell growth kinetics and maximum cell density in the feedback-controlled run were comparable with those of this classical fed-batch control run. However, the lactate concentration in the feedback-controlled run ran lower (2 g/L) than that of the control run (3 g/L) — a noteworthy result because high lactate concentrations can be cytotoxic.
Proof of Concept
DASware control software enabled efficient and easy integration of the ProCellics Raman analyzer through secure OPC UA protocol. With this setup, we proved that the Raman system is fully ready for process automation. Once set up, automation of the feedback control loop was complete and reliable.
We achieved a great level of confidence in the extremely stable glucose concentration and accurate Raman measurements. This approach will make fewer human interactions needed for process monitoring and control, thus reducing the risk of contamination due to repeated sampling. Finally, the risk of batch failure from a lack of glucose overnight or on weekends also is reduced.
References
1 Berry BN, et al. Quick Generation of Raman Spectroscopy Based In-Process Glucose Control to Influence Protein Product Quality During Mammalian Cell Culture. Biotechnol. Progr. 32(1) 2016: 224–234.
2 Yuk IH, et al. Controlling Glycation of Recombinant Antibody in Fed-Batch Cell Cultures. Biotechnol. Bioeng. 108(11) 2011: 2600–2610.
3 Lange J, Iwanitz F, Burke T. OPC from Data Access to Unified Architecture (fourth edition). VDE Verlag GmbH: Berlin, Germany, 2010.
Célia Sanchez, Laure Pétillot, Fabrice Thomas, and Charlotte Javalet are with Resolution Spectra Systems, 13 chemin du Vieux Chêne, 38240 Meylan, France. Learn more about the method described herein at www.eppendorf.com/bioprocess or email [email protected].
You May Also Like


