Shear-Proof Design Space: Scaling Stirred-Tank Bioreactors for Cell Culture ProcessesShear-Proof Design Space: Scaling Stirred-Tank Bioreactors for Cell Culture Processes
February 9, 2023

HTTPS://WWW.ALAMY.COM
Establishing a cell culture process across different scales and models of bioreactors involves maintaining constant scale-independent parameters such as pH, temperature, and dissolved oxygen (DO). However, nonlinear and scale-dependent criteria (impeller agitation and gas flow rates) are adjusted on the basis of multiple normalized engineering parameters to accommodate the geometrical and design differences among bioreactors (1–3). Normalized engineering approaches for scaling parameterization often are based on the shear generated by impeller speed and gas flow rates. Kinetic energy transmitted into bioreactor fluid — from impeller rotation and the sparging gas — dissipates in the form of heat. That heat in turn generates a velocity gradient in the fluid known as shear, which is proportional to the energy dissipation rate (EDR), according to Equation 1 below (4).
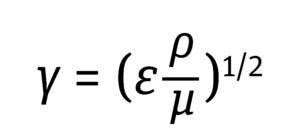
Equation 1
Because the EDR is predictable and can be used as a proxy to assess shear, many process scientists and engineers use it as a scaling factor in cell culture process parameterization. Herein, I review several bioreactor scaling methods, with a focus on the shear sensitivity of mammalian cells.
Shear Assessment of Scaling Impeller Speed
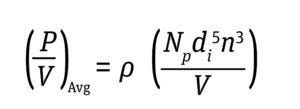
Average Impeller EDR (εAvg): Power is the energy consumed per unit of time. The power consumed by an impeller, averaged over the entire volume of the bioreactor, is expressed as power/volume (P/V). The P/V approach is used not only to scale the rotation speed for different sizes of same impeller design, but also to scale between different impeller designs and geometries because the impeller power calculation accommodates design differences in configuration (4, 5).

Equation 2
Typically, bioreactors are operated at a P/V as high as 50 W/m3 to prevent deleterious effects on cell health (7). Energy dissipation per unit volume thus is derived for a given bioreactor with Equations 2 and 3 below.
In those formulae, a dimensionless constant power number (Np) is used specifically for each impeller design. The impeller power number is independent of impeller speed when the number approaches a turbulent regime. Turbulence inside a stirred-tank bioreactor (STBR) is expressed by the ratio of the inertial force (an impeller’s drag force) to a viscous force that is defined as the Reynolds number (NRe) (4, 7) as in Equation 4 below.
Equation 3
The system is considered fully turbulent, or the impeller power number is independent of impeller speed, when NRe > 10,000 (4, 7, 12). Therefore, an impeller Reynolds number over 10,000 must be ensured to apply P/V as a scale-up strategy for setting impeller agitation rates.
Localized EDR: Although average P/V is widely used as a scaling parameter in the biopharmaceutical industry for determining impeller speed across a range of STBR scales, it does not account for the scale-dependent shear heterogeneity that normally is present inside a bioreactor. That heterogeneity is prevalent in large-scale STBRs especially, and particularly those models that are equipped with single impellers. One study has reported that 70.5% of the total power consumed by a pitched-blade impeller dissipates in the liquid volume near that impeller (6).

Equation 4
Hence, assessment of localized impeller shear is an important determination in successful scaling of cell culture processes in STBRs with pitched-blade STBRs.
Impeller Zone EDR (εMax): The maximum energy dissipation rate often is derived from the total power consumed by an impeller in relation to the volume swept by its blades. To provide further understanding, the impeller-zone EDR (εImp,Zone) expressed in m2/s3 is derived using Equation 5 below (8).

Equation 5
Researchers have observed no lethal effects on cell culture processes in STBRs with a maximum energy input as high as 1 × 10⁵ W/m3, with media formulated to include shear-ameliorating detergents (6).
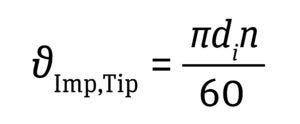
Impeller Tip Speed: The shear rate is defined as the change in fluid velocity over distance. In an impeller-based STBR, the highest fluid velocity is observed at the tip of the impeller blade as it revolves in the fluid. When constant P/V is used for scaling up a bioreactor process, impeller-tip velocity increases as bioreactor scale increases. Hence, that velocity often gets assessed during the scaling of impeller speed. Such assessments consider only the impeller diameter and agitation speed, but not the impeller design. For a typical cell culture process, maintaining an impeller-tip velocity <1.5 m/s has been recommended to prevent adverse effects on cell growth (5, 11). See Equation 6 below.
Equation 6
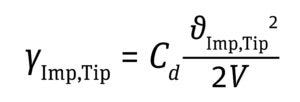
Shear Rate at the Impeller-Blade Tip: The shear rate at the tip of an impeller blade can be calculated based on the impeller-tip velocity by using Equation 7 below, in which Cd is the drag coefficient, with a value ranging 0.004–0.010 (13).
For axial- and radial-flow impellers, Cd values of 0.007 and 0.0095 (maximum Cd), respectively, provide good approximations to calculate the maximum shear at the tip of the impeller blade (13).
Equation 7
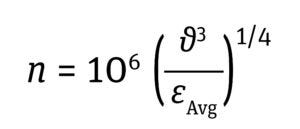
Impeller Microeddy Length: In an impeller-agitated bioreactor, mixing by fluid flow is characterized by swirling pockets of fluid (eddies) caused by the impeller agitation. As larger eddies break down into smaller ones along the fluid path, the higher energy from their larger forms is transmitted to those smaller eddies. Their size is defined as the Kolmogorov (microeddy) length. Microeddies that are smaller or equal in size to cells in culture are considered to be detrimental to cell heath (11, 14). Because most mammalian cell sizes are <20 μm, it is recommended to maintain the Kolmogorov eddy length at >20 μm, as in Equation 8 below.
Equation 8
Shear Assessment of Sparged Gas Flow Rates
Next I examine gas-induced shear forces and how to assess them in scaling. Two widely used parameters to maintain constant in scaling gas flow rate in cell culture bioreactor operations are the gas volumetric rate per bioreactor unit volume — expressed as a volume of air per unit volume of liquid per minute, (VVM) — and the linear gas velocity (defined as the ratio of volumetric gas flow rate to the bioreactor cross-sectional area). Both parameters directly influence shear across different bioreactor scales, and keeping them constant does not account for differences in sparger configurations and designs that often are unique to bioreactor models and manufacturers. Shear introduced from sparging gas into a bioreactor system is assessed using normalized engineering parameters during bubble generation. Then bubbles rise through the bioreactor’s liquid height, reach the fluid surface, and burst.
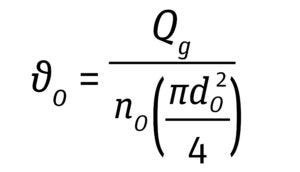
Gas Entrance/Sparger Hole Velocity: The gas-entrance velocity at the sparger orifice is defined by the ratio of volumetric gas flow rate to the cross-sectional area of a single hole in the sparger. A velocity >30 m/s has been shown to cause cell damage by decreasing cell viability and productivity (Equation 9, below) (15).
Equation 9
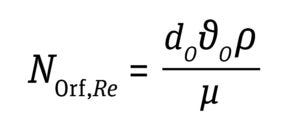
Orifice Reynold’s Number: The kinematic behavior of bubbles is characterized based on bubble formation. Four regimes of gas-bubble formation are observed with increasing gas flow rate through the bioreactor sparger: discrete bubble, chain bubble, jetting regime, and turbulent regime. When a bioreactor approaches a jetting regime at a typical impeller speed used for cell-culture conditions, bubbles rise through the tank and are not dispersed well by the impeller. The gas-jetting regime is approached when the orifice Reynolds number approaches 2,000. Thus, in setting gas flow rates, the orifice Reynolds number should be maintained below 2,000 (Equation 10, below) (16).
Equation 10
Bubble Wake Eddy Length: As bubbles rise through a bioreactor, circulating fluid carried behind them (the bubble wake) experiences the most drag force. Assessments of shear during bubble rise should consider the EDR from the bubble wake and the associated microeddy length. The latter can be predicted in sequential steps of calculations as summarized in the “Calculation” box above. Similar to the Kolmogorov eddy length (which is associated with impeller speed), a bubble wake microeddy’s length that is less than or equal to the size of cells in a culture is considered to be detrimental to their health. Hence, that length should be maintained at >20 μm for most mammalian cell culture operations to prevent negative effects on cell growth due to associated shear (16, 17).
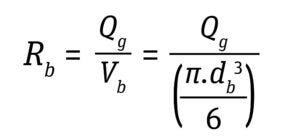
Stress During Bubble Bursting at the Liquid Surface: Most cell death in bioreactors is caused by shear created when bubbles burst at the fluid surface (6). The cell death rate constant (1/s) from bubble bursting is proportional to the number of cells attached to the bubble-film volume per bioreactor volume, as is given by Equation 11 below, where the following Equations 12 and 13 apply.

Equation 11
Equation 12

Equation 13
For typical cell culture media with a Pluronic concentration of 1 g/L, a film thickness (δ) of 50 μm and a factor of bubble film to cell attachment (∈) of 0.4 per 106 cells/mL provides a good approximation to calculate the cell-death rate due to bubble bursting (18). Cells have been reported to tolerate shear produced by drilled holes or open-pipe gas spargers better than that produced by microspargers.
Focus on Cell Health
P/V and VVM are the most widely used methods for developing scale-up and scale-down models of cell culture operations in stirred-tank bioreactors. However, neither approach includes consideration of localized shear, which affects cell health. Herein, I summarize tools and design-space considerations for assessing localized shear. In performing such assessments, you also should design operating conditions to meet gas-transfer requirements: e.g., the oxygen transfer rate to meet cell respiratory demands and the CO2 transfer rate to enable efficient pH control in the culture.
References
1 Manahan M, et al. Scale-Down Model Qualification of Ambr® 250 High-Throughput Mini-Bioreactor System for Two Commercial-Scale MAb Processes. Biotechnol. Prog. 35(6) 2019: e2870; https://doi.org/10.1002/btpr.2870.
2 Harmsen M, Stofferis J, Malphettes L. Development and Fine-Tuning of a Scale Down Model for Process Characterization Studies of a Monoclonal Antibody Upstream Production Process. BMC Proc. 5(S8) 2011: 70; https://doi.org/10.1186/1753-6561-5-S8-P70.
3 Raja V et al. Challenges in Scaling Up a Perfusion Process. BMC Proc. 5(S8) 2011: 122; https://doi.org/10.1186%2F1753-6561-5-S8-P122.
4 Pérez JS, et al. Shear Rate in Stirred Tank and Bubble Column Bioreactors. Chem. Eng. J. 124(1–3) 2006: 1–5; https://doi.org/10.1016/J.CEJ.2006.07.002.
5 Nienow AW. Reactor Engineering in Large Scale Animal Cell Culture. Cytotechnol. 42(1) 2003: 21–33; https://doi.org/10.1007/s10616-006-9005-8.
6 Hu W, Berdugo C, Chalmers JJ. The Potential of Hydrodynamic Damage to Animal Cells of Industrial Relevance: Current Understanding. Cytotechnol. 63(5) 2011: 445–460; https://doi.org/10.1007/s10616-011-9368-3.
7 Nyberg G, et al. Modeling of Biopharmaceutical Processes — Part 1: Microbial and Mammalian Unit Operations. BioPharm Int. 21(6) 2008; https://www.biopharminternational.com/view/modeling-biopharmaceutical-processes-part-1-microbial-and-mammalian-unit-operations.
8 Daub A, et al. Characterization of Hydromechanical Stress in Aerated Stirred Tanks up to 40 m3 Scale By Measurement of Maximum Stable Drop Size. J. Biolog. Eng. 8(1) 2014: 17; https://doi.org/10.1186%2F1754-1611-8-17.
9 Ma N, Koelling KW, Chalmers JJ. Fabrication and Use of a Transient Contractional Flow Device To Quantify the Sensitivity of Mammalian and Insect Cells to Hydrodynamic Forces. Biotechnol. Bioeng. 81(3) 2002: 379–379; https://doi.org/10.1002/bit.10387.
10 Sieck JB, et al. Development of a Scale-Down Model of Hydrodynamic Stress To Study the Performance of an Industrial CHO Cell Line Under Simulated Production Scale Bioreactor Conditions. J. Biotechnol. 164 (1) 2013: 41–49; https://doi.org/10.1016/j.jbiotec.2012.11.012.
11 Marks DM. Equipment Design Considerations for Large Scale Cell Culture. Cytotechnol. 42(1) 2003: 21–33; https://doi.org/10.1023/A:1026103405618.
12 Dreher T, et al. Design Space Definition for a Stirred Single-Use Bioreactor Family from 50 to 2,000 L Scale. BMC Proc. 7(S6) 2013: 55; https://doi.org/10.1186/1753-6561-7-S6-P55.
13 Wu J, Graham LJ, Mehidi NN. Estimation of Agitator Flow Shear Rate. AIChE J. 52(7) 2006: 2323–2332; https://doi.org/10.1002/aic.10857.
14 Grein TA, et al. Aeration and Shear Stress Are Critical Process Parameters for the Production of Oncolytic Measles Virus. Front. Bioeng. Biotechnol. 7, 2019: 78; https://doi.org/10.3389/fbioe.2019.00078.
15 Zhu Y, et al. NS0 Cell Damage By High Gas Velocity Sparging in Protein-Free and Cholesterol-Free Cultures. Biotechnol. Bioeng. 101(4) 2008: 751–760; https://doi.org/10.1002/bit.21950.
16 Varley J, Birch J. Reactor Design for Large Scale Suspension Animal Cell Culture. Cytotechnol. 29(3) 1999: 177–205; https://doi.org/10.1023/A:1008008021481.
17 Chisti Y. Animal-Cell Damage in Sparged Bioreactors. Trends Biotechnol. 18(10) 2000: 420–432; https://doi.org/10.1016/s0167-7799(00)01474-8.
18 Tan WS, Dai GC, Chen YL. Quantitative Investigations of Cell-Bubble Interactions Using a Foam Fractionation Technique. Cell Culture Engineering IV 1994: 321–328; https://doi.org/10.1007/978-94-011-0257-5_35.
19 Xu S, et al. Impact of Pluronic® F68 on Hollow Fiber Filter-Based Perfusion Culture Performance. Bioproc. Biosys. Eng. 40(9) 2017: 1317–1326; https://doi.org/10.1007/s00449-017-1790-2.
Naveenganesh Muralidharan is a senior engineer in manufacturing science
and technology for Novartis Gene Therapies, 1940 USG Drive, Libertyville, IL
60048; 1-314-496-8483; [email protected];
www.novartis.com. The views and opinions expressed in this document are
those of the author and do not necessarily reflect the official policy or position
of Novartis or any of its officers.
You May Also Like


