Cell-Culture–Based Influenza Vaccine Manufacturing: Evaluation of Near-Infrared Spectroscopy for In-Line Determination of Virus TitersCell-Culture–Based Influenza Vaccine Manufacturing: Evaluation of Near-Infrared Spectroscopy for In-Line Determination of Virus Titers
JUPITERIMAGES (WWW.GETTYIMAGES.COM)
Each year, over 20% of the human population is infected with the influenza virus, resulting in 250,000–500,000 related deaths globally and ~38,000 deaths in the United States alone. Of further concern is the potential for pandemic outbreaks, which pose a severe worldwide threat to public health (1, 2). Vaccination has proven to be a critical tool for controlling the spread of infectious diseases, as evidenced by the eradication of polio, smallpox, and diphtheria in most parts of the world.
Influenza presents a unique challenge compared with those viruses: Two main viral-surface glycoproteins — hemagglutinin (HA) and neuraminidase (NA) — cause an immune response and the resulting flu-like symptoms. But they experience antigenic drift and shift that enable new mutant virions to evade detection by host antibodies. Thus, flu pandemics can reoccur. Although vaccination is the most effective means of preventing influenza infection, new vaccines must be created each year to target the latest and most prevalent virus mutations (3).
Seasonal flu vaccines consist of three virus strains selected by the World Health Organization (WHO) based on surveillance data from the previous year. Those selections typically are made in February to generate a trivalent vaccine that will be ready for distribution in September. Vaccine manufacturers must adhere to tight production schedules, with little time for opportunities to improve process titers and yields (4).
Traditional production of flu vaccines involves infection and subsequent harvest of the allantoic cavities in embryonated chicken eggs. This method dates to the 1940s, when in response to a 1943 epidemic of influenza A inactivated vaccines first were made from wild-type viruses that were adapted to replicate in eggs (5). But after decades of industrial manufacturing experience and regulatory documentation in terms of safety, some major drawbacks to this technology have arisen.
One main drawback is intrinsic to the process itself, which selects for virus subpopulations that are more able to replicate in eggs but not representative of the natural virus. Amino-acid substitutions in HA surface proteins (often antigenically significant) routinely occur in these egg-adapted variants, lessening the effectiveness of resulting vaccines (6, 7). Another major drawback is the supply of eggs if a pandemic occurs. It takes time to produce enough eggs from regulated flocks of hens, and the current egg-based manufacturing capacity is insufficient to provide vaccines for the entire US population. At least six to nine months are required for egg-based processes to begin making vaccines, which is unacceptable in the case of a pandemic. Past outbreaks have reached the United States within two to five months of emerging in Asia.
For yearly influenza vaccines, the time constraints of egg-based processes also increase the risk of a mismatch to the actual virus strains that are circulating when patients receive their vaccinations (3, 8). Egg-based production may not even be a possibility if a pandemic is avian in origin because avian viruses would kill the fertile eggs. Other drawbacks to this approach include
a high risk of microbial contamination (because of the relatively “open” nature of egg-based processing conditions), which has led to vaccine shortages in the past
the presence of egg-derived proteins in the vaccines, which routinely causes allergic reactions in some recipients (9).
It has become evident that a more robust production method will be critical to the future success of the influenza vaccine industry. Some developers are exploring cell-based manufacturing as an alternative (10, 11).
Mammalian cell culture is an established technology for production of therapeutic proteins, monoclonal antibodies (MAbs), and some select vaccines. But the transition from egg-based flu vaccine manufacturing began over 50 years ago and is still in progress today (12). Cell-based production could yield more vaccine in less time, which is of prime importance for dealing with pandemic outbreaks. Processing occurs in a closed and controlled environment, which limits the potential for contamination. This approach facilitates implementation of advanced process-control strategies to ensure that quality not only is maintained, but is designed into manufacturing processes. One cell line has been developed for propagating influenza viruses. Originating from Madin-Darby canine kidney (MDCK) cells, its advantages include adaptability to suspension culture and a propensity to produce high virus titers quickly (13).
Compared with allantoic fluid, the raw materials and substrates required for cell-culture–based vaccine production are better defined or characterized. Cell culture eliminates the issue of allergic reactions to residual egg proteins, and the scalable nature of the process allows for greater flexibility of production in response to increased demand. Flu viruses from cell culture are more like the primary human virus strain and thus induce a greater protective response (3, 14). However, cell-based production platforms do suffer from variability in volumetric productivity depending on their host cell line and culture conditions.
Process Development and Optimization Strategies
A cell line must exhibit consistent performance for replicating a range of virus strains. Initial development of an influenza vaccine biomanufacturing process must provide a platform that will not require extensive change-control activities or regulatory reapproval with ever-changing virus strains. Developers must consider that they will have limited time for process optimization to increase yields from year to year. Their processes therefore must be robust and relatively insensitive to the differences in new strains, thus providing a high level of consistency.
Despite current regulatory controls, the US Food and Drug Administration (FDA) has identified a need for biomanufacturers to shift process development/production from an empirically based approach relying on end-product testing to a more rigorous science-based approach using risk-assessment tools and based on the principles of quality by design (QbD). Those principles include the need for real process understanding, in-process testing using process analytical technologies (PATs), feedback control, and continuous improvement over the life cycle of each product. QbD is meant to build quality into bioprocesses instead of relying on final-product testing. It requires process understanding: in-depth knowledge of how process inputs affect performance. Process parameters and performance interactions should be understood over a broader range than what would be specified for achieving acceptable product quality (15).
For the biopharmaceutical industry to achieve those quality goals, it needs increased process understanding at the design stage. Cell growth and product formation is a dynamic process that can be controlled only based on an understanding of how environmental factors interact with metabolism at the cellular level. Those relationships are elucidated best using in-line or on-line instrumentation that enables real-time monitoring of cell performance. Sophisticated in-line near-infrared (NIR) spectroscopic fingerprinting of cell metabolism and virus production could provide a rigorous scientific process development platform for cell-culture–based vaccine manufacturing. Such a platform could facilitate a robust in-process control strategy for conventional modes of feeding as well as to monitor infection levels to determine the optimal harvest time.
Monitoring Cell Metabolism and Virus Production
The ability to monitor constituents using NIR spectroscopy (NIRS) hinges on the use of advanced mathematical modeling (chemometrics) to develop calibration models relating spectral properties with quantitative results. This is extremely crucial because NIRS peaks are broad and overlapping.
Chemometrics applies multivariate empirical models to data for
extracting meaningful results. The term was coined by Swedish scientist Svante Wold in 1971 to describe the application of mathematical and statistical methods to analytical chemical measurements (16). It is a practical application of mathematics that has evolved to play a major role in analytical chemistry. Spectroscopy-based analytical methods are very well suited to chemometric applications, but their spectra often contain pertinent information that can be difficult to interpret. NIRS particularly suffers from broad and overlapping peaks that create complex data matrices requiring chemometrics to extract essential information. Chemometric models are strictly empirical (“soft”) and come from a limited set of available data. Extrapolation is not advisable, therefore, and it is critical for a model to contain all possible data variation that might be found in a process. To test their true effectiveness and functionality, researchers also must validate such models with data sets that were not used to create them (17).
With an ability to monitor an essentially unlimited number of process analytes in-line, NIRS has great potential for bioprocess optimization and control. It has recently been adopted for use as a principal tool in PAT systems for the biopharmaceutical industry, where integration of such systems compares poorly with other industries (18, 19). That has been hindered by a relative lack of professional NIR practitioners and a generally proprietary environment in the industry (20, 21). To date we have seen no published attempts at using NIRS to monitor influenza virus infection and production in real time. Deeper process understanding and effective use of real-time monitoring to enhance and speed up process development are critical to vaccine manufacturing of influenza virus, especially for pandemic preparedness. So we sought to elucidate the full potential of NIR in our research.
Materials and Methods
Shake-Flask Proof-of-Concept Study: First we performed a proof-of-concept study to determine whether it was possible to use NIRS to monitor virus concentration. All cell culture activities herein used Ex-Cell media (SigmaAldrich) supplemented with 4mM (final concentration) Gibco glutamine (Invitrogen) for growth and Dulbecco’s modified Eagle’s medium (DMEM) during infection (Corning) supplemented with TrypZean trypsin (Sigma-Aldrich) at a final concentration of 1 mg/L for virus production.
Each experiment began with a 1-mL working cell bank (WCB) vial of MDCK cells that was thawed and added to 9 mL of growth media in a 15-mL Falcon centrifuge tube (Corning). We spun down those cells and aspirated the resulting supernatant to remove the freezing media before resuspending the cells in 10 mL of growth media. Then we transferred them to a 250-mL shake flask with 40 mL of growth media and placed that into a CO2 incubator at 37 °C with 5% CO2, and 110-rpm rotation. Our target starting cell density was 0.2–0.4 × 10⁶ c/ells/mL.
The culture continued for two to three days until reaching a cell density of ~2 × 10⁶ cells/mL, when we added 50 mL of infection media to bring the total volume to 100 mL at a cell density of 106 cells/mL. After thawing a PR/8/34 H1N1 influenza virus stock (107 TCID50 units/mL), we added 10 µL of that to each of 12 shake flasks for a multiplicity of infection (MoI) of 10–3, then incubated the flasks at 35 °C. On days 1, 2, and 3 postinfection, we took 8-mL samples from each flask aseptically in a biosafety cabinet using Falcon tubes wrapped in Kimwipes (Kimberly-Clark) wipers to block light.
NIRS: We used an FTPA2000 Fourier-transform infrared spectrophotometer (ABB Group) in conjunction with a 12-mm ABB NIR transflectance probe to acquire at-line sample spectra of those samples. Each sample and background spectrum consisted of 128 and 1,024 apodized scans, respectively, the background spectra collected in air before each set of shake-flask measurements. Once each scan was complete, we took 1 mL from the sample, spun that down, and removed the supernatant before diluting the sample using a serial dilution to perform a hemagglutination assay.
Hemagglutination (HA) Assay: This assay would determine the relative concentration of HA surface protein on flu virus particles produced. We could use the resulting data for chemometrics and calibration models to determine whether NIRS was suitable for HA determination of virus concentration. Each HA assay was performed inside a biosafety cabinet, and all dilutions were made across entire plates. We prepared V-bottom 96-well microplates by adding 50 µL of 0.1 M phosphate-buffered saline (PBS) and pH 7.2 buffer to each well. Then we added 100 µL of sample supernatant to the first well (one sample each in rows A1, B1, C1, D1, E1, F1, and G1) and 100 µL of negative control (PBS) to well H1. For twofold dilutions a multichannel pipette was used to aspirate 50 µL from wells A1–H1 and dispense into wells A2–H2. The same process continued, using the same tips, until wells A12–H12 were reached. Finally, 50 µL were aspirated and discarded from the last columns (A12–H12).
Subsequently, we added 50 µL of rooster red–blood-cell solution (0.5% erythrocyte solution in PBS) to all microplate wells (A1–H12) before covering each microplate with an adhesive plate sealer and gently shaking it to ensure that those blood cells were dispersed evenly. We incubated the microplates for 45 minutes at room temperature, then by observation determined the titer of HA units (HAU) based on the dilution level at which blood cells fell out of solution without virus forming a lattice network between them.
We performed five additional shake-flask experiments without infection, with 8-mL samples taken on days 0, 1, 2, 3, and 4 of growth for NIRS scans as above. In addition, we kept 2 mL to analyze for lactate, ammonium, glucose, and glutamine using a Bioprofile 400 instrument (Nova BioMedical). We used the resulting data to generate our calibration models for correlating changes in spectra with those in analyte concentration.
Chemometrics: For NIRS data collection, spectral processing, and model development, we used GRAMS/ AI software version 7.0 (Thermo Fisher Scientific). To create a training data file (.tdf), we used data sets based on spectra and related reference data (generated as above) loaded into the GRAMS/AI PLSplus/IQ navigator. The software then performs spectral preprocessing (derivatives, baseline corrections, smoothing, normalizations, and mean centering) to identify areas of correlation between spectral wavelength regions and constituent concentrations.
After developing that calibration, we used the software to perform statistical analysis on crossvalidated data. Crossvalidation is the process of removing one sample from a data set and predicting it using a calibration generated from the remaining samples — repeated for each data point in the set before statistical analysis. Then predicted values and actual values are compared to evaluate a model’s validity. We used results from our statistical analysis — actual/predicted plots, residuals plots, and standard error of cross validation (SECV) — in an iterative process to modify our calibration (preprocessing parameters, selection of spectral regions, outlier identification and removal, and so on) until results were satisfactory. We did this for each of the following constituents from the shake-flask samples: lactate, ammonium, glucose, glutamine, total cell count, and (most important) virus HA concentration. Then we generated a model for HA concentration from the final calibration and used that to predict concentrations from on-line spectral scans taken in the validation batch.
Hemagglutination HA Assay Development: Samples with identical HA values showed marked spectral differences because of the assays’ twofold dilution series. That yielded inaccurate models, so we investigated ways to improve the standard HA assay. Modifications included running multiple lanes for each sample and taking an average, performing additional dilutions around the value obtained from an initial standard assay, and using a novel microscope technique. For the latter, we used a standard microscope with a ruler fixed on its eyepiece to measure the diameter of blood spots that formed, then calculated the resulting area. A negative control could be used to measure the diameter of blood without virus present (ANC).
 Standard twofold dilution regularly exhibited a well with no spot followed by a smaller spot (intermediate) with an area (AS) and then a spot similar to the one formed with the negative control. As such, we performed a calculation using the ratio of intermediate area (AS) divided by the negative area (ANC) multiplied by the HAU value of the last well with no spot formation (HAUNS) according to the equation below. That new HAU value was used as the HAU concentration for our NIRS calibration models.
2-L Bioreactor Runs and Virus Model Validation: Cultures were initiated as above. However, after the initial two days of cell growth, we added 50 mL of growth media to the 250-mL shake flask for seed expansion. After two more days, we added that 100 mL to another 400 mL of growth media in a 2-L (total volume) Sartorius Stedim Biotech rocker bag operated at 37 °C, 0.1 vvm airflow with 5% CO2, and 17 rocks/minute. After two days, when that culture reached ~2 × 10⁶ cells/mL, we transferred the full volume into a 2-L glass bioreactor (also from Sartorius Stedim Biotech), which had been autoclaved and prepared with 500 mL of infection media (1 L total working volume). We had measured an ABB NIR transflectance probe’s background in air before installing and autoclaving it in the bioreactor.
After transferring the MDCK cells from the rocker bag to the 2-L bioreactor, we added 100 µL of PR8 virus stock for a MoI of 10–3. With agitation set to 100 rpm and temperature controlled at 35 °C (0.1vvm airflow and 4% CO2), three runs were executed to build data using the novel HA method above, and a fourth run was performed to validate the model. We took 19 samples for analysis using the assay-based reference methods above to determine HA concentration.
Results and Discussion
To determine the suitability of NIRS for real-time measurement of influenza virus, we built a calibration model and verified its performance. A common procedure generally is followed to construct such a model: spectral data acquisition, preprocessing and transformations of those data, principal component analysis (PCA) to model the spectra, partial least squares (PLS) to generate a prediction model, and then at least one validation batch to test the final model.
Shake-Flask Study and Chemometric Modeling: Our first step in building a calibration model for influenza virus was to run 12 shake-flask infection experiments, take scans at regular intervals, and sample for HA analysis. It was crucial at this stage to obtain data over the desired operating range of the model, with a sufficient number of batches to fully describe the acceptable variability of the process.
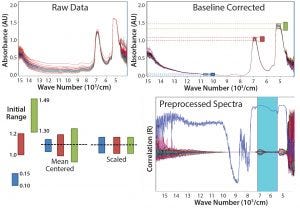
Figure 1: Common preprossessing and data transformation techniques for spectra before model building; data must be mean-centered and scaled to obtain the spectra shown on the bottom right
Figure 1 shows the progression of raw spectra (top left) that is base-line corrected (top right), with mean centering and scaling applied (bottom right). Spectra in the NIR region are influenced by nonlinearities arising from light-scattering effects caused by particles in sample media such as cells and insoluble compounds (which cause base-line shifts) as well as bubbles and density fluctuations, just to name a few. We minimized those effects by applying the preprocessing and data-transformation techniques in Figure 1. The main scatter-correction methods are multiplicative scatter correction (MSC), standard normal variate (SNV), and normalization — all of which estimate correction coefficients and apply them in slightly different ways. Baseline corrections and derivatives are common additions; however, some information is lost with each derivative. Applying too severe a technique can remove valuable information.
We modeled all the spectra using PCA without relationship to reference data — referred to as “unsupervised classification” because no sample information is provided, and classification occurs based only on the spectra itself. The PCA model reduced the large number of initial variables (in this case, absorbance at different wavelengths for a number of samples) by projecting them onto a few latent variables (or principal components, PCs) that described most variation in the original variables. The first PC described the greatest amount of original data, with each subsequent PC containing less than the previous. Orthogonal PCs are uncorrelated.

The above equation is the general calculation for this model in which X is the entire matrix of data (which was extremely large), T and P’ are scores and loadings for each PC, and E represents the residual matrix of information that was not described by the model.
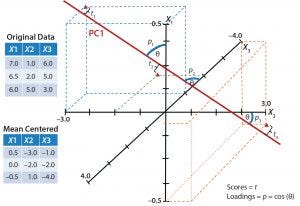
Figure 2: Simplified graphical example shows one principal-component axis (PC1) derived from three variables X1, X2, and X3. Data points are mean-centered and scaled before they are plotted and the best-fit plane (PC1) is drawn. Scores (t) are related to the projection of each point onto the plane, and loadings (p) refer to how closely related the original axis was to the new plane.
Figure 2 is a simplified graphical representation in which one latent variable (PC1) describes three initial variables (X1, X2, and X3). Each score is related to the projection of an original variable onto the PC plane. Loadings are related to the proximity of the original variable vector to the PC plane — acting as weights for those original variables. A greater weight is given to variable vectors that more closely align (correlate better) to the PC plane. With a PCA model built, we could visualize multivariate data based on the main PCs.
The left plot in Figure 3 contains residuals for each data point that relates to information not described by the model using three PCs. This can be useful in determining outliers such as with samples 5, 13, and 18. On the right of Figure 3 is a scatter plot of PC1 and PC2 scores for each sample, which helps identify outliers and clusters. The latter can be visualized or identified using techniques based on geometric properties of the scatter plots (e.g., Mahalanobis distances or nearest-neighbor classifications in which points of a certain distance from three other points in a cluster are considered to be members of that cluster). Such cluster identifications are referred to as “supervised classification,” and additional context can be added to help describe them. Based on visual observation, we saw three main clusters of data points when comparing the score values from PC1 with those from PC2. When adding context to each cluster, it became evident that most samples in cluster A had been taken one day postinfection, in B two days postinfection, and in C three days postinfection. So on a spectral level, distinct differences seem to come through the infection period, suggesting that PC1 might be related to virus concentration.
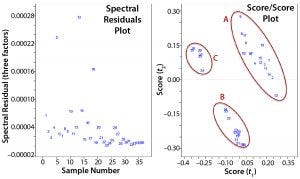
Figure 3: Two plots were used to evaluate a principal component analysis model; (left) comparing residuals of the spectra produced from the model with original spectra using three factors or principle components; (right) comparing scores for the first and second principle components, which are orthogonal to each other.
Another supervised technique is linking a qualitative PCA model to specific sample properties using PLS, thus developing a quantitative prediction model. The initial step in building such a model is determining which spectral wavelength regions correlate well with specific analytes. The shape and position of those regions (absorbance bands) contain analyte-specific information, which is then related to concentration. Spectral data must be processed, beginning with baseline normalization to eliminate slope and drift effects, then applying path-length correction to eliminate instrument batch variability. This is an iterative procedure in which different spectral areas are isolated and preprocessed using different techniques. Some samples are removed as outliers to help generate a better model without sacrificing potentially critical spectral data.
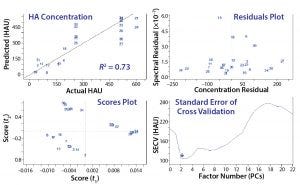
Figure 4: Common evaluation plots from two partial least squares (PLS) prediction models; crossvalidation is used to evaluate prediction accuracy, and residuals indicate samples that are not well described on a spectral level. Scores plots are beneficial for evaluating outliers or clusters, and the standard error helps to identify the required number of principal components required to describe most variations.
That procedure often generates 20 or more models to evaluate based on the two plots in Figure 3 and crossvalidation results (Figure 4). The top grouping of four plots came from an initial model, and the bottom four came from a more refined model. The procedure is highly subjective, both a science and an art. Both groupings show that as each additional PC (or factor) is added to the model, residual error decreases until too many PCs have been selected and noise is integrated into the model, causing error to increase. We determined the number of factors or PCs required to minimize spectral residual adequately based on this plot.
Residual error generally will continue to decrease as more factors are included because of increased spectral information in the model. However, it’s important not to overmodel the data with too many factors. Too many factors increase a model’s specificity to a particular data set, thus decreasing its ability to predict spectra from other samples. Outlier detection is based on how close predicted values are to actual concentrations according to the spectral residual of a sample. The bottom grouping in Figure 4 yields low error with the same number of factors as the top grouping, has lower overall residuals, and exhibits a better crossvalidated R2 value.
Because those results were promising, we executed three 2-L bioreactor runs to build an HA calibration model. We also generated models from five shake-flask growth runs for glucose, lactate, ammonia, glutamine, and total cell count. As expected, the crossvalidated actual/predicted plots for each model (see the “Crossvalidated Results” box) indicate the potential for real-time monitoring of these parameters. Because that has been demonstrated elsewhere (18, 19), our main focus in subsequent bioreactor runs was on developing a novel real-time measurement of HA using NIRS.
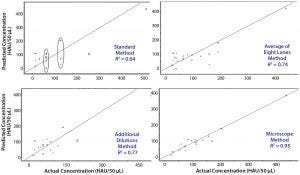
Figure 5: Four variations of the same PLS model; in each case, a different reference method was used to generate the actual concentrations. The standard method (top left) shows spectral variation in samples with the same actual concentration result; averaging multiple assays (top right) or performing additional dilutions (bottom left) show improvement; however, the best results are obtained using a novel microscope method (bottom right).
HA Reference Method and Model Development: The PLS model results in Figure 4 revealed obvious spectral differences for samples that showed the identical value of HA based on the reference method used. That forced us to reevaluate our existing blood-based method, considering three possible improvements to increase its sensitivity. We selected the most effective analytical method for determining virus titer as our reference method for building a final model for use with a validation batch.
This investigation was difficult because we had no way to determine the correct HA concentration as a benchmark to help us evaluate any new method’s results. Therefore, because NIRS is extremely sensitive and had been shown to be capable of identifying spectral variations in samples with different HA concentrations, we used the final calibration model from our initial shake-flask study as the benchmark. We took 19 samples from three 2-L bioreactor infection batches and performed four methods as described above to determine HA. By inputting the resulting HA values into the model, we could use it to determine their effectiveness.
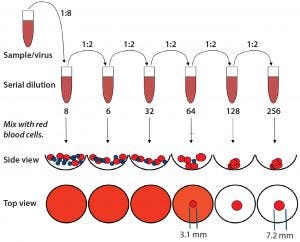
Figure 6: Representation of the standard hemagglutination assay (HA) used to determine hemoglutanin concentration; measurements (in millimeters) were performed using a microscope. The standard assay result yields a value of 32; however, it is evident that additional virus is present (calculated based on the resulting area of the intermediate blood-spot formed).
Figure 5 shows crossvalidated results from the different assays. In each case, preprocessing (mean centering, scaling, and baseline correction at 1,300 and 1,700 cm–1) and the wavelength regions for analysis (1,484–1,625 and 2,100–2,140 cm–1) remained the same. The only change was to input results from each reference method to build the PLS regression using spectral data for each sample. Clearly the standard method yields the poorest fit because of the dilution series. As we noted above, reference values with the same concentration are different according to their spectra. The first attempted improvement was to run multiple (eight) assays of the same sample and take their average value, which yielded better results — as did performing a second assay with additional dilutions around the results of the initial assay. However, the most marked improvement came from measuring blood-spot diameters and calculating their areas (AS). We used the ratio of the blood spot formed with no virus (the negative control area, ANC), and that formed in the last well with some virus present to determine the true HA concentration.
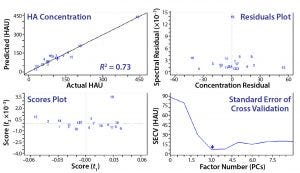
Figure 7: The final-model evaluation results indicate that three factors or principal components are required to describe most variation. Concentration and spectral residuals were reduced by factors of 5 and 10, respectively, and the R2 increased from 0.64 to 0.95.
Figure 6 is an example of an assay for which the standard protocol would determine that concentration to be 32 HAU/50 µL. Using 1 + (1 – AS ÷ ANC) with diameters from Figure 6 and multiplying by the original 32 HAU/50 µL, we obtained a value of 58 HAU/50 µL. As Figure 7 shows, that yielded a much better result according to our model statistics, with the overall fit improved from R2 = 0.64 to R2 = 0.95. Spectral and concentration residuals were decreased 10- and fivefold, respectively, and the standard error was reduced from 120 to 20 HAU/50 µL. So we used this model to predict real-time HA concentrations in a final validation batch.
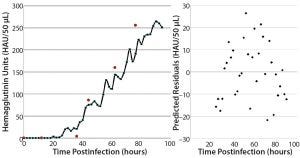
Figure 8: Validation batch results; (left) real-time (solid line) evolution of HA concentration over time and off-line assay results (red dots) from samples taken during the run; (right) prediction residuals of each scan for determining concentration bias in the model.
2-L Bioreactor Validation Batch: The true verification of a calibration model’s validity is to test it in a run that was not used in its development. For this purpose, we executed a fourth 2-L bioreactor run as we had the first three. Figure 8 plots HA concentration values from the time of infection until harvest on the left, with a residuals plot of each prediction on the right. Overall, the in-line values from the NIR probe correlate well with the off-line values obtained using the reference method. Plotting a best-fit line to those in-line results enables calculation of residuals to look for prediction bias based on HA concentration. Scattering indicates that the model is biased slightly negatively at higher concentrations.
Comparing the prediction results with reference data shows the same trend. A possible explanation is that that 19 samples represent a very small set to use for building a robust model. In addition, most samples fell in the range of 50–150 HAU/50 µL — where the model performed best in its predictions. Averaging the differences between predicted and reference values (over the span of measurements) yields an error of 20.5 HAU/50 µL. Integrating more samples into this model should give more accurate and robust results, but our current findings are better than acceptable and indicate a more accurate result than the current standard method provides.
Quantifying Viruses in Production
The need for a process development platform that can enable efficient scale-up and production of influenza virus is crucial especially for pandemic preparedness. Although a cell platform and growth kinetics can be maintained from year to year, the process variation that requires continued development comes from the virus strain and how it replicates in cells. Until now, the main methods of determining virus replication kinetics have been off-line and imprecise.
Here we have shown the potential to improve on the accuracy of those existing methods as well as to determine HA concentration in real time by using NIRS. This would be important to developing infection rates and harvest times that quickly optimize virus production. Our results show that combining this novel application of NIRS with a proven ability to monitor cell density and specific analytes, can help define cell “vitality” and virus concentration for the duration of infection until final influenza virus harvest.
Acknowledgments
We acknowledge the generous support of the Biomanufacturing, Training, and Education Center (BTEC) at North Carolina University.
References
1 Belsey M, et al. Growth Drivers and Resistors of the Influenza Market: The Importance of Cell Culture Flu. J. Commerc. Biotechnol. 12(2) 2006: 150–155.
2 Wong S-S, Webby RJ. Traditional and New Influenza Vaccines. Clin. Microbiol. Rev. 26(3) 2013: 476–492.
3 Le Ru A, et al. Scalable Production of Influenza Virus in HEK-293 Cells for Efficient Vaccine Manufacturing. Vaccine 28(21) 2010: 3661–3671.
4 Gerdil C. The Annual Production Cycle for Influenza Vaccine. Vaccine 21(16) 2003: 1776–1779.
5 Magill T, et al. A Clinical Evaluation of Vaccination Against Influenza: Preliminary Report. Amer. J. Hyg. 124, 1945: 982–985.
6 Govorkova EA, et al. Growth and Immunogenicity of Influenza Viruses Cultivated in Vero or MDCK Cells and in Embryonated Chicken Eggs. Dev. Biol. Stand. 98, 1999: 39–51.
7 Charlton Hume HK, Lua LH. Platform Technologies for Modern Vaccine Manufacturing. Vaccine 35, 2017: 4480–4485.
8 Aubrit F, et al. Cell Substrates for the Production of Viral Vaccines. Vaccine 33(44) 2015: 5905–5912.
9 Barrett PN, et al. Efficacy, Safety, and Immunogenicity of a Vero-Cell-Culture-Derived Trivalent Influenza Vaccine: A Multicentre, Double-Blind, Randomised, Placebo-Controlled Trial. Lancet 377(9767) 2011: 751–759.
10 Lee I, Kim JI, Park M-S. Cell Culture-Based Influenza Vaccines As Alternatives to Egg-Based Vaccines. J. Bacteriol. Virol. 43(1) 2013: 9–17.
11 Milián E, et al. Accelerated Mass Production of Influenza Virus Seed Stocks in HEK-293 Suspension Cell Cultures By Reverse Genetics. Vaccine 35(26) 2017: 3423–3430.
12 Whitford W, Fairbank A. Considerations in Scale-Up of Viral Vaccine Production. BioProcess Int. 9(8) 2011: 16–28.
13 Reisinger KS, et al. Subunit Influenza Vaccines Produced from Cell Culture or in Embryonated Chicken Eggs: Comparison of Safety, Reactogenicity, and Immunogenicity. J. Infect. Dis. 200(6) 2009: 849–857.
14 Aggarwal K, et al. Bioprocess Optimization for Cell Culture Based Influenza Vaccine Production. Vaccine 29(17) 2011: 3320–3328.
15 Ozturk SS, Jenkins N. New Directions in Pharmaceutical Process Development and Manufacturing: Process Analytical Technology (PAT), Quality By Design (QbD), Design Space (DS), and Other FDA Initiatives. Proceedings of the 21st Annual Meeting of ESACT 1, 2012: 731–733.
16 Kiralj R, Ferreira MMC. The Past, Present, and Future of Chemometrics Worldwide: Some Etymological, Linguistic, and Bibliometric Investigations. J. Chemometrics 20, 2006: 247–272.
17 Swarbrick B, Westad F. An Overview of Chemometrics for the Engineering and Measurement Sciences. Handbook of Measurement in Science and Engineering. Kutz M, Ed. John Wiley & Sons, Inc.: Hoboken, NJ, 2016: 2307–2407.
18 Teixeira AP, et al. Advances in On-Line Monitoring and Control of Mammalian Cell Cultures: Supporting the PAT Initiative. Biotechnol. Adv. 27(6) 2009: 726–732.
19 Zhao L, et al. Advances in Process Monitoring Tools for Cell Culture Bioprocesses. Eng. Life Sci. 15, 2015: 459–468.
20 Scarff M, et al. Near Infrared Spectroscopy for Bioprocess Monitoring and Control: Current Status and Future Trends. Crit. Rev. Biotechnol. 26(1) 2006: 17–39.
21 Milligan M, et al. Semisynthetic Model Calibration for Monitoring Glucose in Mammalian Cell Culture with In Situ Near Infrared Spectroscopy. Biotechnol. Bioeng. 111(5) 2014: 896–903.
Lucas Vann is a manager at the Biomanufacturing Training and Education Center, and corresponding author John D. Sheppard is a professor in the department of food, bioprocessing, and nutrition sciences at North Carolina State University; 1-919-513-0802, fax 1-919-515-7124; [email protected].
You May Also Like


